

Key Insights
The electric sports bike market is experiencing significant growth, driven by increasing environmental concerns, government regulations promoting electric vehicles, and technological advancements leading to improved battery performance and range. The market, estimated at $2 billion in 2025, is projected to exhibit a robust Compound Annual Growth Rate (CAGR) of 15% from 2025 to 2033. This growth is fueled by a rising demand for eco-friendly transportation options among younger demographics, coupled with the allure of high-performance electric motorcycles that rival or even surpass the capabilities of their gasoline-powered counterparts. Key market segments include high-performance models targeting enthusiasts, and more affordable options aimed at a wider consumer base. Leading manufacturers like KTM, Kawasaki, and Yamaha are investing heavily in R&D, introducing innovative designs and features to capture market share. However, challenges remain, including the relatively high initial cost of electric sports bikes compared to traditional models, limited charging infrastructure in certain regions, and concerns regarding battery life and charging times. Overcoming these hurdles will be critical for sustained market expansion.
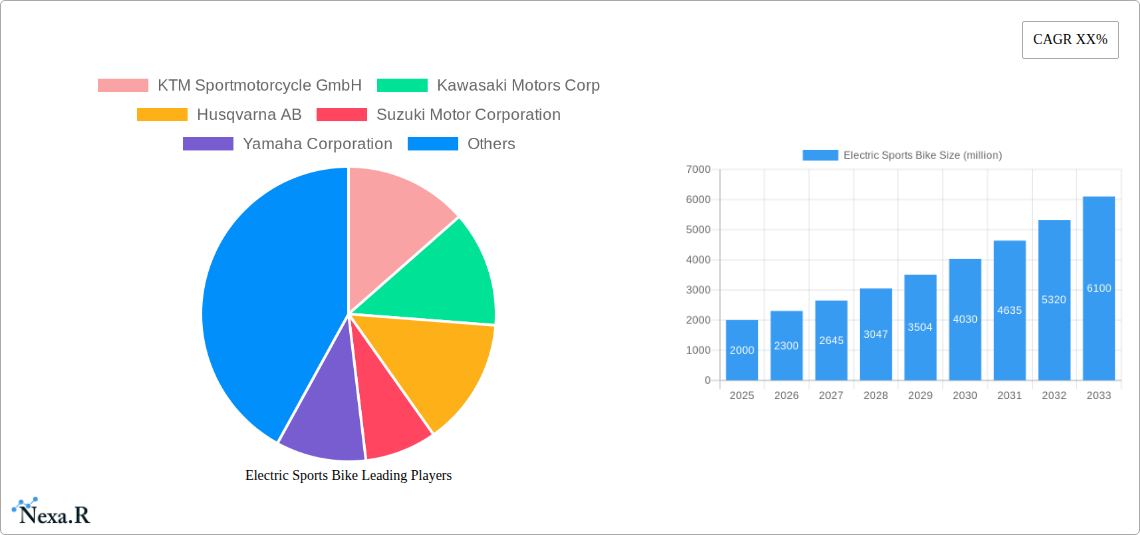
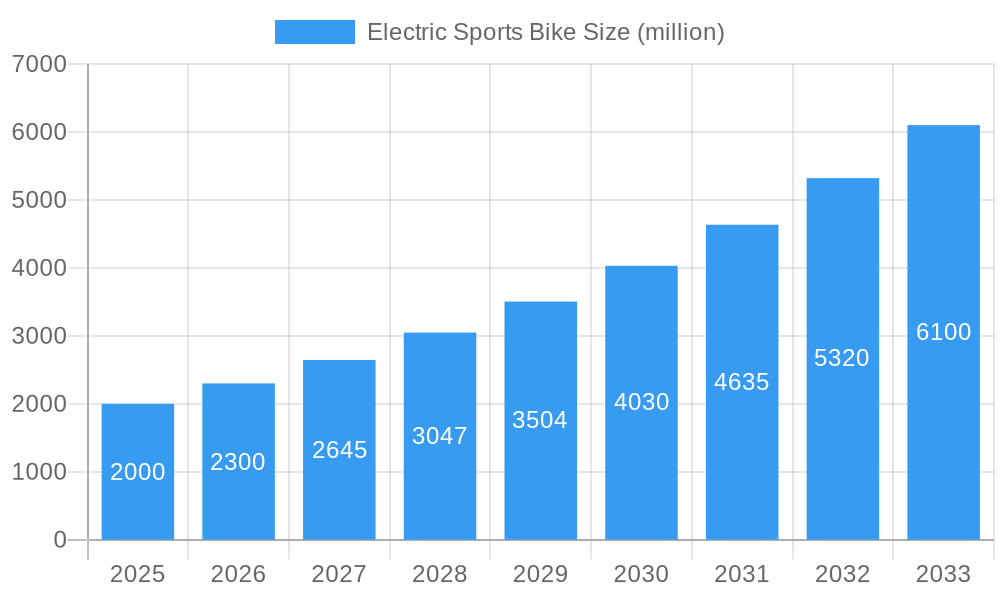
Electric Sports Bike Market Size (In Billion)
The competitive landscape is dynamic, with established players like KTM, Kawasaki, Yamaha, and Honda alongside emerging electric-focused companies like Zero Motorcycles and Energica vying for dominance. Strategic partnerships and collaborations are likely to increase, facilitating technological advancements and market penetration. Regional variations exist, with North America and Europe currently leading the market, but Asia-Pacific is expected to experience rapid growth in the coming years due to increasing disposable income and government initiatives promoting electric mobility. The forecast period of 2025-2033 will witness substantial innovation in battery technology, resulting in increased range, faster charging, and improved overall performance, thus potentially lowering the entry barrier for wider consumer adoption and accelerating market growth.
Electric Sports Bike Company Market Share
Electric Sports Bike Market Report: 2019-2033
This comprehensive report provides an in-depth analysis of the global electric sports bike market, encompassing market dynamics, growth trends, regional dominance, product landscape, challenges, opportunities, and key players. The study period covers 2019-2033, with 2025 serving as the base and estimated year. The forecast period spans 2025-2033, and the historical period is 2019-2024. This report is crucial for industry professionals, investors, and strategic decision-makers seeking a thorough understanding of this rapidly evolving sector.
Electric Sports Bike Market Dynamics & Structure
The global electric sports bike market is experiencing significant transformation driven by technological advancements, evolving consumer preferences, and supportive government policies. Market concentration is currently moderate, with a few key players holding substantial shares, but the landscape is rapidly changing due to new entrants and technological disruption. The market is segmented into various power classes (e.g., low-power, mid-power, high-power) and price points, catering to diverse consumer needs and preferences.
Market Concentration: The top 5 players currently hold approximately xx% of the global market share (2024 estimate). This concentration is expected to shift slightly by 2033 with the anticipated entry of new players and expansion from existing companies.
Technological Innovation Drivers: The integration of advanced battery technologies (e.g., solid-state batteries), improved motor efficiency, and connected vehicle features are major drivers. The development of faster charging infrastructure is critical to broader adoption.
Regulatory Frameworks: Government incentives, emissions regulations, and safety standards influence market growth. The evolving regulatory environment will be a key factor in shaping market dynamics, potentially favoring companies that prioritize sustainability and regulatory compliance.
Competitive Product Substitutes: Traditional gasoline-powered sports bikes remain a significant competitor. However, the increasing appeal of electric vehicles (EVs) due to lower running costs and environmental benefits is gradually eroding market share of traditional alternatives.
End-User Demographics: The target demographic primarily consists of young adults and affluent consumers, but the market is broadening to encompass environmentally conscious riders of all ages and income groups.
M&A Trends: The last 5 years have witnessed xx M&A deals (2019-2024) in the electric sports bike industry, primarily focused on technological acquisitions and market expansion. The forecast anticipates an increase to xx deals by 2033, driven by competition and the need for technological innovation.
Electric Sports Bike Growth Trends & Insights
The global electric sports bike market is exhibiting robust growth, driven by increasing consumer demand for eco-friendly transportation and technological advancements leading to enhanced performance and affordability. The market size is projected to reach xx million units by 2025 and xx million units by 2033, exhibiting a CAGR of xx% during the forecast period. This growth reflects a steady rise in adoption rates, with market penetration expected to increase from xx% in 2025 to xx% in 2033. Technological disruptions, such as advancements in battery technology and charging infrastructure, are accelerating this growth trajectory. Consumer behavior is also shifting toward a preference for electric vehicles, influenced by environmental concerns and rising fuel costs.
Dominant Regions, Countries, or Segments in Electric Sports Bike
North America and Europe currently lead the global electric sports bike market, driven by strong consumer demand, well-established charging infrastructure, and supportive government policies. Asia-Pacific is expected to experience significant growth in the coming years, fueled by rising disposable incomes, increasing environmental awareness, and government initiatives promoting EV adoption.
- North America: High disposable incomes, early adoption of EV technology, and a strong focus on environmental sustainability contribute to its market leadership.
- Europe: Stringent emission regulations, government incentives, and a developed charging infrastructure support the region's strong market position.
- Asia-Pacific: Rapid economic growth, increasing environmental awareness, and favorable government policies are driving substantial market expansion.
The high-performance segment (e.g., bikes with greater range and higher power output) shows the highest growth potential, although the mid-range segment will retain significant market share due to its affordability and accessibility.
Electric Sports Bike Product Landscape
The electric sports bike market features a wide range of models, varying in performance, features, and price points. Innovations are focused on extending battery range, improving charging speed, enhancing motor power, and integrating advanced safety and connectivity features. Many manufacturers emphasize lightweight designs, aerodynamic efficiency, and customizable rider interfaces to enhance the overall riding experience. Unique selling propositions include high torque at low speeds, near-silent operation, and advanced rider assistance systems.
Key Drivers, Barriers & Challenges in Electric Sports Bike
Key Drivers:
- Increasing consumer preference for environmentally friendly vehicles.
- Technological advancements leading to improved battery performance and charging infrastructure.
- Government incentives and subsidies promoting EV adoption.
Challenges and Restraints:
- High initial purchase cost compared to gasoline-powered bikes.
- Limited battery range and charging infrastructure in certain regions.
- Concerns about battery life and replacement costs. This results in an estimated xx% reduction in potential sales annually (2025-2033).
Emerging Opportunities in Electric Sports Bike
Emerging opportunities exist in developing markets with growing middle classes and increasing demand for personal transportation. Innovative applications, such as integration with smart city infrastructure and the development of specialized electric sports bikes for specific uses (e.g., track racing), present further growth avenues. The growing interest in personalized customization and connected features offers opportunities for premium-priced models with advanced technologies.
Growth Accelerators in the Electric Sports Bike Industry
Technological breakthroughs in battery technology, such as solid-state batteries, promise to dramatically extend range and reduce charging times, thereby accelerating market adoption. Strategic partnerships between manufacturers and energy companies to improve charging infrastructure are crucial. Market expansion into emerging economies with supportive government policies will also contribute to long-term growth.
Key Players Shaping the Electric Sports Bike Market
Notable Milestones in Electric Sports Bike Sector
- 2020: Zero Motorcycles launched its new electric sports bike model with extended range.
- 2022: KTM announced its first all-electric sports bike prototype.
- 2023: Several major manufacturers announced significant investments in battery technology research and development.
- 2024: Government incentives for electric motorcycle purchases increased in several key markets.
In-Depth Electric Sports Bike Market Outlook
The electric sports bike market is poised for substantial growth in the coming years, driven by ongoing technological advancements, favorable government policies, and shifting consumer preferences. Strategic opportunities exist for manufacturers to focus on enhancing battery technology, developing innovative features, and expanding into emerging markets. The potential for increased market penetration and the emergence of new players promise a dynamic and exciting future for the electric sports bike industry.
Electric Sports Bike Segmentation
-
1. Application
- 1.1. Online Sales
- 1.2. Offline Retail
-
2. Types
- 2.1. AC Motor
- 2.2. DC Motor
Electric Sports Bike Segmentation By Geography
-
1. North America
- 1.1. United States
- 1.2. Canada
- 1.3. Mexico
-
2. South America
- 2.1. Brazil
- 2.2. Argentina
- 2.3. Rest of South America
-
3. Europe
- 3.1. United Kingdom
- 3.2. Germany
- 3.3. France
- 3.4. Italy
- 3.5. Spain
- 3.6. Russia
- 3.7. Benelux
- 3.8. Nordics
- 3.9. Rest of Europe
-
4. Middle East & Africa
- 4.1. Turkey
- 4.2. Israel
- 4.3. GCC
- 4.4. North Africa
- 4.5. South Africa
- 4.6. Rest of Middle East & Africa
-
5. Asia Pacific
- 5.1. China
- 5.2. India
- 5.3. Japan
- 5.4. South Korea
- 5.5. ASEAN
- 5.6. Oceania
- 5.7. Rest of Asia Pacific

Electric Sports Bike Regional Market Share
Geographic Coverage of Electric Sports Bike
Electric Sports Bike REPORT HIGHLIGHTS
| Aspects | Details |
|---|---|
| Study Period | 2020-2034 |
| Base Year | 2025 |
| Estimated Year | 2026 |
| Forecast Period | 2026-2034 |
| Historical Period | 2020-2025 |
| Growth Rate | CAGR of 12.1% from 2020-2034 |
| Segmentation |
|
Table of Contents
- 1. Introduction
- 1.1. Research Scope
- 1.2. Market Segmentation
- 1.3. Research Methodology
- 1.4. Definitions and Assumptions
- 2. Executive Summary
- 2.1. Introduction
- 3. Market Dynamics
- 3.1. Introduction
- 3.2. Market Drivers
- 3.3. Market Restrains
- 3.4. Market Trends
- 4. Market Factor Analysis
- 4.1. Porters Five Forces
- 4.2. Supply/Value Chain
- 4.3. PESTEL analysis
- 4.4. Market Entropy
- 4.5. Patent/Trademark Analysis
- 5. Global Electric Sports Bike Analysis, Insights and Forecast, 2020-2032
- 5.1. Market Analysis, Insights and Forecast - by Application
- 5.1.1. Online Sales
- 5.1.2. Offline Retail
- 5.2. Market Analysis, Insights and Forecast - by Types
- 5.2.1. AC Motor
- 5.2.2. DC Motor
- 5.3. Market Analysis, Insights and Forecast - by Region
- 5.3.1. North America
- 5.3.2. South America
- 5.3.3. Europe
- 5.3.4. Middle East & Africa
- 5.3.5. Asia Pacific
- 5.1. Market Analysis, Insights and Forecast - by Application
- 6. North America Electric Sports Bike Analysis, Insights and Forecast, 2020-2032
- 6.1. Market Analysis, Insights and Forecast - by Application
- 6.1.1. Online Sales
- 6.1.2. Offline Retail
- 6.2. Market Analysis, Insights and Forecast - by Types
- 6.2.1. AC Motor
- 6.2.2. DC Motor
- 6.1. Market Analysis, Insights and Forecast - by Application
- 7. South America Electric Sports Bike Analysis, Insights and Forecast, 2020-2032
- 7.1. Market Analysis, Insights and Forecast - by Application
- 7.1.1. Online Sales
- 7.1.2. Offline Retail
- 7.2. Market Analysis, Insights and Forecast - by Types
- 7.2.1. AC Motor
- 7.2.2. DC Motor
- 7.1. Market Analysis, Insights and Forecast - by Application
- 8. Europe Electric Sports Bike Analysis, Insights and Forecast, 2020-2032
- 8.1. Market Analysis, Insights and Forecast - by Application
- 8.1.1. Online Sales
- 8.1.2. Offline Retail
- 8.2. Market Analysis, Insights and Forecast - by Types
- 8.2.1. AC Motor
- 8.2.2. DC Motor
- 8.1. Market Analysis, Insights and Forecast - by Application
- 9. Middle East & Africa Electric Sports Bike Analysis, Insights and Forecast, 2020-2032
- 9.1. Market Analysis, Insights and Forecast - by Application
- 9.1.1. Online Sales
- 9.1.2. Offline Retail
- 9.2. Market Analysis, Insights and Forecast - by Types
- 9.2.1. AC Motor
- 9.2.2. DC Motor
- 9.1. Market Analysis, Insights and Forecast - by Application
- 10. Asia Pacific Electric Sports Bike Analysis, Insights and Forecast, 2020-2032
- 10.1. Market Analysis, Insights and Forecast - by Application
- 10.1.1. Online Sales
- 10.1.2. Offline Retail
- 10.2. Market Analysis, Insights and Forecast - by Types
- 10.2.1. AC Motor
- 10.2.2. DC Motor
- 10.1. Market Analysis, Insights and Forecast - by Application
- 11. Competitive Analysis
- 11.1. Global Market Share Analysis 2025
- 11.2. Company Profiles
- 11.2.1 KTM Sportmotorcycle GmbH
- 11.2.1.1. Overview
- 11.2.1.2. Products
- 11.2.1.3. SWOT Analysis
- 11.2.1.4. Recent Developments
- 11.2.1.5. Financials (Based on Availability)
- 11.2.2 Kawasaki Motors Corp
- 11.2.2.1. Overview
- 11.2.2.2. Products
- 11.2.2.3. SWOT Analysis
- 11.2.2.4. Recent Developments
- 11.2.2.5. Financials (Based on Availability)
- 11.2.3 Husqvarna AB
- 11.2.3.1. Overview
- 11.2.3.2. Products
- 11.2.3.3. SWOT Analysis
- 11.2.3.4. Recent Developments
- 11.2.3.5. Financials (Based on Availability)
- 11.2.4 Suzuki Motor Corporation
- 11.2.4.1. Overview
- 11.2.4.2. Products
- 11.2.4.3. SWOT Analysis
- 11.2.4.4. Recent Developments
- 11.2.4.5. Financials (Based on Availability)
- 11.2.5 Yamaha Corporation
- 11.2.5.1. Overview
- 11.2.5.2. Products
- 11.2.5.3. SWOT Analysis
- 11.2.5.4. Recent Developments
- 11.2.5.5. Financials (Based on Availability)
- 11.2.6 Honda Motor Co.
- 11.2.6.1. Overview
- 11.2.6.2. Products
- 11.2.6.3. SWOT Analysis
- 11.2.6.4. Recent Developments
- 11.2.6.5. Financials (Based on Availability)
- 11.2.7 Ltd.
- 11.2.7.1. Overview
- 11.2.7.2. Products
- 11.2.7.3. SWOT Analysis
- 11.2.7.4. Recent Developments
- 11.2.7.5. Financials (Based on Availability)
- 11.2.8 TVS Motor Company
- 11.2.8.1. Overview
- 11.2.8.2. Products
- 11.2.8.3. SWOT Analysis
- 11.2.8.4. Recent Developments
- 11.2.8.5. Financials (Based on Availability)
- 11.2.9 Zero Motorcycles
- 11.2.9.1. Overview
- 11.2.9.2. Products
- 11.2.9.3. SWOT Analysis
- 11.2.9.4. Recent Developments
- 11.2.9.5. Financials (Based on Availability)
- 11.2.10 Inc.
- 11.2.10.1. Overview
- 11.2.10.2. Products
- 11.2.10.3. SWOT Analysis
- 11.2.10.4. Recent Developments
- 11.2.10.5. Financials (Based on Availability)
- 11.2.11 Lightning Motors Corp
- 11.2.11.1. Overview
- 11.2.11.2. Products
- 11.2.11.3. SWOT Analysis
- 11.2.11.4. Recent Developments
- 11.2.11.5. Financials (Based on Availability)
- 11.2.12 Triumph Motorcycles
- 11.2.12.1. Overview
- 11.2.12.2. Products
- 11.2.12.3. SWOT Analysis
- 11.2.12.4. Recent Developments
- 11.2.12.5. Financials (Based on Availability)
- 11.2.13 VMOTO LIMITED
- 11.2.13.1. Overview
- 11.2.13.2. Products
- 11.2.13.3. SWOT Analysis
- 11.2.13.4. Recent Developments
- 11.2.13.5. Financials (Based on Availability)
- 11.2.14 AUDI AG
- 11.2.14.1. Overview
- 11.2.14.2. Products
- 11.2.14.3. SWOT Analysis
- 11.2.14.4. Recent Developments
- 11.2.14.5. Financials (Based on Availability)
- 11.2.15 Energica Motor Company Inc.
- 11.2.15.1. Overview
- 11.2.15.2. Products
- 11.2.15.3. SWOT Analysis
- 11.2.15.4. Recent Developments
- 11.2.15.5. Financials (Based on Availability)
- 11.2.1 KTM Sportmotorcycle GmbH
List of Figures
- Figure 1: Global Electric Sports Bike Revenue Breakdown (undefined, %) by Region 2025 & 2033
- Figure 2: North America Electric Sports Bike Revenue (undefined), by Application 2025 & 2033
- Figure 3: North America Electric Sports Bike Revenue Share (%), by Application 2025 & 2033
- Figure 4: North America Electric Sports Bike Revenue (undefined), by Types 2025 & 2033
- Figure 5: North America Electric Sports Bike Revenue Share (%), by Types 2025 & 2033
- Figure 6: North America Electric Sports Bike Revenue (undefined), by Country 2025 & 2033
- Figure 7: North America Electric Sports Bike Revenue Share (%), by Country 2025 & 2033
- Figure 8: South America Electric Sports Bike Revenue (undefined), by Application 2025 & 2033
- Figure 9: South America Electric Sports Bike Revenue Share (%), by Application 2025 & 2033
- Figure 10: South America Electric Sports Bike Revenue (undefined), by Types 2025 & 2033
- Figure 11: South America Electric Sports Bike Revenue Share (%), by Types 2025 & 2033
- Figure 12: South America Electric Sports Bike Revenue (undefined), by Country 2025 & 2033
- Figure 13: South America Electric Sports Bike Revenue Share (%), by Country 2025 & 2033
- Figure 14: Europe Electric Sports Bike Revenue (undefined), by Application 2025 & 2033
- Figure 15: Europe Electric Sports Bike Revenue Share (%), by Application 2025 & 2033
- Figure 16: Europe Electric Sports Bike Revenue (undefined), by Types 2025 & 2033
- Figure 17: Europe Electric Sports Bike Revenue Share (%), by Types 2025 & 2033
- Figure 18: Europe Electric Sports Bike Revenue (undefined), by Country 2025 & 2033
- Figure 19: Europe Electric Sports Bike Revenue Share (%), by Country 2025 & 2033
- Figure 20: Middle East & Africa Electric Sports Bike Revenue (undefined), by Application 2025 & 2033
- Figure 21: Middle East & Africa Electric Sports Bike Revenue Share (%), by Application 2025 & 2033
- Figure 22: Middle East & Africa Electric Sports Bike Revenue (undefined), by Types 2025 & 2033
- Figure 23: Middle East & Africa Electric Sports Bike Revenue Share (%), by Types 2025 & 2033
- Figure 24: Middle East & Africa Electric Sports Bike Revenue (undefined), by Country 2025 & 2033
- Figure 25: Middle East & Africa Electric Sports Bike Revenue Share (%), by Country 2025 & 2033
- Figure 26: Asia Pacific Electric Sports Bike Revenue (undefined), by Application 2025 & 2033
- Figure 27: Asia Pacific Electric Sports Bike Revenue Share (%), by Application 2025 & 2033
- Figure 28: Asia Pacific Electric Sports Bike Revenue (undefined), by Types 2025 & 2033
- Figure 29: Asia Pacific Electric Sports Bike Revenue Share (%), by Types 2025 & 2033
- Figure 30: Asia Pacific Electric Sports Bike Revenue (undefined), by Country 2025 & 2033
- Figure 31: Asia Pacific Electric Sports Bike Revenue Share (%), by Country 2025 & 2033
List of Tables
- Table 1: Global Electric Sports Bike Revenue undefined Forecast, by Application 2020 & 2033
- Table 2: Global Electric Sports Bike Revenue undefined Forecast, by Types 2020 & 2033
- Table 3: Global Electric Sports Bike Revenue undefined Forecast, by Region 2020 & 2033
- Table 4: Global Electric Sports Bike Revenue undefined Forecast, by Application 2020 & 2033
- Table 5: Global Electric Sports Bike Revenue undefined Forecast, by Types 2020 & 2033
- Table 6: Global Electric Sports Bike Revenue undefined Forecast, by Country 2020 & 2033
- Table 7: United States Electric Sports Bike Revenue (undefined) Forecast, by Application 2020 & 2033
- Table 8: Canada Electric Sports Bike Revenue (undefined) Forecast, by Application 2020 & 2033
- Table 9: Mexico Electric Sports Bike Revenue (undefined) Forecast, by Application 2020 & 2033
- Table 10: Global Electric Sports Bike Revenue undefined Forecast, by Application 2020 & 2033
- Table 11: Global Electric Sports Bike Revenue undefined Forecast, by Types 2020 & 2033
- Table 12: Global Electric Sports Bike Revenue undefined Forecast, by Country 2020 & 2033
- Table 13: Brazil Electric Sports Bike Revenue (undefined) Forecast, by Application 2020 & 2033
- Table 14: Argentina Electric Sports Bike Revenue (undefined) Forecast, by Application 2020 & 2033
- Table 15: Rest of South America Electric Sports Bike Revenue (undefined) Forecast, by Application 2020 & 2033
- Table 16: Global Electric Sports Bike Revenue undefined Forecast, by Application 2020 & 2033
- Table 17: Global Electric Sports Bike Revenue undefined Forecast, by Types 2020 & 2033
- Table 18: Global Electric Sports Bike Revenue undefined Forecast, by Country 2020 & 2033
- Table 19: United Kingdom Electric Sports Bike Revenue (undefined) Forecast, by Application 2020 & 2033
- Table 20: Germany Electric Sports Bike Revenue (undefined) Forecast, by Application 2020 & 2033
- Table 21: France Electric Sports Bike Revenue (undefined) Forecast, by Application 2020 & 2033
- Table 22: Italy Electric Sports Bike Revenue (undefined) Forecast, by Application 2020 & 2033
- Table 23: Spain Electric Sports Bike Revenue (undefined) Forecast, by Application 2020 & 2033
- Table 24: Russia Electric Sports Bike Revenue (undefined) Forecast, by Application 2020 & 2033
- Table 25: Benelux Electric Sports Bike Revenue (undefined) Forecast, by Application 2020 & 2033
- Table 26: Nordics Electric Sports Bike Revenue (undefined) Forecast, by Application 2020 & 2033
- Table 27: Rest of Europe Electric Sports Bike Revenue (undefined) Forecast, by Application 2020 & 2033
- Table 28: Global Electric Sports Bike Revenue undefined Forecast, by Application 2020 & 2033
- Table 29: Global Electric Sports Bike Revenue undefined Forecast, by Types 2020 & 2033
- Table 30: Global Electric Sports Bike Revenue undefined Forecast, by Country 2020 & 2033
- Table 31: Turkey Electric Sports Bike Revenue (undefined) Forecast, by Application 2020 & 2033
- Table 32: Israel Electric Sports Bike Revenue (undefined) Forecast, by Application 2020 & 2033
- Table 33: GCC Electric Sports Bike Revenue (undefined) Forecast, by Application 2020 & 2033
- Table 34: North Africa Electric Sports Bike Revenue (undefined) Forecast, by Application 2020 & 2033
- Table 35: South Africa Electric Sports Bike Revenue (undefined) Forecast, by Application 2020 & 2033
- Table 36: Rest of Middle East & Africa Electric Sports Bike Revenue (undefined) Forecast, by Application 2020 & 2033
- Table 37: Global Electric Sports Bike Revenue undefined Forecast, by Application 2020 & 2033
- Table 38: Global Electric Sports Bike Revenue undefined Forecast, by Types 2020 & 2033
- Table 39: Global Electric Sports Bike Revenue undefined Forecast, by Country 2020 & 2033
- Table 40: China Electric Sports Bike Revenue (undefined) Forecast, by Application 2020 & 2033
- Table 41: India Electric Sports Bike Revenue (undefined) Forecast, by Application 2020 & 2033
- Table 42: Japan Electric Sports Bike Revenue (undefined) Forecast, by Application 2020 & 2033
- Table 43: South Korea Electric Sports Bike Revenue (undefined) Forecast, by Application 2020 & 2033
- Table 44: ASEAN Electric Sports Bike Revenue (undefined) Forecast, by Application 2020 & 2033
- Table 45: Oceania Electric Sports Bike Revenue (undefined) Forecast, by Application 2020 & 2033
- Table 46: Rest of Asia Pacific Electric Sports Bike Revenue (undefined) Forecast, by Application 2020 & 2033
Frequently Asked Questions
1. What is the projected Compound Annual Growth Rate (CAGR) of the Electric Sports Bike?
The projected CAGR is approximately 12.1%.
2. Which companies are prominent players in the Electric Sports Bike?
Key companies in the market include KTM Sportmotorcycle GmbH, Kawasaki Motors Corp, Husqvarna AB, Suzuki Motor Corporation, Yamaha Corporation, Honda Motor Co., Ltd., TVS Motor Company, Zero Motorcycles, Inc., Lightning Motors Corp, Triumph Motorcycles, VMOTO LIMITED, AUDI AG, Energica Motor Company Inc..
3. What are the main segments of the Electric Sports Bike?
The market segments include Application, Types.
4. Can you provide details about the market size?
The market size is estimated to be USD XXX N/A as of 2022.
5. What are some drivers contributing to market growth?
N/A
6. What are the notable trends driving market growth?
N/A
7. Are there any restraints impacting market growth?
N/A
8. Can you provide examples of recent developments in the market?
N/A
9. What pricing options are available for accessing the report?
Pricing options include single-user, multi-user, and enterprise licenses priced at USD 2900.00, USD 4350.00, and USD 5800.00 respectively.
10. Is the market size provided in terms of value or volume?
The market size is provided in terms of value, measured in N/A.
11. Are there any specific market keywords associated with the report?
Yes, the market keyword associated with the report is "Electric Sports Bike," which aids in identifying and referencing the specific market segment covered.
12. How do I determine which pricing option suits my needs best?
The pricing options vary based on user requirements and access needs. Individual users may opt for single-user licenses, while businesses requiring broader access may choose multi-user or enterprise licenses for cost-effective access to the report.
13. Are there any additional resources or data provided in the Electric Sports Bike report?
While the report offers comprehensive insights, it's advisable to review the specific contents or supplementary materials provided to ascertain if additional resources or data are available.
14. How can I stay updated on further developments or reports in the Electric Sports Bike?
To stay informed about further developments, trends, and reports in the Electric Sports Bike, consider subscribing to industry newsletters, following relevant companies and organizations, or regularly checking reputable industry news sources and publications.
Methodology
Step 1 - Identification of Relevant Samples Size from Population Database


Step 2 - Approaches for Defining Global Market Size (Value, Volume* & Price*)

Note*: In applicable scenarios
Step 3 - Data Sources
Primary Research
- Web Analytics
- Survey Reports
- Research Institute
- Latest Research Reports
- Opinion Leaders
Secondary Research
- Annual Reports
- White Paper
- Latest Press Release
- Industry Association
- Paid Database
- Investor Presentations

Step 4 - Data Triangulation
Involves using different sources of information in order to increase the validity of a study
These sources are likely to be stakeholders in a program - participants, other researchers, program staff, other community members, and so on.
Then we put all data in single framework & apply various statistical tools to find out the dynamic on the market.
During the analysis stage, feedback from the stakeholder groups would be compared to determine areas of agreement as well as areas of divergence