

Key Insights
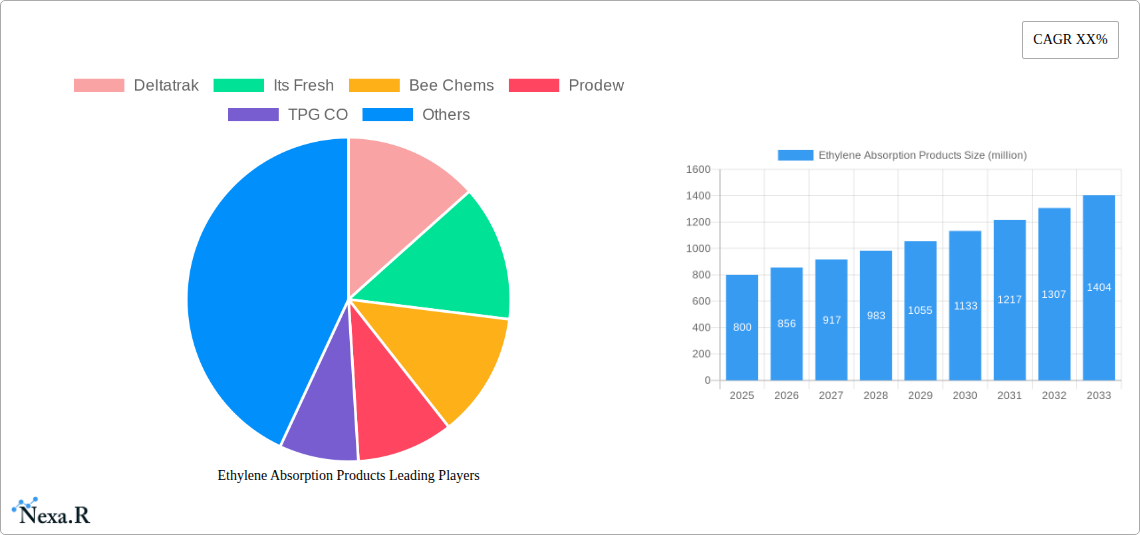
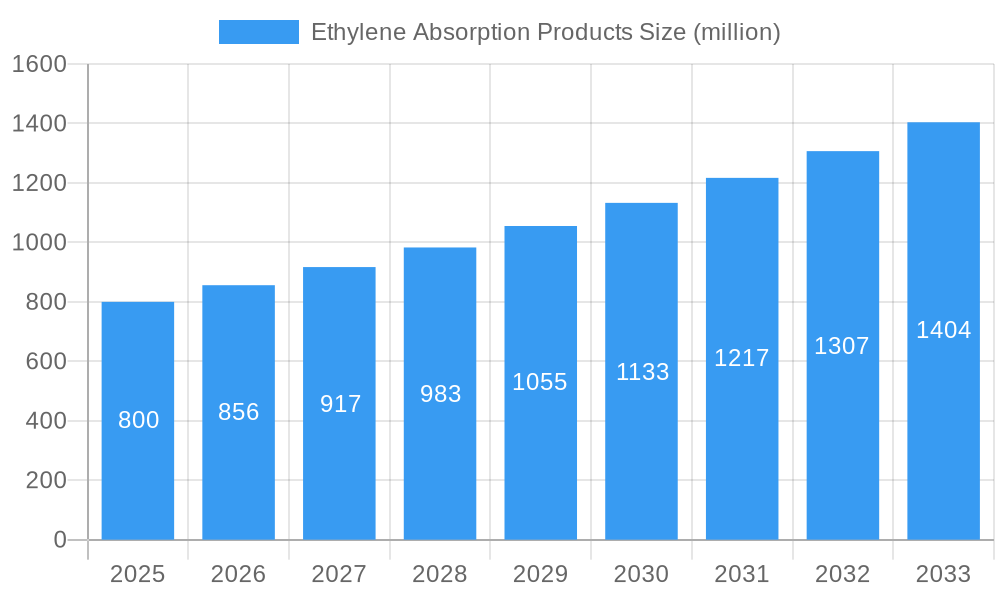
The global market for ethylene absorption products is experiencing robust growth, driven by increasing demand for extending the shelf life of perishable goods across the food and agricultural sectors. The rising consumer preference for fresh produce and the need to minimize food waste are key factors fueling this expansion. Technological advancements in ethylene absorption technologies, such as the development of more efficient and cost-effective solutions, are further stimulating market growth. Furthermore, the growing adoption of active and passive ethylene absorption techniques in various storage and transportation methods is contributing significantly to the market's expansion. We estimate the market size to be around $800 million in 2025, exhibiting a Compound Annual Growth Rate (CAGR) of approximately 7% from 2025-2033. This growth is projected to be propelled by the increasing adoption of innovative solutions in the developing economies of Asia and South America.
Ethylene Absorption Products Market Size (In Million)
However, the market also faces certain challenges. High initial investment costs associated with implementing ethylene absorption technologies, particularly in smaller businesses, can serve as a restraint. Furthermore, the availability of cheaper alternatives and the potential for inconsistent efficacy of certain products can hinder widespread adoption. Nevertheless, the ongoing advancements in the technology, coupled with a rising global awareness of food waste reduction and the need to maintain product quality, are expected to overcome these limitations, ensuring sustained market growth over the forecast period. Key segments within the market include active and passive ethylene absorption products, each serving specific applications and target markets. Competition is characterized by both large multinational corporations and smaller, specialized firms, fostering innovation and diverse product offerings.
Ethylene Absorption Products Company Market Share
Ethylene Absorption Products Market Report: 2019-2033
This comprehensive report provides an in-depth analysis of the Ethylene Absorption Products market, encompassing market dynamics, growth trends, regional analysis, product landscape, key players, and future outlook. The study period covers 2019-2033, with a base year of 2025 and a forecast period of 2025-2033. The report caters to industry professionals, investors, and researchers seeking a thorough understanding of this crucial market segment within the broader agricultural technology and food preservation sectors. The market size in 2025 is estimated at XX million units.
Ethylene Absorption Products Market Dynamics & Structure
The Ethylene Absorption Products market exhibits a moderately concentrated structure, with several key players vying for market share. Technological innovation, driven by the need for more effective and sustainable solutions, is a major driver. Stringent regulatory frameworks regarding food safety and environmental impact also influence market dynamics. Competitive substitutes, such as modified atmosphere packaging (MAP), exert pressure, while the increasing demand for fresh produce fuels growth. Mergers and acquisitions (M&A) activity is moderate, with strategic alliances shaping the competitive landscape. The parent market is the broader agricultural technology sector, while the child market focuses specifically on post-harvest technologies.
- Market Concentration: Moderately concentrated, with the top 5 players holding approximately xx% of the market share in 2025.
- Technological Innovation: Focus on developing more efficient and cost-effective absorption materials, smart sensors, and integrated systems.
- Regulatory Landscape: Stringent regulations regarding food safety and environmental compliance drive innovation and market growth.
- M&A Activity: xx major M&A deals were recorded between 2019 and 2024, with an average deal value of xx million units.
- Competitive Substitutes: Modified Atmosphere Packaging (MAP) and other preservation technologies pose a significant competitive threat.
- End-User Demographics: Primarily focused on the agricultural sector, with increasing adoption by food retailers and logistics companies.
Ethylene Absorption Products Growth Trends & Insights
The Ethylene Absorption Products market experienced significant growth during the historical period (2019-2024), driven by increasing consumer demand for fresh produce and advancements in ethylene absorption technologies. The market size is projected to grow at a CAGR of xx% during the forecast period (2025-2033), reaching an estimated xx million units by 2033. This growth is fueled by technological advancements, rising consumer awareness of food quality, and the expansion of global trade in fresh produce. Market penetration in key regions remains relatively low, indicating substantial growth potential. Consumer behavior shifts towards convenience and a preference for fresh products are also driving market demand.
Dominant Regions, Countries, or Segments in Ethylene Absorption Products
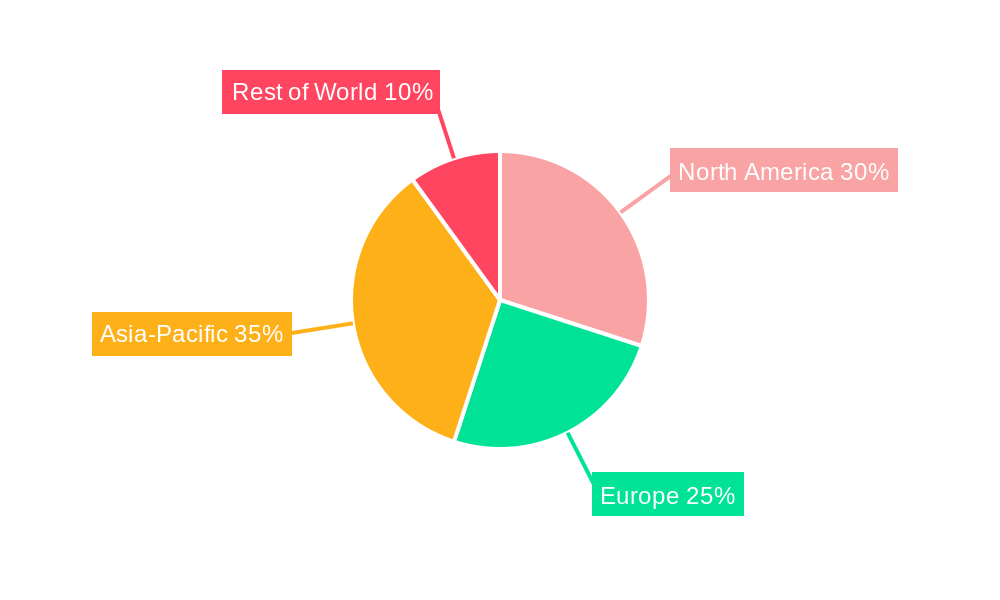
North America currently dominates the Ethylene Absorption Products market, driven by strong consumer demand, advanced agricultural practices, and a robust infrastructure for fresh produce distribution. Europe holds a substantial share, followed by Asia-Pacific, where growth is fueled by rising disposable incomes and increasing awareness of food preservation technologies. The segments exhibiting the strongest growth are those catering to large-scale agricultural operations and the cold-chain logistics sector.
- Key Drivers (North America): High consumer demand for fresh produce, extensive cold chain infrastructure, advanced agricultural technologies.
- Key Drivers (Europe): Strong regulatory framework supporting food safety and environmental sustainability, increasing demand for organic produce.
- Key Drivers (Asia-Pacific): Rising disposable incomes, increasing awareness of food waste reduction, expansion of the cold chain infrastructure.
- Market Share: North America holds approximately xx% of the market share in 2025, with Europe at xx% and Asia-Pacific at xx%.
Ethylene Absorption Products Product Landscape
The Ethylene Absorption Products market offers a range of solutions, from simple sachets and filters to sophisticated, integrated systems combining absorption with other preservation technologies. These products are designed to meet diverse application requirements across various produce types and storage conditions. Key technological advancements include the development of highly porous materials with enhanced absorption capacity, incorporation of indicators for optimal replacement timing, and development of sustainable and biodegradable materials.
Key Drivers, Barriers & Challenges in Ethylene Absorption Products
Key Drivers:
- Increasing consumer demand for fresh produce
- Technological advancements leading to improved efficacy and cost-effectiveness
- Growing awareness of food waste reduction
- Expansion of global trade in fresh produce
Challenges & Restraints:
- High initial investment costs for some advanced systems
- Potential for limited shelf-life extension in certain produce types
- Limited awareness and adoption in developing countries
- Fluctuations in raw material prices
Emerging Opportunities in Ethylene Absorption Products
Emerging opportunities include the development of tailored solutions for specific produce types, integration with smart agricultural technologies (e.g., IoT sensors), and expansion into new markets with high potential for growth. There’s also a growing demand for sustainable and biodegradable materials, presenting an opportunity for eco-friendly products. The development of combined solutions offering ethylene absorption and other preservation techniques like humidity control can also drive substantial growth.
Growth Accelerators in the Ethylene Absorption Products Industry
Long-term growth will be propelled by continuous technological advancements, leading to more efficient and cost-effective solutions. Strategic partnerships between technology providers and large agricultural operations will accelerate adoption. Market expansion into developing economies with high growth potential will also contribute to overall industry growth. The growing emphasis on sustainability and eco-friendly practices will drive demand for sustainable and biodegradable products.
Key Players Shaping the Ethylene Absorption Products Market
- Deltatrak
- Its Fresh
- Bee Chems
- Prodew
- TPG CO,.LTD.
- It's Fresh Inc
- BioXTEND
- Ethylene Control
- Greenkeeper Iberia
- Befresh Technology (Kerako Ceramic Technologies)
- Sensitech
- Secco International Group
- Isolcell S.p.A.
- OhE Chemicals
- Purafil
- Desiccare
- Molina de Segura
- KeepFresh Technologies
- Praxas
- Bioconservacion, S.A.
- Lipmen CO.,Ltd
- Hazel Technologies
- Environ Care Products LLP
- Keep-It-Fresh
- Chunwang Environmental Protection Technology
Notable Milestones in Ethylene Absorption Products Sector
- 2020: Introduction of biodegradable ethylene absorption sachets by [Company Name].
- 2022: Partnership between [Company Name] and [Company Name] to develop an integrated system combining ethylene absorption and temperature control.
- 2023: Acquisition of [Company Name] by [Company Name], expanding the market reach of advanced ethylene absorption technologies.
- 2024: Launch of a new generation of high-capacity ethylene absorption materials by [Company Name]. (Further milestones need to be added based on available data).
In-Depth Ethylene Absorption Products Market Outlook
The Ethylene Absorption Products market is poised for robust growth in the coming years, driven by technological innovation, expanding adoption, and strategic partnerships. The focus on sustainable solutions and integration with smart agricultural technologies presents significant opportunities for market players. The potential for market expansion into developing economies further enhances the long-term outlook, promising substantial growth and opportunities for innovation and investment.
Ethylene Absorption Products Segmentation
-
1. Application
- 1.1. Domestic
- 1.2. Commercial
-
2. Types
- 2.1. Ethylene Filter
- 2.2. Ethylene Sachet
- 2.3. Ethylene Sheet
- 2.4. Ethylene Pad
Ethylene Absorption Products Segmentation By Geography
-
1. North America
- 1.1. United States
- 1.2. Canada
- 1.3. Mexico
-
2. South America
- 2.1. Brazil
- 2.2. Argentina
- 2.3. Rest of South America
-
3. Europe
- 3.1. United Kingdom
- 3.2. Germany
- 3.3. France
- 3.4. Italy
- 3.5. Spain
- 3.6. Russia
- 3.7. Benelux
- 3.8. Nordics
- 3.9. Rest of Europe
-
4. Middle East & Africa
- 4.1. Turkey
- 4.2. Israel
- 4.3. GCC
- 4.4. North Africa
- 4.5. South Africa
- 4.6. Rest of Middle East & Africa
-
5. Asia Pacific
- 5.1. China
- 5.2. India
- 5.3. Japan
- 5.4. South Korea
- 5.5. ASEAN
- 5.6. Oceania
- 5.7. Rest of Asia Pacific
Ethylene Absorption Products Regional Market Share
Geographic Coverage of Ethylene Absorption Products
Ethylene Absorption Products REPORT HIGHLIGHTS
| Aspects | Details |
|---|---|
| Study Period | 2020-2034 |
| Base Year | 2025 |
| Estimated Year | 2026 |
| Forecast Period | 2026-2034 |
| Historical Period | 2020-2025 |
| Growth Rate | CAGR of 21.89% from 2020-2034 |
| Segmentation |
|
Table of Contents
- 1. Introduction
- 1.1. Research Scope
- 1.2. Market Segmentation
- 1.3. Research Methodology
- 1.4. Definitions and Assumptions
- 2. Executive Summary
- 2.1. Introduction
- 3. Market Dynamics
- 3.1. Introduction
- 3.2. Market Drivers
- 3.3. Market Restrains
- 3.4. Market Trends
- 4. Market Factor Analysis
- 4.1. Porters Five Forces
- 4.2. Supply/Value Chain
- 4.3. PESTEL analysis
- 4.4. Market Entropy
- 4.5. Patent/Trademark Analysis
- 5. Global Ethylene Absorption Products Analysis, Insights and Forecast, 2020-2032
- 5.1. Market Analysis, Insights and Forecast - by Application
- 5.1.1. Domestic
- 5.1.2. Commercial
- 5.2. Market Analysis, Insights and Forecast - by Types
- 5.2.1. Ethylene Filter
- 5.2.2. Ethylene Sachet
- 5.2.3. Ethylene Sheet
- 5.2.4. Ethylene Pad
- 5.3. Market Analysis, Insights and Forecast - by Region
- 5.3.1. North America
- 5.3.2. South America
- 5.3.3. Europe
- 5.3.4. Middle East & Africa
- 5.3.5. Asia Pacific
- 5.1. Market Analysis, Insights and Forecast - by Application
- 6. North America Ethylene Absorption Products Analysis, Insights and Forecast, 2020-2032
- 6.1. Market Analysis, Insights and Forecast - by Application
- 6.1.1. Domestic
- 6.1.2. Commercial
- 6.2. Market Analysis, Insights and Forecast - by Types
- 6.2.1. Ethylene Filter
- 6.2.2. Ethylene Sachet
- 6.2.3. Ethylene Sheet
- 6.2.4. Ethylene Pad
- 6.1. Market Analysis, Insights and Forecast - by Application
- 7. South America Ethylene Absorption Products Analysis, Insights and Forecast, 2020-2032
- 7.1. Market Analysis, Insights and Forecast - by Application
- 7.1.1. Domestic
- 7.1.2. Commercial
- 7.2. Market Analysis, Insights and Forecast - by Types
- 7.2.1. Ethylene Filter
- 7.2.2. Ethylene Sachet
- 7.2.3. Ethylene Sheet
- 7.2.4. Ethylene Pad
- 7.1. Market Analysis, Insights and Forecast - by Application
- 8. Europe Ethylene Absorption Products Analysis, Insights and Forecast, 2020-2032
- 8.1. Market Analysis, Insights and Forecast - by Application
- 8.1.1. Domestic
- 8.1.2. Commercial
- 8.2. Market Analysis, Insights and Forecast - by Types
- 8.2.1. Ethylene Filter
- 8.2.2. Ethylene Sachet
- 8.2.3. Ethylene Sheet
- 8.2.4. Ethylene Pad
- 8.1. Market Analysis, Insights and Forecast - by Application
- 9. Middle East & Africa Ethylene Absorption Products Analysis, Insights and Forecast, 2020-2032
- 9.1. Market Analysis, Insights and Forecast - by Application
- 9.1.1. Domestic
- 9.1.2. Commercial
- 9.2. Market Analysis, Insights and Forecast - by Types
- 9.2.1. Ethylene Filter
- 9.2.2. Ethylene Sachet
- 9.2.3. Ethylene Sheet
- 9.2.4. Ethylene Pad
- 9.1. Market Analysis, Insights and Forecast - by Application
- 10. Asia Pacific Ethylene Absorption Products Analysis, Insights and Forecast, 2020-2032
- 10.1. Market Analysis, Insights and Forecast - by Application
- 10.1.1. Domestic
- 10.1.2. Commercial
- 10.2. Market Analysis, Insights and Forecast - by Types
- 10.2.1. Ethylene Filter
- 10.2.2. Ethylene Sachet
- 10.2.3. Ethylene Sheet
- 10.2.4. Ethylene Pad
- 10.1. Market Analysis, Insights and Forecast - by Application
- 11. Competitive Analysis
- 11.1. Global Market Share Analysis 2025
- 11.2. Company Profiles
- 11.2.1 Deltatrak
- 11.2.1.1. Overview
- 11.2.1.2. Products
- 11.2.1.3. SWOT Analysis
- 11.2.1.4. Recent Developments
- 11.2.1.5. Financials (Based on Availability)
- 11.2.2 Its Fresh
- 11.2.2.1. Overview
- 11.2.2.2. Products
- 11.2.2.3. SWOT Analysis
- 11.2.2.4. Recent Developments
- 11.2.2.5. Financials (Based on Availability)
- 11.2.3 Bee Chems
- 11.2.3.1. Overview
- 11.2.3.2. Products
- 11.2.3.3. SWOT Analysis
- 11.2.3.4. Recent Developments
- 11.2.3.5. Financials (Based on Availability)
- 11.2.4 Prodew
- 11.2.4.1. Overview
- 11.2.4.2. Products
- 11.2.4.3. SWOT Analysis
- 11.2.4.4. Recent Developments
- 11.2.4.5. Financials (Based on Availability)
- 11.2.5 TPG CO
- 11.2.5.1. Overview
- 11.2.5.2. Products
- 11.2.5.3. SWOT Analysis
- 11.2.5.4. Recent Developments
- 11.2.5.5. Financials (Based on Availability)
- 11.2.6 .LTD.
- 11.2.6.1. Overview
- 11.2.6.2. Products
- 11.2.6.3. SWOT Analysis
- 11.2.6.4. Recent Developments
- 11.2.6.5. Financials (Based on Availability)
- 11.2.7 It's Fresh Inc
- 11.2.7.1. Overview
- 11.2.7.2. Products
- 11.2.7.3. SWOT Analysis
- 11.2.7.4. Recent Developments
- 11.2.7.5. Financials (Based on Availability)
- 11.2.8 BioXTEND
- 11.2.8.1. Overview
- 11.2.8.2. Products
- 11.2.8.3. SWOT Analysis
- 11.2.8.4. Recent Developments
- 11.2.8.5. Financials (Based on Availability)
- 11.2.9 Ethylene Control
- 11.2.9.1. Overview
- 11.2.9.2. Products
- 11.2.9.3. SWOT Analysis
- 11.2.9.4. Recent Developments
- 11.2.9.5. Financials (Based on Availability)
- 11.2.10 Greenkeeper Iberia
- 11.2.10.1. Overview
- 11.2.10.2. Products
- 11.2.10.3. SWOT Analysis
- 11.2.10.4. Recent Developments
- 11.2.10.5. Financials (Based on Availability)
- 11.2.11 Befresh Technology (Kerako Ceramic Technologies)
- 11.2.11.1. Overview
- 11.2.11.2. Products
- 11.2.11.3. SWOT Analysis
- 11.2.11.4. Recent Developments
- 11.2.11.5. Financials (Based on Availability)
- 11.2.12 Sensitech
- 11.2.12.1. Overview
- 11.2.12.2. Products
- 11.2.12.3. SWOT Analysis
- 11.2.12.4. Recent Developments
- 11.2.12.5. Financials (Based on Availability)
- 11.2.13 Secco International Group
- 11.2.13.1. Overview
- 11.2.13.2. Products
- 11.2.13.3. SWOT Analysis
- 11.2.13.4. Recent Developments
- 11.2.13.5. Financials (Based on Availability)
- 11.2.14 Isolcell S.p.A.
- 11.2.14.1. Overview
- 11.2.14.2. Products
- 11.2.14.3. SWOT Analysis
- 11.2.14.4. Recent Developments
- 11.2.14.5. Financials (Based on Availability)
- 11.2.15 OhE Chemicals
- 11.2.15.1. Overview
- 11.2.15.2. Products
- 11.2.15.3. SWOT Analysis
- 11.2.15.4. Recent Developments
- 11.2.15.5. Financials (Based on Availability)
- 11.2.16 Purafil
- 11.2.16.1. Overview
- 11.2.16.2. Products
- 11.2.16.3. SWOT Analysis
- 11.2.16.4. Recent Developments
- 11.2.16.5. Financials (Based on Availability)
- 11.2.17 Desiccare
- 11.2.17.1. Overview
- 11.2.17.2. Products
- 11.2.17.3. SWOT Analysis
- 11.2.17.4. Recent Developments
- 11.2.17.5. Financials (Based on Availability)
- 11.2.18 Molina de Segura
- 11.2.18.1. Overview
- 11.2.18.2. Products
- 11.2.18.3. SWOT Analysis
- 11.2.18.4. Recent Developments
- 11.2.18.5. Financials (Based on Availability)
- 11.2.19 KeepFresh Technologies
- 11.2.19.1. Overview
- 11.2.19.2. Products
- 11.2.19.3. SWOT Analysis
- 11.2.19.4. Recent Developments
- 11.2.19.5. Financials (Based on Availability)
- 11.2.20 Praxas
- 11.2.20.1. Overview
- 11.2.20.2. Products
- 11.2.20.3. SWOT Analysis
- 11.2.20.4. Recent Developments
- 11.2.20.5. Financials (Based on Availability)
- 11.2.21 Bioconservacion
- 11.2.21.1. Overview
- 11.2.21.2. Products
- 11.2.21.3. SWOT Analysis
- 11.2.21.4. Recent Developments
- 11.2.21.5. Financials (Based on Availability)
- 11.2.22 S.A.
- 11.2.22.1. Overview
- 11.2.22.2. Products
- 11.2.22.3. SWOT Analysis
- 11.2.22.4. Recent Developments
- 11.2.22.5. Financials (Based on Availability)
- 11.2.23 Lipmen CO.
- 11.2.23.1. Overview
- 11.2.23.2. Products
- 11.2.23.3. SWOT Analysis
- 11.2.23.4. Recent Developments
- 11.2.23.5. Financials (Based on Availability)
- 11.2.24 Ltd
- 11.2.24.1. Overview
- 11.2.24.2. Products
- 11.2.24.3. SWOT Analysis
- 11.2.24.4. Recent Developments
- 11.2.24.5. Financials (Based on Availability)
- 11.2.25 Hazel Technologies
- 11.2.25.1. Overview
- 11.2.25.2. Products
- 11.2.25.3. SWOT Analysis
- 11.2.25.4. Recent Developments
- 11.2.25.5. Financials (Based on Availability)
- 11.2.26 Environ Care Products LLP
- 11.2.26.1. Overview
- 11.2.26.2. Products
- 11.2.26.3. SWOT Analysis
- 11.2.26.4. Recent Developments
- 11.2.26.5. Financials (Based on Availability)
- 11.2.27 Keep-It-Fresh
- 11.2.27.1. Overview
- 11.2.27.2. Products
- 11.2.27.3. SWOT Analysis
- 11.2.27.4. Recent Developments
- 11.2.27.5. Financials (Based on Availability)
- 11.2.28 Chunwang Environmental Protection Technology
- 11.2.28.1. Overview
- 11.2.28.2. Products
- 11.2.28.3. SWOT Analysis
- 11.2.28.4. Recent Developments
- 11.2.28.5. Financials (Based on Availability)
- 11.2.1 Deltatrak
List of Figures
- Figure 1: Global Ethylene Absorption Products Revenue Breakdown (undefined, %) by Region 2025 & 2033
- Figure 2: Global Ethylene Absorption Products Volume Breakdown (K, %) by Region 2025 & 2033
- Figure 3: North America Ethylene Absorption Products Revenue (undefined), by Application 2025 & 2033
- Figure 4: North America Ethylene Absorption Products Volume (K), by Application 2025 & 2033
- Figure 5: North America Ethylene Absorption Products Revenue Share (%), by Application 2025 & 2033
- Figure 6: North America Ethylene Absorption Products Volume Share (%), by Application 2025 & 2033
- Figure 7: North America Ethylene Absorption Products Revenue (undefined), by Types 2025 & 2033
- Figure 8: North America Ethylene Absorption Products Volume (K), by Types 2025 & 2033
- Figure 9: North America Ethylene Absorption Products Revenue Share (%), by Types 2025 & 2033
- Figure 10: North America Ethylene Absorption Products Volume Share (%), by Types 2025 & 2033
- Figure 11: North America Ethylene Absorption Products Revenue (undefined), by Country 2025 & 2033
- Figure 12: North America Ethylene Absorption Products Volume (K), by Country 2025 & 2033
- Figure 13: North America Ethylene Absorption Products Revenue Share (%), by Country 2025 & 2033
- Figure 14: North America Ethylene Absorption Products Volume Share (%), by Country 2025 & 2033
- Figure 15: South America Ethylene Absorption Products Revenue (undefined), by Application 2025 & 2033
- Figure 16: South America Ethylene Absorption Products Volume (K), by Application 2025 & 2033
- Figure 17: South America Ethylene Absorption Products Revenue Share (%), by Application 2025 & 2033
- Figure 18: South America Ethylene Absorption Products Volume Share (%), by Application 2025 & 2033
- Figure 19: South America Ethylene Absorption Products Revenue (undefined), by Types 2025 & 2033
- Figure 20: South America Ethylene Absorption Products Volume (K), by Types 2025 & 2033
- Figure 21: South America Ethylene Absorption Products Revenue Share (%), by Types 2025 & 2033
- Figure 22: South America Ethylene Absorption Products Volume Share (%), by Types 2025 & 2033
- Figure 23: South America Ethylene Absorption Products Revenue (undefined), by Country 2025 & 2033
- Figure 24: South America Ethylene Absorption Products Volume (K), by Country 2025 & 2033
- Figure 25: South America Ethylene Absorption Products Revenue Share (%), by Country 2025 & 2033
- Figure 26: South America Ethylene Absorption Products Volume Share (%), by Country 2025 & 2033
- Figure 27: Europe Ethylene Absorption Products Revenue (undefined), by Application 2025 & 2033
- Figure 28: Europe Ethylene Absorption Products Volume (K), by Application 2025 & 2033
- Figure 29: Europe Ethylene Absorption Products Revenue Share (%), by Application 2025 & 2033
- Figure 30: Europe Ethylene Absorption Products Volume Share (%), by Application 2025 & 2033
- Figure 31: Europe Ethylene Absorption Products Revenue (undefined), by Types 2025 & 2033
- Figure 32: Europe Ethylene Absorption Products Volume (K), by Types 2025 & 2033
- Figure 33: Europe Ethylene Absorption Products Revenue Share (%), by Types 2025 & 2033
- Figure 34: Europe Ethylene Absorption Products Volume Share (%), by Types 2025 & 2033
- Figure 35: Europe Ethylene Absorption Products Revenue (undefined), by Country 2025 & 2033
- Figure 36: Europe Ethylene Absorption Products Volume (K), by Country 2025 & 2033
- Figure 37: Europe Ethylene Absorption Products Revenue Share (%), by Country 2025 & 2033
- Figure 38: Europe Ethylene Absorption Products Volume Share (%), by Country 2025 & 2033
- Figure 39: Middle East & Africa Ethylene Absorption Products Revenue (undefined), by Application 2025 & 2033
- Figure 40: Middle East & Africa Ethylene Absorption Products Volume (K), by Application 2025 & 2033
- Figure 41: Middle East & Africa Ethylene Absorption Products Revenue Share (%), by Application 2025 & 2033
- Figure 42: Middle East & Africa Ethylene Absorption Products Volume Share (%), by Application 2025 & 2033
- Figure 43: Middle East & Africa Ethylene Absorption Products Revenue (undefined), by Types 2025 & 2033
- Figure 44: Middle East & Africa Ethylene Absorption Products Volume (K), by Types 2025 & 2033
- Figure 45: Middle East & Africa Ethylene Absorption Products Revenue Share (%), by Types 2025 & 2033
- Figure 46: Middle East & Africa Ethylene Absorption Products Volume Share (%), by Types 2025 & 2033
- Figure 47: Middle East & Africa Ethylene Absorption Products Revenue (undefined), by Country 2025 & 2033
- Figure 48: Middle East & Africa Ethylene Absorption Products Volume (K), by Country 2025 & 2033
- Figure 49: Middle East & Africa Ethylene Absorption Products Revenue Share (%), by Country 2025 & 2033
- Figure 50: Middle East & Africa Ethylene Absorption Products Volume Share (%), by Country 2025 & 2033
- Figure 51: Asia Pacific Ethylene Absorption Products Revenue (undefined), by Application 2025 & 2033
- Figure 52: Asia Pacific Ethylene Absorption Products Volume (K), by Application 2025 & 2033
- Figure 53: Asia Pacific Ethylene Absorption Products Revenue Share (%), by Application 2025 & 2033
- Figure 54: Asia Pacific Ethylene Absorption Products Volume Share (%), by Application 2025 & 2033
- Figure 55: Asia Pacific Ethylene Absorption Products Revenue (undefined), by Types 2025 & 2033
- Figure 56: Asia Pacific Ethylene Absorption Products Volume (K), by Types 2025 & 2033
- Figure 57: Asia Pacific Ethylene Absorption Products Revenue Share (%), by Types 2025 & 2033
- Figure 58: Asia Pacific Ethylene Absorption Products Volume Share (%), by Types 2025 & 2033
- Figure 59: Asia Pacific Ethylene Absorption Products Revenue (undefined), by Country 2025 & 2033
- Figure 60: Asia Pacific Ethylene Absorption Products Volume (K), by Country 2025 & 2033
- Figure 61: Asia Pacific Ethylene Absorption Products Revenue Share (%), by Country 2025 & 2033
- Figure 62: Asia Pacific Ethylene Absorption Products Volume Share (%), by Country 2025 & 2033
List of Tables
- Table 1: Global Ethylene Absorption Products Revenue undefined Forecast, by Application 2020 & 2033
- Table 2: Global Ethylene Absorption Products Volume K Forecast, by Application 2020 & 2033
- Table 3: Global Ethylene Absorption Products Revenue undefined Forecast, by Types 2020 & 2033
- Table 4: Global Ethylene Absorption Products Volume K Forecast, by Types 2020 & 2033
- Table 5: Global Ethylene Absorption Products Revenue undefined Forecast, by Region 2020 & 2033
- Table 6: Global Ethylene Absorption Products Volume K Forecast, by Region 2020 & 2033
- Table 7: Global Ethylene Absorption Products Revenue undefined Forecast, by Application 2020 & 2033
- Table 8: Global Ethylene Absorption Products Volume K Forecast, by Application 2020 & 2033
- Table 9: Global Ethylene Absorption Products Revenue undefined Forecast, by Types 2020 & 2033
- Table 10: Global Ethylene Absorption Products Volume K Forecast, by Types 2020 & 2033
- Table 11: Global Ethylene Absorption Products Revenue undefined Forecast, by Country 2020 & 2033
- Table 12: Global Ethylene Absorption Products Volume K Forecast, by Country 2020 & 2033
- Table 13: United States Ethylene Absorption Products Revenue (undefined) Forecast, by Application 2020 & 2033
- Table 14: United States Ethylene Absorption Products Volume (K) Forecast, by Application 2020 & 2033
- Table 15: Canada Ethylene Absorption Products Revenue (undefined) Forecast, by Application 2020 & 2033
- Table 16: Canada Ethylene Absorption Products Volume (K) Forecast, by Application 2020 & 2033
- Table 17: Mexico Ethylene Absorption Products Revenue (undefined) Forecast, by Application 2020 & 2033
- Table 18: Mexico Ethylene Absorption Products Volume (K) Forecast, by Application 2020 & 2033
- Table 19: Global Ethylene Absorption Products Revenue undefined Forecast, by Application 2020 & 2033
- Table 20: Global Ethylene Absorption Products Volume K Forecast, by Application 2020 & 2033
- Table 21: Global Ethylene Absorption Products Revenue undefined Forecast, by Types 2020 & 2033
- Table 22: Global Ethylene Absorption Products Volume K Forecast, by Types 2020 & 2033
- Table 23: Global Ethylene Absorption Products Revenue undefined Forecast, by Country 2020 & 2033
- Table 24: Global Ethylene Absorption Products Volume K Forecast, by Country 2020 & 2033
- Table 25: Brazil Ethylene Absorption Products Revenue (undefined) Forecast, by Application 2020 & 2033
- Table 26: Brazil Ethylene Absorption Products Volume (K) Forecast, by Application 2020 & 2033
- Table 27: Argentina Ethylene Absorption Products Revenue (undefined) Forecast, by Application 2020 & 2033
- Table 28: Argentina Ethylene Absorption Products Volume (K) Forecast, by Application 2020 & 2033
- Table 29: Rest of South America Ethylene Absorption Products Revenue (undefined) Forecast, by Application 2020 & 2033
- Table 30: Rest of South America Ethylene Absorption Products Volume (K) Forecast, by Application 2020 & 2033
- Table 31: Global Ethylene Absorption Products Revenue undefined Forecast, by Application 2020 & 2033
- Table 32: Global Ethylene Absorption Products Volume K Forecast, by Application 2020 & 2033
- Table 33: Global Ethylene Absorption Products Revenue undefined Forecast, by Types 2020 & 2033
- Table 34: Global Ethylene Absorption Products Volume K Forecast, by Types 2020 & 2033
- Table 35: Global Ethylene Absorption Products Revenue undefined Forecast, by Country 2020 & 2033
- Table 36: Global Ethylene Absorption Products Volume K Forecast, by Country 2020 & 2033
- Table 37: United Kingdom Ethylene Absorption Products Revenue (undefined) Forecast, by Application 2020 & 2033
- Table 38: United Kingdom Ethylene Absorption Products Volume (K) Forecast, by Application 2020 & 2033
- Table 39: Germany Ethylene Absorption Products Revenue (undefined) Forecast, by Application 2020 & 2033
- Table 40: Germany Ethylene Absorption Products Volume (K) Forecast, by Application 2020 & 2033
- Table 41: France Ethylene Absorption Products Revenue (undefined) Forecast, by Application 2020 & 2033
- Table 42: France Ethylene Absorption Products Volume (K) Forecast, by Application 2020 & 2033
- Table 43: Italy Ethylene Absorption Products Revenue (undefined) Forecast, by Application 2020 & 2033
- Table 44: Italy Ethylene Absorption Products Volume (K) Forecast, by Application 2020 & 2033
- Table 45: Spain Ethylene Absorption Products Revenue (undefined) Forecast, by Application 2020 & 2033
- Table 46: Spain Ethylene Absorption Products Volume (K) Forecast, by Application 2020 & 2033
- Table 47: Russia Ethylene Absorption Products Revenue (undefined) Forecast, by Application 2020 & 2033
- Table 48: Russia Ethylene Absorption Products Volume (K) Forecast, by Application 2020 & 2033
- Table 49: Benelux Ethylene Absorption Products Revenue (undefined) Forecast, by Application 2020 & 2033
- Table 50: Benelux Ethylene Absorption Products Volume (K) Forecast, by Application 2020 & 2033
- Table 51: Nordics Ethylene Absorption Products Revenue (undefined) Forecast, by Application 2020 & 2033
- Table 52: Nordics Ethylene Absorption Products Volume (K) Forecast, by Application 2020 & 2033
- Table 53: Rest of Europe Ethylene Absorption Products Revenue (undefined) Forecast, by Application 2020 & 2033
- Table 54: Rest of Europe Ethylene Absorption Products Volume (K) Forecast, by Application 2020 & 2033
- Table 55: Global Ethylene Absorption Products Revenue undefined Forecast, by Application 2020 & 2033
- Table 56: Global Ethylene Absorption Products Volume K Forecast, by Application 2020 & 2033
- Table 57: Global Ethylene Absorption Products Revenue undefined Forecast, by Types 2020 & 2033
- Table 58: Global Ethylene Absorption Products Volume K Forecast, by Types 2020 & 2033
- Table 59: Global Ethylene Absorption Products Revenue undefined Forecast, by Country 2020 & 2033
- Table 60: Global Ethylene Absorption Products Volume K Forecast, by Country 2020 & 2033
- Table 61: Turkey Ethylene Absorption Products Revenue (undefined) Forecast, by Application 2020 & 2033
- Table 62: Turkey Ethylene Absorption Products Volume (K) Forecast, by Application 2020 & 2033
- Table 63: Israel Ethylene Absorption Products Revenue (undefined) Forecast, by Application 2020 & 2033
- Table 64: Israel Ethylene Absorption Products Volume (K) Forecast, by Application 2020 & 2033
- Table 65: GCC Ethylene Absorption Products Revenue (undefined) Forecast, by Application 2020 & 2033
- Table 66: GCC Ethylene Absorption Products Volume (K) Forecast, by Application 2020 & 2033
- Table 67: North Africa Ethylene Absorption Products Revenue (undefined) Forecast, by Application 2020 & 2033
- Table 68: North Africa Ethylene Absorption Products Volume (K) Forecast, by Application 2020 & 2033
- Table 69: South Africa Ethylene Absorption Products Revenue (undefined) Forecast, by Application 2020 & 2033
- Table 70: South Africa Ethylene Absorption Products Volume (K) Forecast, by Application 2020 & 2033
- Table 71: Rest of Middle East & Africa Ethylene Absorption Products Revenue (undefined) Forecast, by Application 2020 & 2033
- Table 72: Rest of Middle East & Africa Ethylene Absorption Products Volume (K) Forecast, by Application 2020 & 2033
- Table 73: Global Ethylene Absorption Products Revenue undefined Forecast, by Application 2020 & 2033
- Table 74: Global Ethylene Absorption Products Volume K Forecast, by Application 2020 & 2033
- Table 75: Global Ethylene Absorption Products Revenue undefined Forecast, by Types 2020 & 2033
- Table 76: Global Ethylene Absorption Products Volume K Forecast, by Types 2020 & 2033
- Table 77: Global Ethylene Absorption Products Revenue undefined Forecast, by Country 2020 & 2033
- Table 78: Global Ethylene Absorption Products Volume K Forecast, by Country 2020 & 2033
- Table 79: China Ethylene Absorption Products Revenue (undefined) Forecast, by Application 2020 & 2033
- Table 80: China Ethylene Absorption Products Volume (K) Forecast, by Application 2020 & 2033
- Table 81: India Ethylene Absorption Products Revenue (undefined) Forecast, by Application 2020 & 2033
- Table 82: India Ethylene Absorption Products Volume (K) Forecast, by Application 2020 & 2033
- Table 83: Japan Ethylene Absorption Products Revenue (undefined) Forecast, by Application 2020 & 2033
- Table 84: Japan Ethylene Absorption Products Volume (K) Forecast, by Application 2020 & 2033
- Table 85: South Korea Ethylene Absorption Products Revenue (undefined) Forecast, by Application 2020 & 2033
- Table 86: South Korea Ethylene Absorption Products Volume (K) Forecast, by Application 2020 & 2033
- Table 87: ASEAN Ethylene Absorption Products Revenue (undefined) Forecast, by Application 2020 & 2033
- Table 88: ASEAN Ethylene Absorption Products Volume (K) Forecast, by Application 2020 & 2033
- Table 89: Oceania Ethylene Absorption Products Revenue (undefined) Forecast, by Application 2020 & 2033
- Table 90: Oceania Ethylene Absorption Products Volume (K) Forecast, by Application 2020 & 2033
- Table 91: Rest of Asia Pacific Ethylene Absorption Products Revenue (undefined) Forecast, by Application 2020 & 2033
- Table 92: Rest of Asia Pacific Ethylene Absorption Products Volume (K) Forecast, by Application 2020 & 2033
Frequently Asked Questions
1. What is the projected Compound Annual Growth Rate (CAGR) of the Ethylene Absorption Products?
The projected CAGR is approximately 21.89%.
2. Which companies are prominent players in the Ethylene Absorption Products?
Key companies in the market include Deltatrak, Its Fresh, Bee Chems, Prodew, TPG CO, .LTD., It's Fresh Inc, BioXTEND, Ethylene Control, Greenkeeper Iberia, Befresh Technology (Kerako Ceramic Technologies), Sensitech, Secco International Group, Isolcell S.p.A., OhE Chemicals, Purafil, Desiccare, Molina de Segura, KeepFresh Technologies, Praxas, Bioconservacion, S.A., Lipmen CO., Ltd, Hazel Technologies, Environ Care Products LLP, Keep-It-Fresh, Chunwang Environmental Protection Technology.
3. What are the main segments of the Ethylene Absorption Products?
The market segments include Application, Types.
4. Can you provide details about the market size?
The market size is estimated to be USD XXX N/A as of 2022.
5. What are some drivers contributing to market growth?
N/A
6. What are the notable trends driving market growth?
N/A
7. Are there any restraints impacting market growth?
N/A
8. Can you provide examples of recent developments in the market?
N/A
9. What pricing options are available for accessing the report?
Pricing options include single-user, multi-user, and enterprise licenses priced at USD 3950.00, USD 5925.00, and USD 7900.00 respectively.
10. Is the market size provided in terms of value or volume?
The market size is provided in terms of value, measured in N/A and volume, measured in K.
11. Are there any specific market keywords associated with the report?
Yes, the market keyword associated with the report is "Ethylene Absorption Products," which aids in identifying and referencing the specific market segment covered.
12. How do I determine which pricing option suits my needs best?
The pricing options vary based on user requirements and access needs. Individual users may opt for single-user licenses, while businesses requiring broader access may choose multi-user or enterprise licenses for cost-effective access to the report.
13. Are there any additional resources or data provided in the Ethylene Absorption Products report?
While the report offers comprehensive insights, it's advisable to review the specific contents or supplementary materials provided to ascertain if additional resources or data are available.
14. How can I stay updated on further developments or reports in the Ethylene Absorption Products?
To stay informed about further developments, trends, and reports in the Ethylene Absorption Products, consider subscribing to industry newsletters, following relevant companies and organizations, or regularly checking reputable industry news sources and publications.
Methodology
Step 1 - Identification of Relevant Samples Size from Population Database


Step 2 - Approaches for Defining Global Market Size (Value, Volume* & Price*)

Note*: In applicable scenarios
Step 3 - Data Sources
Primary Research
- Web Analytics
- Survey Reports
- Research Institute
- Latest Research Reports
- Opinion Leaders
Secondary Research
- Annual Reports
- White Paper
- Latest Press Release
- Industry Association
- Paid Database
- Investor Presentations

Step 4 - Data Triangulation
Involves using different sources of information in order to increase the validity of a study
These sources are likely to be stakeholders in a program - participants, other researchers, program staff, other community members, and so on.
Then we put all data in single framework & apply various statistical tools to find out the dynamic on the market.
During the analysis stage, feedback from the stakeholder groups would be compared to determine areas of agreement as well as areas of divergence