

Key Insights
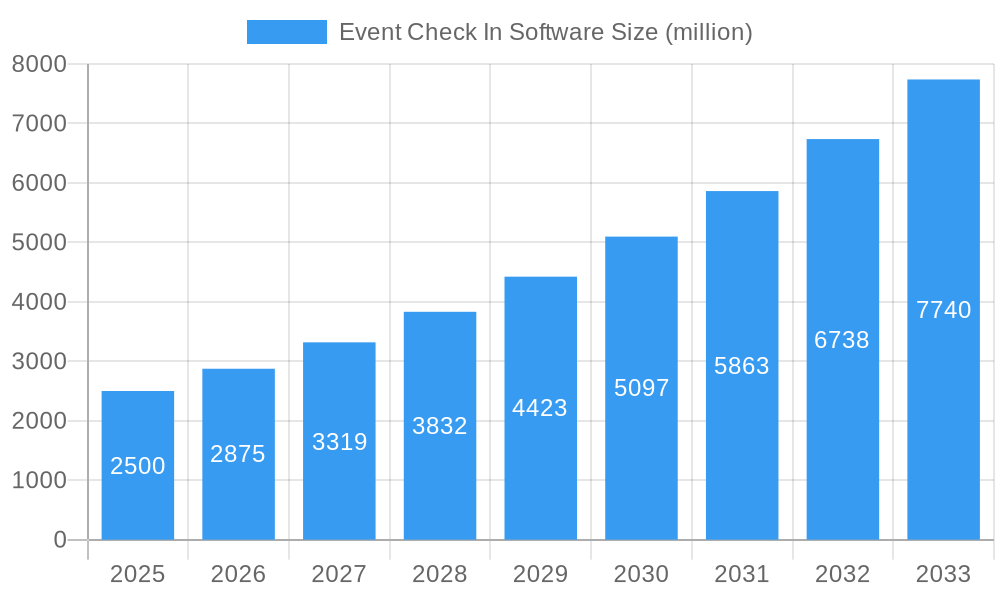
The global event check-in software market is experiencing robust growth, driven by the increasing popularity of hybrid and virtual events, a surge in demand for streamlined event management, and the need for enhanced attendee experience. The market's transition from traditional manual check-in processes to automated, digital solutions is significantly impacting its expansion. Factors like improved data analytics capabilities, reduced operational costs, and enhanced security features offered by these software solutions are attracting a broad range of event organizers, from small businesses to large corporations. We estimate the market size in 2025 to be approximately $2.5 billion, with a Compound Annual Growth Rate (CAGR) of 15% projected through 2033. This growth is fueled by continuous technological advancements, such as integration with mobile ticketing, real-time data analysis, and customizable branding options within the software.
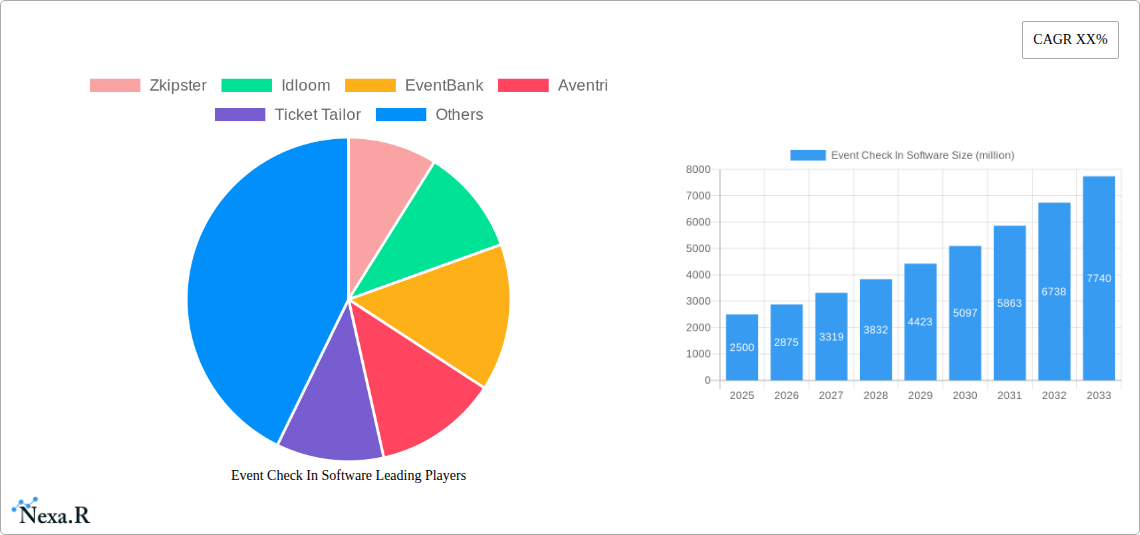
Event Check In Software Market Size (In Billion)
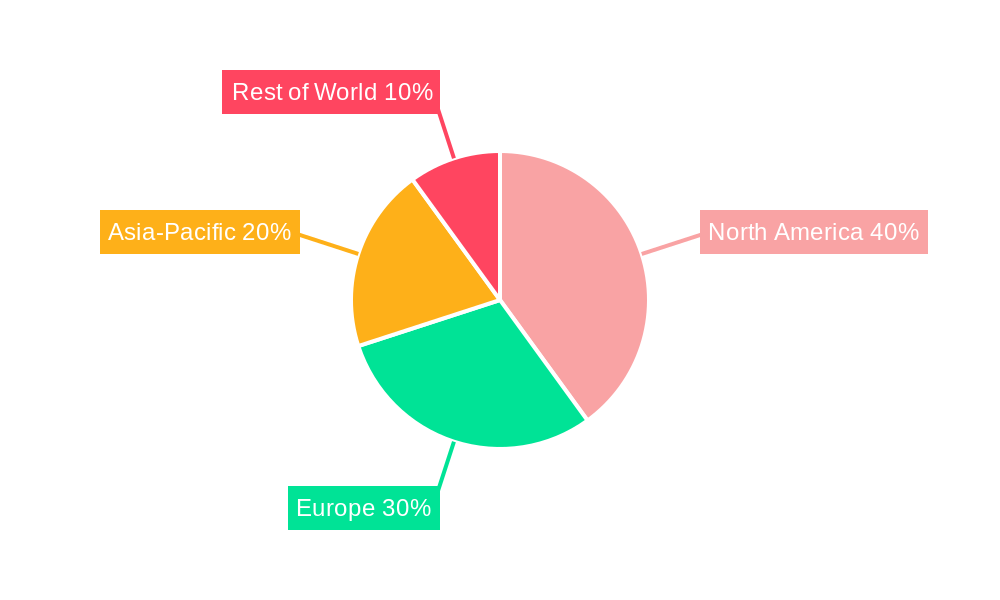
Key restraining factors include the initial investment cost for implementing new software, the need for ongoing technical support and training, and concerns about data security and privacy. However, the long-term benefits, including increased efficiency, improved attendee satisfaction, and better ROI, are outweighing these concerns. The market is segmented by deployment type (cloud-based, on-premises), event type (corporate events, conferences, concerts), and organization size (small, medium, large enterprises). Leading companies like Cvent, Bizzabo, and Aventri are consolidating their market share through strategic acquisitions and product innovation. The regional distribution of the market is expected to be dominated by North America and Europe initially, but regions like Asia-Pacific are poised for significant growth in the coming years due to increasing adoption of technology in the events industry.
Event Check In Software Company Market Share
Event Check In Software Market Report: 2019-2033
This comprehensive report provides a deep dive into the Event Check-In Software market, analyzing its dynamics, growth trends, key players, and future outlook. The study covers the period 2019-2033, with a focus on the base year 2025 and a forecast period of 2025-2033. The report is designed for industry professionals, investors, and anyone seeking a thorough understanding of this rapidly evolving market segment within the broader event management software industry. The market is expected to reach xx million by 2033, with a CAGR of xx% during the forecast period.
Event Check In Software Market Dynamics & Structure
The event check-in software market is characterized by moderate concentration, with a few dominant players and numerous smaller niche providers. Technological innovation, driven by cloud computing, mobile integration, and AI-powered features, is a key driver. Regulatory frameworks concerning data privacy (GDPR, CCPA) significantly influence market practices. Competitive substitutes include manual check-in processes and basic registration systems. The end-user demographic spans event organizers of all sizes, from small businesses to large corporations, encompassing various event types (conferences, trade shows, concerts etc.). M&A activity has been moderate, with approximately xx deals recorded in the historical period (2019-2024), primarily focused on consolidating smaller players.
- Market Concentration: Moderately concentrated, with the top 5 players holding approximately xx% market share in 2025.
- Technological Innovation: Focus on seamless integration with other event management tools, improved user experience, and advanced analytics.
- Regulatory Landscape: Compliance with data privacy regulations is paramount.
- Competitive Substitutes: Manual check-in and simpler registration systems pose a competitive threat, particularly for smaller events.
- M&A Activity: Consolidation is expected to continue, driven by the need for scale and expanded functionality.
Event Check In Software Growth Trends & Insights
The event check-in software market experienced significant growth during the historical period (2019-2024), driven by the increasing adoption of digital technologies in event management. The market size reached xx million in 2024 and is projected to grow to xx million in 2025. The rising adoption of mobile-first strategies and the need for efficient attendee management are key factors. Technological disruptions, such as the shift to cloud-based solutions and the integration of AI-powered features, are accelerating market growth. Changes in consumer behavior, including a preference for contactless and streamlined check-in processes, further fuel adoption.
- Market Size: xx million in 2024, projected to reach xx million in 2025.
- CAGR (2019-2024): xx%
- Market Penetration: xx% in 2024.
- Technological Disruptions: Cloud-based solutions, mobile apps, and AI-powered features are driving adoption.
- Consumer Behavior Shifts: Demand for seamless, contactless, and personalized check-in experiences.
Dominant Regions, Countries, or Segments in Event Check In Software
North America currently holds the largest market share, driven by high event management spending, advanced technological adoption, and a large number of corporate events. Europe follows closely, with significant growth potential in emerging markets. The segment of large-scale events (conferences and trade shows) contributes the most to market revenue.
- North America: Strong market presence due to high adoption rates and advanced technology infrastructure.
- Europe: Significant growth potential driven by rising adoption of technology in event management.
- Asia-Pacific: A rapidly growing market, with increasing demand for efficient event management solutions.
- Key Drivers: Increased event frequency, technological advancements, growing adoption of cloud-based systems, and the demand for enhanced attendee experience.
Event Check In Software Product Landscape
Event check-in software offerings range from basic registration and check-in features to sophisticated solutions integrating attendee management, data analytics, and marketing automation tools. Recent innovations include biometric authentication, AI-powered attendee engagement features, and seamless integration with event management platforms. The market is witnessing the rise of mobile-first solutions that offer intuitive user experiences and offline capabilities. Key selling points often include features like real-time data visualization, personalized communication capabilities, and streamlined reporting functions.
Key Drivers, Barriers & Challenges in Event Check In Software
Key Drivers:
- Increasing adoption of digital technologies across the event management industry.
- Growing demand for enhanced attendee experiences, including seamless check-in processes.
- The need for efficient data management and analytics.
Key Challenges:
- Data security and privacy concerns, particularly with the handling of sensitive attendee information.
- The need for continuous software updates and maintenance to remain competitive.
- Integration challenges with other event management systems and tools. This impacts 10% of the smaller companies.
Emerging Opportunities in Event Check In Software
- Expansion into untapped markets, such as developing economies, with high potential for event management software adoption.
- Integration with emerging technologies, such as virtual reality (VR) and augmented reality (AR), to create immersive attendee experiences.
- Development of specialized solutions tailored to specific event types, such as conferences, festivals, or trade shows.
Growth Accelerators in the Event Check In Software Industry
Strategic partnerships between event check-in software providers and other event management technology companies are expected to accelerate growth. Further technological breakthroughs, particularly in areas like AI and automation, offer significant opportunities for enhancing software capabilities and user experience. Market expansion efforts, focusing on emerging economies with high potential for growth, could fuel expansion.
Notable Milestones in Event Check In Software Sector
- 2020, Q3: Increased adoption of contactless check-in solutions due to the COVID-19 pandemic.
- 2021, Q1: Launch of several AI-powered features by major players, enhancing attendee engagement.
- 2022, Q4: Significant M&A activity, consolidating market share among key players.
- 2023, Q2: The release of several new cloud based solutions that support offline features.
In-Depth Event Check In Software Market Outlook
The event check-in software market is poised for significant growth in the coming years, driven by continued technological advancements, increasing adoption rates, and expansion into new markets. The focus on enhanced user experience, seamless integration with other event management tools, and data-driven insights will further accelerate market expansion. Strategic partnerships and acquisitions will continue to shape the competitive landscape. The market presents compelling opportunities for both established players and new entrants seeking to capitalize on the growing demand for efficient and innovative event management solutions.
Event Check In Software Segmentation
-
1. Application
- 1.1. Educational Services
- 1.2. Travel Agencies
- 1.3. Activity Planning Company
- 1.4. Other
-
2. Types
- 2.1. Basic($60-145/Month)
- 2.2. Standard($145-699/Month)
- 2.3. Senior($699-1649/Month)
Event Check In Software Segmentation By Geography
-
1. North America
- 1.1. United States
- 1.2. Canada
- 1.3. Mexico
-
2. South America
- 2.1. Brazil
- 2.2. Argentina
- 2.3. Rest of South America
-
3. Europe
- 3.1. United Kingdom
- 3.2. Germany
- 3.3. France
- 3.4. Italy
- 3.5. Spain
- 3.6. Russia
- 3.7. Benelux
- 3.8. Nordics
- 3.9. Rest of Europe
-
4. Middle East & Africa
- 4.1. Turkey
- 4.2. Israel
- 4.3. GCC
- 4.4. North Africa
- 4.5. South Africa
- 4.6. Rest of Middle East & Africa
-
5. Asia Pacific
- 5.1. China
- 5.2. India
- 5.3. Japan
- 5.4. South Korea
- 5.5. ASEAN
- 5.6. Oceania
- 5.7. Rest of Asia Pacific
Event Check In Software Regional Market Share
Geographic Coverage of Event Check In Software
Event Check In Software REPORT HIGHLIGHTS
| Aspects | Details |
|---|---|
| Study Period | 2020-2034 |
| Base Year | 2025 |
| Estimated Year | 2026 |
| Forecast Period | 2026-2034 |
| Historical Period | 2020-2025 |
| Growth Rate | CAGR of 10.27% from 2020-2034 |
| Segmentation |
|
Table of Contents
- 1. Introduction
- 1.1. Research Scope
- 1.2. Market Segmentation
- 1.3. Research Methodology
- 1.4. Definitions and Assumptions
- 2. Executive Summary
- 2.1. Introduction
- 3. Market Dynamics
- 3.1. Introduction
- 3.2. Market Drivers
- 3.3. Market Restrains
- 3.4. Market Trends
- 4. Market Factor Analysis
- 4.1. Porters Five Forces
- 4.2. Supply/Value Chain
- 4.3. PESTEL analysis
- 4.4. Market Entropy
- 4.5. Patent/Trademark Analysis
- 5. Global Event Check In Software Analysis, Insights and Forecast, 2020-2032
- 5.1. Market Analysis, Insights and Forecast - by Application
- 5.1.1. Educational Services
- 5.1.2. Travel Agencies
- 5.1.3. Activity Planning Company
- 5.1.4. Other
- 5.2. Market Analysis, Insights and Forecast - by Types
- 5.2.1. Basic($60-145/Month)
- 5.2.2. Standard($145-699/Month)
- 5.2.3. Senior($699-1649/Month)
- 5.3. Market Analysis, Insights and Forecast - by Region
- 5.3.1. North America
- 5.3.2. South America
- 5.3.3. Europe
- 5.3.4. Middle East & Africa
- 5.3.5. Asia Pacific
- 5.1. Market Analysis, Insights and Forecast - by Application
- 6. North America Event Check In Software Analysis, Insights and Forecast, 2020-2032
- 6.1. Market Analysis, Insights and Forecast - by Application
- 6.1.1. Educational Services
- 6.1.2. Travel Agencies
- 6.1.3. Activity Planning Company
- 6.1.4. Other
- 6.2. Market Analysis, Insights and Forecast - by Types
- 6.2.1. Basic($60-145/Month)
- 6.2.2. Standard($145-699/Month)
- 6.2.3. Senior($699-1649/Month)
- 6.1. Market Analysis, Insights and Forecast - by Application
- 7. South America Event Check In Software Analysis, Insights and Forecast, 2020-2032
- 7.1. Market Analysis, Insights and Forecast - by Application
- 7.1.1. Educational Services
- 7.1.2. Travel Agencies
- 7.1.3. Activity Planning Company
- 7.1.4. Other
- 7.2. Market Analysis, Insights and Forecast - by Types
- 7.2.1. Basic($60-145/Month)
- 7.2.2. Standard($145-699/Month)
- 7.2.3. Senior($699-1649/Month)
- 7.1. Market Analysis, Insights and Forecast - by Application
- 8. Europe Event Check In Software Analysis, Insights and Forecast, 2020-2032
- 8.1. Market Analysis, Insights and Forecast - by Application
- 8.1.1. Educational Services
- 8.1.2. Travel Agencies
- 8.1.3. Activity Planning Company
- 8.1.4. Other
- 8.2. Market Analysis, Insights and Forecast - by Types
- 8.2.1. Basic($60-145/Month)
- 8.2.2. Standard($145-699/Month)
- 8.2.3. Senior($699-1649/Month)
- 8.1. Market Analysis, Insights and Forecast - by Application
- 9. Middle East & Africa Event Check In Software Analysis, Insights and Forecast, 2020-2032
- 9.1. Market Analysis, Insights and Forecast - by Application
- 9.1.1. Educational Services
- 9.1.2. Travel Agencies
- 9.1.3. Activity Planning Company
- 9.1.4. Other
- 9.2. Market Analysis, Insights and Forecast - by Types
- 9.2.1. Basic($60-145/Month)
- 9.2.2. Standard($145-699/Month)
- 9.2.3. Senior($699-1649/Month)
- 9.1. Market Analysis, Insights and Forecast - by Application
- 10. Asia Pacific Event Check In Software Analysis, Insights and Forecast, 2020-2032
- 10.1. Market Analysis, Insights and Forecast - by Application
- 10.1.1. Educational Services
- 10.1.2. Travel Agencies
- 10.1.3. Activity Planning Company
- 10.1.4. Other
- 10.2. Market Analysis, Insights and Forecast - by Types
- 10.2.1. Basic($60-145/Month)
- 10.2.2. Standard($145-699/Month)
- 10.2.3. Senior($699-1649/Month)
- 10.1. Market Analysis, Insights and Forecast - by Application
- 11. Competitive Analysis
- 11.1. Global Market Share Analysis 2025
- 11.2. Company Profiles
- 11.2.1 Zkipster
- 11.2.1.1. Overview
- 11.2.1.2. Products
- 11.2.1.3. SWOT Analysis
- 11.2.1.4. Recent Developments
- 11.2.1.5. Financials (Based on Availability)
- 11.2.2 Idloom
- 11.2.2.1. Overview
- 11.2.2.2. Products
- 11.2.2.3. SWOT Analysis
- 11.2.2.4. Recent Developments
- 11.2.2.5. Financials (Based on Availability)
- 11.2.3 EventBank
- 11.2.3.1. Overview
- 11.2.3.2. Products
- 11.2.3.3. SWOT Analysis
- 11.2.3.4. Recent Developments
- 11.2.3.5. Financials (Based on Availability)
- 11.2.4 Aventri
- 11.2.4.1. Overview
- 11.2.4.2. Products
- 11.2.4.3. SWOT Analysis
- 11.2.4.4. Recent Developments
- 11.2.4.5. Financials (Based on Availability)
- 11.2.5 Ticket Tailor
- 11.2.5.1. Overview
- 11.2.5.2. Products
- 11.2.5.3. SWOT Analysis
- 11.2.5.4. Recent Developments
- 11.2.5.5. Financials (Based on Availability)
- 11.2.6 Thunder Data Systems
- 11.2.6.1. Overview
- 11.2.6.2. Products
- 11.2.6.3. SWOT Analysis
- 11.2.6.4. Recent Developments
- 11.2.6.5. Financials (Based on Availability)
- 11.2.7 Picatic
- 11.2.7.1. Overview
- 11.2.7.2. Products
- 11.2.7.3. SWOT Analysis
- 11.2.7.4. Recent Developments
- 11.2.7.5. Financials (Based on Availability)
- 11.2.8 Purplepass
- 11.2.8.1. Overview
- 11.2.8.2. Products
- 11.2.8.3. SWOT Analysis
- 11.2.8.4. Recent Developments
- 11.2.8.5. Financials (Based on Availability)
- 11.2.9 VolunteerLocal
- 11.2.9.1. Overview
- 11.2.9.2. Products
- 11.2.9.3. SWOT Analysis
- 11.2.9.4. Recent Developments
- 11.2.9.5. Financials (Based on Availability)
- 11.2.10 Accelevents
- 11.2.10.1. Overview
- 11.2.10.2. Products
- 11.2.10.3. SWOT Analysis
- 11.2.10.4. Recent Developments
- 11.2.10.5. Financials (Based on Availability)
- 11.2.11 Sparxo
- 11.2.11.1. Overview
- 11.2.11.2. Products
- 11.2.11.3. SWOT Analysis
- 11.2.11.4. Recent Developments
- 11.2.11.5. Financials (Based on Availability)
- 11.2.12 Bizzabo
- 11.2.12.1. Overview
- 11.2.12.2. Products
- 11.2.12.3. SWOT Analysis
- 11.2.12.4. Recent Developments
- 11.2.12.5. Financials (Based on Availability)
- 11.2.13 Boomset
- 11.2.13.1. Overview
- 11.2.13.2. Products
- 11.2.13.3. SWOT Analysis
- 11.2.13.4. Recent Developments
- 11.2.13.5. Financials (Based on Availability)
- 11.2.14 Showpass
- 11.2.14.1. Overview
- 11.2.14.2. Products
- 11.2.14.3. SWOT Analysis
- 11.2.14.4. Recent Developments
- 11.2.14.5. Financials (Based on Availability)
- 11.2.15 Eventtia
- 11.2.15.1. Overview
- 11.2.15.2. Products
- 11.2.15.3. SWOT Analysis
- 11.2.15.4. Recent Developments
- 11.2.15.5. Financials (Based on Availability)
- 11.2.16 Cvent
- 11.2.16.1. Overview
- 11.2.16.2. Products
- 11.2.16.3. SWOT Analysis
- 11.2.16.4. Recent Developments
- 11.2.16.5. Financials (Based on Availability)
- 11.2.17 Evenium
- 11.2.17.1. Overview
- 11.2.17.2. Products
- 11.2.17.3. SWOT Analysis
- 11.2.17.4. Recent Developments
- 11.2.17.5. Financials (Based on Availability)
- 11.2.18 Social Tables
- 11.2.18.1. Overview
- 11.2.18.2. Products
- 11.2.18.3. SWOT Analysis
- 11.2.18.4. Recent Developments
- 11.2.18.5. Financials (Based on Availability)
- 11.2.19 Eventfuel
- 11.2.19.1. Overview
- 11.2.19.2. Products
- 11.2.19.3. SWOT Analysis
- 11.2.19.4. Recent Developments
- 11.2.19.5. Financials (Based on Availability)
- 11.2.20 EventsCase
- 11.2.20.1. Overview
- 11.2.20.2. Products
- 11.2.20.3. SWOT Analysis
- 11.2.20.4. Recent Developments
- 11.2.20.5. Financials (Based on Availability)
- 11.2.21 SevenRooms
- 11.2.21.1. Overview
- 11.2.21.2. Products
- 11.2.21.3. SWOT Analysis
- 11.2.21.4. Recent Developments
- 11.2.21.5. Financials (Based on Availability)
- 11.2.22 MeetApp
- 11.2.22.1. Overview
- 11.2.22.2. Products
- 11.2.22.3. SWOT Analysis
- 11.2.22.4. Recent Developments
- 11.2.22.5. Financials (Based on Availability)
- 11.2.23 Azavista
- 11.2.23.1. Overview
- 11.2.23.2. Products
- 11.2.23.3. SWOT Analysis
- 11.2.23.4. Recent Developments
- 11.2.23.5. Financials (Based on Availability)
- 11.2.24 SpinGo
- 11.2.24.1. Overview
- 11.2.24.2. Products
- 11.2.24.3. SWOT Analysis
- 11.2.24.4. Recent Developments
- 11.2.24.5. Financials (Based on Availability)
- 11.2.1 Zkipster
List of Figures
- Figure 1: Global Event Check In Software Revenue Breakdown (undefined, %) by Region 2025 & 2033
- Figure 2: North America Event Check In Software Revenue (undefined), by Application 2025 & 2033
- Figure 3: North America Event Check In Software Revenue Share (%), by Application 2025 & 2033
- Figure 4: North America Event Check In Software Revenue (undefined), by Types 2025 & 2033
- Figure 5: North America Event Check In Software Revenue Share (%), by Types 2025 & 2033
- Figure 6: North America Event Check In Software Revenue (undefined), by Country 2025 & 2033
- Figure 7: North America Event Check In Software Revenue Share (%), by Country 2025 & 2033
- Figure 8: South America Event Check In Software Revenue (undefined), by Application 2025 & 2033
- Figure 9: South America Event Check In Software Revenue Share (%), by Application 2025 & 2033
- Figure 10: South America Event Check In Software Revenue (undefined), by Types 2025 & 2033
- Figure 11: South America Event Check In Software Revenue Share (%), by Types 2025 & 2033
- Figure 12: South America Event Check In Software Revenue (undefined), by Country 2025 & 2033
- Figure 13: South America Event Check In Software Revenue Share (%), by Country 2025 & 2033
- Figure 14: Europe Event Check In Software Revenue (undefined), by Application 2025 & 2033
- Figure 15: Europe Event Check In Software Revenue Share (%), by Application 2025 & 2033
- Figure 16: Europe Event Check In Software Revenue (undefined), by Types 2025 & 2033
- Figure 17: Europe Event Check In Software Revenue Share (%), by Types 2025 & 2033
- Figure 18: Europe Event Check In Software Revenue (undefined), by Country 2025 & 2033
- Figure 19: Europe Event Check In Software Revenue Share (%), by Country 2025 & 2033
- Figure 20: Middle East & Africa Event Check In Software Revenue (undefined), by Application 2025 & 2033
- Figure 21: Middle East & Africa Event Check In Software Revenue Share (%), by Application 2025 & 2033
- Figure 22: Middle East & Africa Event Check In Software Revenue (undefined), by Types 2025 & 2033
- Figure 23: Middle East & Africa Event Check In Software Revenue Share (%), by Types 2025 & 2033
- Figure 24: Middle East & Africa Event Check In Software Revenue (undefined), by Country 2025 & 2033
- Figure 25: Middle East & Africa Event Check In Software Revenue Share (%), by Country 2025 & 2033
- Figure 26: Asia Pacific Event Check In Software Revenue (undefined), by Application 2025 & 2033
- Figure 27: Asia Pacific Event Check In Software Revenue Share (%), by Application 2025 & 2033
- Figure 28: Asia Pacific Event Check In Software Revenue (undefined), by Types 2025 & 2033
- Figure 29: Asia Pacific Event Check In Software Revenue Share (%), by Types 2025 & 2033
- Figure 30: Asia Pacific Event Check In Software Revenue (undefined), by Country 2025 & 2033
- Figure 31: Asia Pacific Event Check In Software Revenue Share (%), by Country 2025 & 2033
List of Tables
- Table 1: Global Event Check In Software Revenue undefined Forecast, by Application 2020 & 2033
- Table 2: Global Event Check In Software Revenue undefined Forecast, by Types 2020 & 2033
- Table 3: Global Event Check In Software Revenue undefined Forecast, by Region 2020 & 2033
- Table 4: Global Event Check In Software Revenue undefined Forecast, by Application 2020 & 2033
- Table 5: Global Event Check In Software Revenue undefined Forecast, by Types 2020 & 2033
- Table 6: Global Event Check In Software Revenue undefined Forecast, by Country 2020 & 2033
- Table 7: United States Event Check In Software Revenue (undefined) Forecast, by Application 2020 & 2033
- Table 8: Canada Event Check In Software Revenue (undefined) Forecast, by Application 2020 & 2033
- Table 9: Mexico Event Check In Software Revenue (undefined) Forecast, by Application 2020 & 2033
- Table 10: Global Event Check In Software Revenue undefined Forecast, by Application 2020 & 2033
- Table 11: Global Event Check In Software Revenue undefined Forecast, by Types 2020 & 2033
- Table 12: Global Event Check In Software Revenue undefined Forecast, by Country 2020 & 2033
- Table 13: Brazil Event Check In Software Revenue (undefined) Forecast, by Application 2020 & 2033
- Table 14: Argentina Event Check In Software Revenue (undefined) Forecast, by Application 2020 & 2033
- Table 15: Rest of South America Event Check In Software Revenue (undefined) Forecast, by Application 2020 & 2033
- Table 16: Global Event Check In Software Revenue undefined Forecast, by Application 2020 & 2033
- Table 17: Global Event Check In Software Revenue undefined Forecast, by Types 2020 & 2033
- Table 18: Global Event Check In Software Revenue undefined Forecast, by Country 2020 & 2033
- Table 19: United Kingdom Event Check In Software Revenue (undefined) Forecast, by Application 2020 & 2033
- Table 20: Germany Event Check In Software Revenue (undefined) Forecast, by Application 2020 & 2033
- Table 21: France Event Check In Software Revenue (undefined) Forecast, by Application 2020 & 2033
- Table 22: Italy Event Check In Software Revenue (undefined) Forecast, by Application 2020 & 2033
- Table 23: Spain Event Check In Software Revenue (undefined) Forecast, by Application 2020 & 2033
- Table 24: Russia Event Check In Software Revenue (undefined) Forecast, by Application 2020 & 2033
- Table 25: Benelux Event Check In Software Revenue (undefined) Forecast, by Application 2020 & 2033
- Table 26: Nordics Event Check In Software Revenue (undefined) Forecast, by Application 2020 & 2033
- Table 27: Rest of Europe Event Check In Software Revenue (undefined) Forecast, by Application 2020 & 2033
- Table 28: Global Event Check In Software Revenue undefined Forecast, by Application 2020 & 2033
- Table 29: Global Event Check In Software Revenue undefined Forecast, by Types 2020 & 2033
- Table 30: Global Event Check In Software Revenue undefined Forecast, by Country 2020 & 2033
- Table 31: Turkey Event Check In Software Revenue (undefined) Forecast, by Application 2020 & 2033
- Table 32: Israel Event Check In Software Revenue (undefined) Forecast, by Application 2020 & 2033
- Table 33: GCC Event Check In Software Revenue (undefined) Forecast, by Application 2020 & 2033
- Table 34: North Africa Event Check In Software Revenue (undefined) Forecast, by Application 2020 & 2033
- Table 35: South Africa Event Check In Software Revenue (undefined) Forecast, by Application 2020 & 2033
- Table 36: Rest of Middle East & Africa Event Check In Software Revenue (undefined) Forecast, by Application 2020 & 2033
- Table 37: Global Event Check In Software Revenue undefined Forecast, by Application 2020 & 2033
- Table 38: Global Event Check In Software Revenue undefined Forecast, by Types 2020 & 2033
- Table 39: Global Event Check In Software Revenue undefined Forecast, by Country 2020 & 2033
- Table 40: China Event Check In Software Revenue (undefined) Forecast, by Application 2020 & 2033
- Table 41: India Event Check In Software Revenue (undefined) Forecast, by Application 2020 & 2033
- Table 42: Japan Event Check In Software Revenue (undefined) Forecast, by Application 2020 & 2033
- Table 43: South Korea Event Check In Software Revenue (undefined) Forecast, by Application 2020 & 2033
- Table 44: ASEAN Event Check In Software Revenue (undefined) Forecast, by Application 2020 & 2033
- Table 45: Oceania Event Check In Software Revenue (undefined) Forecast, by Application 2020 & 2033
- Table 46: Rest of Asia Pacific Event Check In Software Revenue (undefined) Forecast, by Application 2020 & 2033
Frequently Asked Questions
1. What is the projected Compound Annual Growth Rate (CAGR) of the Event Check In Software?
The projected CAGR is approximately 10.27%.
2. Which companies are prominent players in the Event Check In Software?
Key companies in the market include Zkipster, Idloom, EventBank, Aventri, Ticket Tailor, Thunder Data Systems, Picatic, Purplepass, VolunteerLocal, Accelevents, Sparxo, Bizzabo, Boomset, Showpass, Eventtia, Cvent, Evenium, Social Tables, Eventfuel, EventsCase, SevenRooms, MeetApp, Azavista, SpinGo.
3. What are the main segments of the Event Check In Software?
The market segments include Application, Types.
4. Can you provide details about the market size?
The market size is estimated to be USD XXX N/A as of 2022.
5. What are some drivers contributing to market growth?
N/A
6. What are the notable trends driving market growth?
N/A
7. Are there any restraints impacting market growth?
N/A
8. Can you provide examples of recent developments in the market?
N/A
9. What pricing options are available for accessing the report?
Pricing options include single-user, multi-user, and enterprise licenses priced at USD 2900.00, USD 4350.00, and USD 5800.00 respectively.
10. Is the market size provided in terms of value or volume?
The market size is provided in terms of value, measured in N/A.
11. Are there any specific market keywords associated with the report?
Yes, the market keyword associated with the report is "Event Check In Software," which aids in identifying and referencing the specific market segment covered.
12. How do I determine which pricing option suits my needs best?
The pricing options vary based on user requirements and access needs. Individual users may opt for single-user licenses, while businesses requiring broader access may choose multi-user or enterprise licenses for cost-effective access to the report.
13. Are there any additional resources or data provided in the Event Check In Software report?
While the report offers comprehensive insights, it's advisable to review the specific contents or supplementary materials provided to ascertain if additional resources or data are available.
14. How can I stay updated on further developments or reports in the Event Check In Software?
To stay informed about further developments, trends, and reports in the Event Check In Software, consider subscribing to industry newsletters, following relevant companies and organizations, or regularly checking reputable industry news sources and publications.
Methodology
Step 1 - Identification of Relevant Samples Size from Population Database


Step 2 - Approaches for Defining Global Market Size (Value, Volume* & Price*)

Note*: In applicable scenarios
Step 3 - Data Sources
Primary Research
- Web Analytics
- Survey Reports
- Research Institute
- Latest Research Reports
- Opinion Leaders
Secondary Research
- Annual Reports
- White Paper
- Latest Press Release
- Industry Association
- Paid Database
- Investor Presentations

Step 4 - Data Triangulation
Involves using different sources of information in order to increase the validity of a study
These sources are likely to be stakeholders in a program - participants, other researchers, program staff, other community members, and so on.
Then we put all data in single framework & apply various statistical tools to find out the dynamic on the market.
During the analysis stage, feedback from the stakeholder groups would be compared to determine areas of agreement as well as areas of divergence