

Key Insights
The global fiber optic cleaning swab market is projected for substantial expansion, driven by escalating demand for high-bandwidth communication and the continuous build-out of fiber optic network infrastructure. The market is expected to grow at a Compound Annual Growth Rate (CAGR) of 4.1%, reaching an estimated market size of 863.5 million by 2025. Key growth catalysts include the rapid deployment of 5G networks, the burgeoning adoption of cloud computing, and the increasing utilization of fiber optics in data centers and enterprise environments. Innovations in cleaning swab technology, focusing on enhanced efficiency and contamination prevention, further bolster market prospects. While challenges such as the cost of specialized cleaning tools and the requirement for skilled technicians exist, the market outlook remains overwhelmingly positive. Leading companies like US Conec, Thorlabs, and Chemtronics are actively pursuing innovation and strategic alliances to secure market dominance. The market is segmented by swab type (dry, wet, pre-saturated), application (telecom, data centers), and end-user (service providers, enterprises).
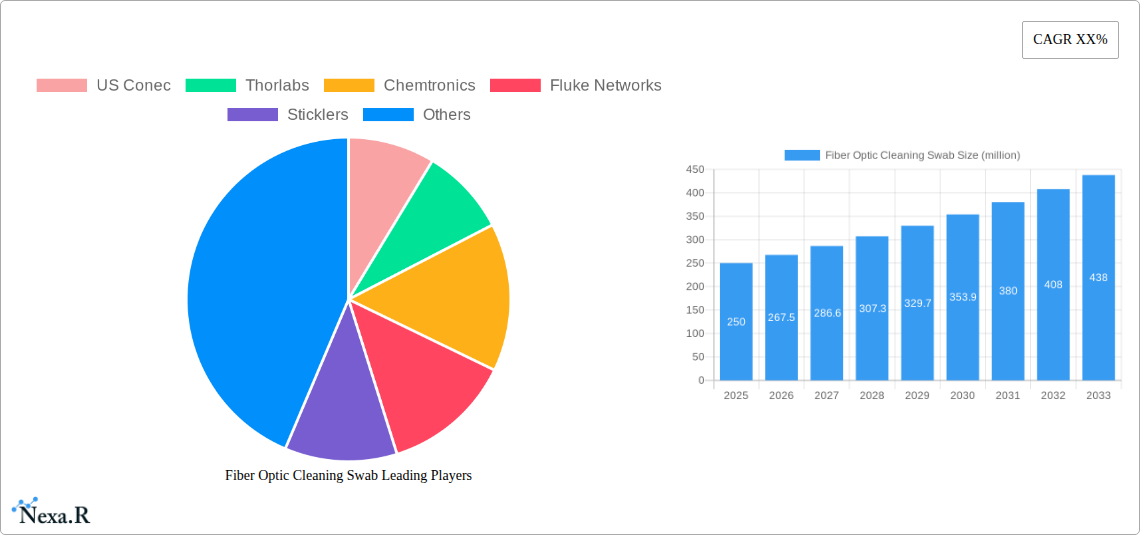
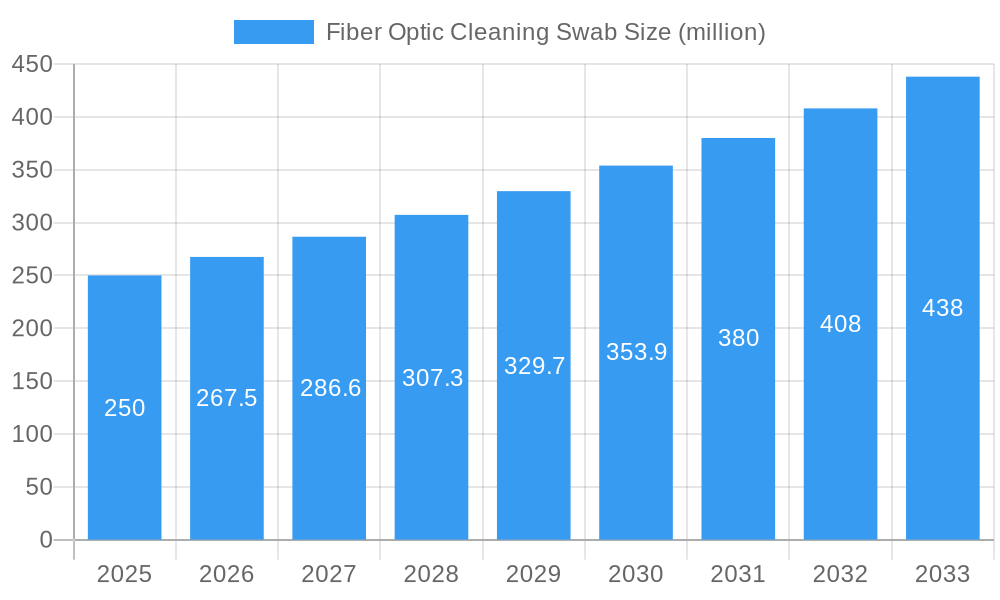
Fiber Optic Cleaning Swab Market Size (In Million)
Geographically, the fiber optic cleaning swab market reflects global fiber optic infrastructure development. North America and Europe currently lead due to their mature telecommunication networks and widespread fiber technology adoption. However, the Asia-Pacific region is poised for the most rapid expansion, fueled by significant investments in telecommunications and data center development in emerging economies. This regional dynamic underscores the need for targeted market strategies and presents opportunities for new entrants. Continued growth in data traffic and the persistent demand for dependable high-speed internet connectivity will ensure the fiber optic cleaning swab market's enduring strength and sustained demand for superior cleaning solutions.
Fiber Optic Cleaning Swab Company Market Share
Fiber Optic Cleaning Swab Market Report: 2019-2033
This comprehensive report provides a detailed analysis of the global fiber optic cleaning swab market, offering invaluable insights for industry professionals, investors, and strategic decision-makers. The study covers the period 2019-2033, with a focus on the forecast period 2025-2033, using 2025 as the base year. The report segments the market by various key factors and includes analyses of leading companies, such as US Conec, Thorlabs, Chemtronics, Fluke Networks, Sticklers, MicroCare, HUBER+SUHNER, Senko, Optcore, and Senter Electronic. The report's quantitative and qualitative data provides a 360° view of the market's dynamics, trends, and future potential. The predicted market size for 2025 is xx million units.
Fiber Optic Cleaning Swab Market Dynamics & Structure
The fiber optic cleaning swab market exhibits a moderately concentrated structure, with several key players dominating the landscape. Technological innovation, particularly in swab materials and cleaning solutions, is a primary driver of growth. Stringent regulatory frameworks concerning fiber optic cleanliness in critical applications (telecommunications, data centers) influence market dynamics. Competitive substitutes, such as fiber optic cleaning cartridges, exist but often lack the precision and cost-effectiveness of swabs. End-user demographics are diverse, encompassing telecom operators, data center providers, enterprises, and research institutions. M&A activity in this sector remains moderate, with xx deals recorded between 2019 and 2024.
- Market Concentration: Moderately concentrated, with top 5 players holding xx% market share in 2024.
- Technological Innovation: Focus on improved material science for enhanced cleaning efficiency and longevity.
- Regulatory Landscape: Stringent standards for cleanliness in high-bandwidth applications drive demand for high-quality swabs.
- Competitive Substitutes: Cartridges and automated cleaning systems offer alternatives, but swabs retain significant market share due to cost-effectiveness and precision for specific applications.
- End-User Demographics: Telecommunications, Data Centers, Enterprise Networks, Research & Development.
- M&A Trends: xx mergers and acquisitions recorded between 2019 and 2024, indicating moderate consolidation.
Fiber Optic Cleaning Swab Growth Trends & Insights
The global fiber optic cleaning swab market experienced significant growth during the historical period (2019-2024), driven by the exponential rise in data transmission demands and the expanding global fiber optic network infrastructure. The market size grew from xx million units in 2019 to xx million units in 2024, exhibiting a CAGR of xx%. This growth trajectory is expected to continue, though at a slightly moderated pace, during the forecast period (2025-2033), with the market size projected to reach xx million units by 2033, achieving a CAGR of xx%. This moderated growth reflects a plateauing of initial market expansion and increased competition. Technological disruptions, such as the introduction of more efficient cleaning solutions and automated cleaning systems, are influencing adoption rates. Consumer behavior is shifting towards a preference for higher-quality, more durable swabs that minimize downtime and optimize operational efficiency.
Dominant Regions, Countries, or Segments in Fiber Optic Cleaning Swab
North America currently dominates the fiber optic cleaning swab market, driven by robust investments in telecommunications infrastructure and the presence of major data centers. This region accounts for approximately xx% of the global market share in 2025. Europe and Asia-Pacific are experiencing significant growth, fueled by expanding fiber optic networks and increasing digitalization.
- North America: Strong presence of telecom operators and data centers, high technological adoption.
- Europe: Growing fiber optic infrastructure deployments, stringent regulatory compliance requirements.
- Asia-Pacific: Rapid digitalization, increasing demand for high-speed internet connectivity.
- Market Share: North America (xx%), Europe (xx%), Asia-Pacific (xx%), Rest of World (xx%).
Fiber Optic Cleaning Swab Product Landscape
Fiber optic cleaning swabs are available in various designs, materials, and sizes, catering to specific applications and fiber types. Innovations focus on improving cleaning efficiency, reducing contamination risks, and enhancing the lifespan of the swabs. Advanced materials, such as specialized non-abrasive fabrics and precision-engineered tips, are enhancing performance. Key selling propositions include improved cleaning efficiency, reduced fiber damage, compatibility with various fiber types, and ease of use. Technological advancements include the integration of ergonomic designs and innovative packaging to maintain sterility.
Key Drivers, Barriers & Challenges in Fiber Optic Cleaning Swab
Key Drivers: The increasing demand for higher bandwidth and faster data transmission speeds is the primary driver. Expansion of 5G networks and the growth of data centers fuel this demand. Stringent industry standards emphasizing network reliability contribute significantly.
Key Challenges: The market faces challenges from the introduction of automated cleaning systems, which present competitive threats. Supply chain disruptions can impact raw material availability and manufacturing. Maintaining consistent product quality across different manufacturers is another key challenge. Furthermore, price competition among manufacturers can impact profitability.
Emerging Opportunities in Fiber Optic Cleaning Swab
Emerging opportunities lie in specialized swabs for advanced fiber optic technologies, such as multi-core fibers. The development of eco-friendly and sustainable swab materials is gaining traction, driven by environmental concerns. Expansion into untapped markets in developing economies presents significant potential for growth. The integration of smart technologies for improved tracking and management of swab usage is another emerging opportunity.
Growth Accelerators in the Fiber Optic Cleaning Swab Industry
Technological advancements in swab materials and cleaning solutions, fostering improved cleaning efficiency and reduced contamination risks, are key growth catalysts. Strategic partnerships between manufacturers and network operators optimize supply chain efficiency and market penetration. Expansion into emerging markets with burgeoning fiber optic infrastructure further accelerates market growth.
Key Players Shaping the Fiber Optic Cleaning Swab Market
- US Conec
- Thorlabs
- Chemtronics
- Fluke Networks
- Sticklers
- MicroCare
- HUBER+SUHNER
- Senko
- Optcore
- Senter Electronic
Notable Milestones in Fiber Optic Cleaning Swab Sector
- 2020: Introduction of eco-friendly cleaning swabs by MicroCare.
- 2021: US Conec launches a new line of precision cleaning swabs for high-density fiber optic connectors.
- 2022: Chemtronics acquires a smaller cleaning swab manufacturer, expanding its market share.
- 2023: Thorlabs releases a new automated cleaning system compatible with its cleaning swabs.
In-Depth Fiber Optic Cleaning Swab Market Outlook
The fiber optic cleaning swab market is poised for continued growth, driven by the sustained expansion of global fiber optic networks and increasing demand for high-speed data transmission. The market’s future potential rests on strategic partnerships, technological innovations, and effective market penetration strategies in emerging economies. Companies focusing on sustainable materials and advanced cleaning technologies will be well-positioned for long-term success.
Fiber Optic Cleaning Swab Segmentation
-
1. Application
- 1.1. Telecommunication Networks
- 1.2. Data Centers
- 1.3. Broadcasting
- 1.4. Others
-
2. Types
- 2.1. Single-use Swabs
- 2.2. Reusable Swabs
Fiber Optic Cleaning Swab Segmentation By Geography
-
1. North America
- 1.1. United States
- 1.2. Canada
- 1.3. Mexico
-
2. South America
- 2.1. Brazil
- 2.2. Argentina
- 2.3. Rest of South America
-
3. Europe
- 3.1. United Kingdom
- 3.2. Germany
- 3.3. France
- 3.4. Italy
- 3.5. Spain
- 3.6. Russia
- 3.7. Benelux
- 3.8. Nordics
- 3.9. Rest of Europe
-
4. Middle East & Africa
- 4.1. Turkey
- 4.2. Israel
- 4.3. GCC
- 4.4. North Africa
- 4.5. South Africa
- 4.6. Rest of Middle East & Africa
-
5. Asia Pacific
- 5.1. China
- 5.2. India
- 5.3. Japan
- 5.4. South Korea
- 5.5. ASEAN
- 5.6. Oceania
- 5.7. Rest of Asia Pacific

Fiber Optic Cleaning Swab Regional Market Share
Geographic Coverage of Fiber Optic Cleaning Swab
Fiber Optic Cleaning Swab REPORT HIGHLIGHTS
| Aspects | Details |
|---|---|
| Study Period | 2020-2034 |
| Base Year | 2025 |
| Estimated Year | 2026 |
| Forecast Period | 2026-2034 |
| Historical Period | 2020-2025 |
| Growth Rate | CAGR of 4.1% from 2020-2034 |
| Segmentation |
|
Table of Contents
- 1. Introduction
- 1.1. Research Scope
- 1.2. Market Segmentation
- 1.3. Research Methodology
- 1.4. Definitions and Assumptions
- 2. Executive Summary
- 2.1. Introduction
- 3. Market Dynamics
- 3.1. Introduction
- 3.2. Market Drivers
- 3.3. Market Restrains
- 3.4. Market Trends
- 4. Market Factor Analysis
- 4.1. Porters Five Forces
- 4.2. Supply/Value Chain
- 4.3. PESTEL analysis
- 4.4. Market Entropy
- 4.5. Patent/Trademark Analysis
- 5. Global Fiber Optic Cleaning Swab Analysis, Insights and Forecast, 2020-2032
- 5.1. Market Analysis, Insights and Forecast - by Application
- 5.1.1. Telecommunication Networks
- 5.1.2. Data Centers
- 5.1.3. Broadcasting
- 5.1.4. Others
- 5.2. Market Analysis, Insights and Forecast - by Types
- 5.2.1. Single-use Swabs
- 5.2.2. Reusable Swabs
- 5.3. Market Analysis, Insights and Forecast - by Region
- 5.3.1. North America
- 5.3.2. South America
- 5.3.3. Europe
- 5.3.4. Middle East & Africa
- 5.3.5. Asia Pacific
- 5.1. Market Analysis, Insights and Forecast - by Application
- 6. North America Fiber Optic Cleaning Swab Analysis, Insights and Forecast, 2020-2032
- 6.1. Market Analysis, Insights and Forecast - by Application
- 6.1.1. Telecommunication Networks
- 6.1.2. Data Centers
- 6.1.3. Broadcasting
- 6.1.4. Others
- 6.2. Market Analysis, Insights and Forecast - by Types
- 6.2.1. Single-use Swabs
- 6.2.2. Reusable Swabs
- 6.1. Market Analysis, Insights and Forecast - by Application
- 7. South America Fiber Optic Cleaning Swab Analysis, Insights and Forecast, 2020-2032
- 7.1. Market Analysis, Insights and Forecast - by Application
- 7.1.1. Telecommunication Networks
- 7.1.2. Data Centers
- 7.1.3. Broadcasting
- 7.1.4. Others
- 7.2. Market Analysis, Insights and Forecast - by Types
- 7.2.1. Single-use Swabs
- 7.2.2. Reusable Swabs
- 7.1. Market Analysis, Insights and Forecast - by Application
- 8. Europe Fiber Optic Cleaning Swab Analysis, Insights and Forecast, 2020-2032
- 8.1. Market Analysis, Insights and Forecast - by Application
- 8.1.1. Telecommunication Networks
- 8.1.2. Data Centers
- 8.1.3. Broadcasting
- 8.1.4. Others
- 8.2. Market Analysis, Insights and Forecast - by Types
- 8.2.1. Single-use Swabs
- 8.2.2. Reusable Swabs
- 8.1. Market Analysis, Insights and Forecast - by Application
- 9. Middle East & Africa Fiber Optic Cleaning Swab Analysis, Insights and Forecast, 2020-2032
- 9.1. Market Analysis, Insights and Forecast - by Application
- 9.1.1. Telecommunication Networks
- 9.1.2. Data Centers
- 9.1.3. Broadcasting
- 9.1.4. Others
- 9.2. Market Analysis, Insights and Forecast - by Types
- 9.2.1. Single-use Swabs
- 9.2.2. Reusable Swabs
- 9.1. Market Analysis, Insights and Forecast - by Application
- 10. Asia Pacific Fiber Optic Cleaning Swab Analysis, Insights and Forecast, 2020-2032
- 10.1. Market Analysis, Insights and Forecast - by Application
- 10.1.1. Telecommunication Networks
- 10.1.2. Data Centers
- 10.1.3. Broadcasting
- 10.1.4. Others
- 10.2. Market Analysis, Insights and Forecast - by Types
- 10.2.1. Single-use Swabs
- 10.2.2. Reusable Swabs
- 10.1. Market Analysis, Insights and Forecast - by Application
- 11. Competitive Analysis
- 11.1. Global Market Share Analysis 2025
- 11.2. Company Profiles
- 11.2.1 US Conec
- 11.2.1.1. Overview
- 11.2.1.2. Products
- 11.2.1.3. SWOT Analysis
- 11.2.1.4. Recent Developments
- 11.2.1.5. Financials (Based on Availability)
- 11.2.2 Thorlabs
- 11.2.2.1. Overview
- 11.2.2.2. Products
- 11.2.2.3. SWOT Analysis
- 11.2.2.4. Recent Developments
- 11.2.2.5. Financials (Based on Availability)
- 11.2.3 Chemtronics
- 11.2.3.1. Overview
- 11.2.3.2. Products
- 11.2.3.3. SWOT Analysis
- 11.2.3.4. Recent Developments
- 11.2.3.5. Financials (Based on Availability)
- 11.2.4 Fluke Networks
- 11.2.4.1. Overview
- 11.2.4.2. Products
- 11.2.4.3. SWOT Analysis
- 11.2.4.4. Recent Developments
- 11.2.4.5. Financials (Based on Availability)
- 11.2.5 Sticklers
- 11.2.5.1. Overview
- 11.2.5.2. Products
- 11.2.5.3. SWOT Analysis
- 11.2.5.4. Recent Developments
- 11.2.5.5. Financials (Based on Availability)
- 11.2.6 MicroCare
- 11.2.6.1. Overview
- 11.2.6.2. Products
- 11.2.6.3. SWOT Analysis
- 11.2.6.4. Recent Developments
- 11.2.6.5. Financials (Based on Availability)
- 11.2.7 HUBER+SUHNER
- 11.2.7.1. Overview
- 11.2.7.2. Products
- 11.2.7.3. SWOT Analysis
- 11.2.7.4. Recent Developments
- 11.2.7.5. Financials (Based on Availability)
- 11.2.8 Senko
- 11.2.8.1. Overview
- 11.2.8.2. Products
- 11.2.8.3. SWOT Analysis
- 11.2.8.4. Recent Developments
- 11.2.8.5. Financials (Based on Availability)
- 11.2.9 Optcore
- 11.2.9.1. Overview
- 11.2.9.2. Products
- 11.2.9.3. SWOT Analysis
- 11.2.9.4. Recent Developments
- 11.2.9.5. Financials (Based on Availability)
- 11.2.10 Senter Electronic
- 11.2.10.1. Overview
- 11.2.10.2. Products
- 11.2.10.3. SWOT Analysis
- 11.2.10.4. Recent Developments
- 11.2.10.5. Financials (Based on Availability)
- 11.2.1 US Conec
List of Figures
- Figure 1: Global Fiber Optic Cleaning Swab Revenue Breakdown (million, %) by Region 2025 & 2033
- Figure 2: Global Fiber Optic Cleaning Swab Volume Breakdown (K, %) by Region 2025 & 2033
- Figure 3: North America Fiber Optic Cleaning Swab Revenue (million), by Application 2025 & 2033
- Figure 4: North America Fiber Optic Cleaning Swab Volume (K), by Application 2025 & 2033
- Figure 5: North America Fiber Optic Cleaning Swab Revenue Share (%), by Application 2025 & 2033
- Figure 6: North America Fiber Optic Cleaning Swab Volume Share (%), by Application 2025 & 2033
- Figure 7: North America Fiber Optic Cleaning Swab Revenue (million), by Types 2025 & 2033
- Figure 8: North America Fiber Optic Cleaning Swab Volume (K), by Types 2025 & 2033
- Figure 9: North America Fiber Optic Cleaning Swab Revenue Share (%), by Types 2025 & 2033
- Figure 10: North America Fiber Optic Cleaning Swab Volume Share (%), by Types 2025 & 2033
- Figure 11: North America Fiber Optic Cleaning Swab Revenue (million), by Country 2025 & 2033
- Figure 12: North America Fiber Optic Cleaning Swab Volume (K), by Country 2025 & 2033
- Figure 13: North America Fiber Optic Cleaning Swab Revenue Share (%), by Country 2025 & 2033
- Figure 14: North America Fiber Optic Cleaning Swab Volume Share (%), by Country 2025 & 2033
- Figure 15: South America Fiber Optic Cleaning Swab Revenue (million), by Application 2025 & 2033
- Figure 16: South America Fiber Optic Cleaning Swab Volume (K), by Application 2025 & 2033
- Figure 17: South America Fiber Optic Cleaning Swab Revenue Share (%), by Application 2025 & 2033
- Figure 18: South America Fiber Optic Cleaning Swab Volume Share (%), by Application 2025 & 2033
- Figure 19: South America Fiber Optic Cleaning Swab Revenue (million), by Types 2025 & 2033
- Figure 20: South America Fiber Optic Cleaning Swab Volume (K), by Types 2025 & 2033
- Figure 21: South America Fiber Optic Cleaning Swab Revenue Share (%), by Types 2025 & 2033
- Figure 22: South America Fiber Optic Cleaning Swab Volume Share (%), by Types 2025 & 2033
- Figure 23: South America Fiber Optic Cleaning Swab Revenue (million), by Country 2025 & 2033
- Figure 24: South America Fiber Optic Cleaning Swab Volume (K), by Country 2025 & 2033
- Figure 25: South America Fiber Optic Cleaning Swab Revenue Share (%), by Country 2025 & 2033
- Figure 26: South America Fiber Optic Cleaning Swab Volume Share (%), by Country 2025 & 2033
- Figure 27: Europe Fiber Optic Cleaning Swab Revenue (million), by Application 2025 & 2033
- Figure 28: Europe Fiber Optic Cleaning Swab Volume (K), by Application 2025 & 2033
- Figure 29: Europe Fiber Optic Cleaning Swab Revenue Share (%), by Application 2025 & 2033
- Figure 30: Europe Fiber Optic Cleaning Swab Volume Share (%), by Application 2025 & 2033
- Figure 31: Europe Fiber Optic Cleaning Swab Revenue (million), by Types 2025 & 2033
- Figure 32: Europe Fiber Optic Cleaning Swab Volume (K), by Types 2025 & 2033
- Figure 33: Europe Fiber Optic Cleaning Swab Revenue Share (%), by Types 2025 & 2033
- Figure 34: Europe Fiber Optic Cleaning Swab Volume Share (%), by Types 2025 & 2033
- Figure 35: Europe Fiber Optic Cleaning Swab Revenue (million), by Country 2025 & 2033
- Figure 36: Europe Fiber Optic Cleaning Swab Volume (K), by Country 2025 & 2033
- Figure 37: Europe Fiber Optic Cleaning Swab Revenue Share (%), by Country 2025 & 2033
- Figure 38: Europe Fiber Optic Cleaning Swab Volume Share (%), by Country 2025 & 2033
- Figure 39: Middle East & Africa Fiber Optic Cleaning Swab Revenue (million), by Application 2025 & 2033
- Figure 40: Middle East & Africa Fiber Optic Cleaning Swab Volume (K), by Application 2025 & 2033
- Figure 41: Middle East & Africa Fiber Optic Cleaning Swab Revenue Share (%), by Application 2025 & 2033
- Figure 42: Middle East & Africa Fiber Optic Cleaning Swab Volume Share (%), by Application 2025 & 2033
- Figure 43: Middle East & Africa Fiber Optic Cleaning Swab Revenue (million), by Types 2025 & 2033
- Figure 44: Middle East & Africa Fiber Optic Cleaning Swab Volume (K), by Types 2025 & 2033
- Figure 45: Middle East & Africa Fiber Optic Cleaning Swab Revenue Share (%), by Types 2025 & 2033
- Figure 46: Middle East & Africa Fiber Optic Cleaning Swab Volume Share (%), by Types 2025 & 2033
- Figure 47: Middle East & Africa Fiber Optic Cleaning Swab Revenue (million), by Country 2025 & 2033
- Figure 48: Middle East & Africa Fiber Optic Cleaning Swab Volume (K), by Country 2025 & 2033
- Figure 49: Middle East & Africa Fiber Optic Cleaning Swab Revenue Share (%), by Country 2025 & 2033
- Figure 50: Middle East & Africa Fiber Optic Cleaning Swab Volume Share (%), by Country 2025 & 2033
- Figure 51: Asia Pacific Fiber Optic Cleaning Swab Revenue (million), by Application 2025 & 2033
- Figure 52: Asia Pacific Fiber Optic Cleaning Swab Volume (K), by Application 2025 & 2033
- Figure 53: Asia Pacific Fiber Optic Cleaning Swab Revenue Share (%), by Application 2025 & 2033
- Figure 54: Asia Pacific Fiber Optic Cleaning Swab Volume Share (%), by Application 2025 & 2033
- Figure 55: Asia Pacific Fiber Optic Cleaning Swab Revenue (million), by Types 2025 & 2033
- Figure 56: Asia Pacific Fiber Optic Cleaning Swab Volume (K), by Types 2025 & 2033
- Figure 57: Asia Pacific Fiber Optic Cleaning Swab Revenue Share (%), by Types 2025 & 2033
- Figure 58: Asia Pacific Fiber Optic Cleaning Swab Volume Share (%), by Types 2025 & 2033
- Figure 59: Asia Pacific Fiber Optic Cleaning Swab Revenue (million), by Country 2025 & 2033
- Figure 60: Asia Pacific Fiber Optic Cleaning Swab Volume (K), by Country 2025 & 2033
- Figure 61: Asia Pacific Fiber Optic Cleaning Swab Revenue Share (%), by Country 2025 & 2033
- Figure 62: Asia Pacific Fiber Optic Cleaning Swab Volume Share (%), by Country 2025 & 2033
List of Tables
- Table 1: Global Fiber Optic Cleaning Swab Revenue million Forecast, by Application 2020 & 2033
- Table 2: Global Fiber Optic Cleaning Swab Volume K Forecast, by Application 2020 & 2033
- Table 3: Global Fiber Optic Cleaning Swab Revenue million Forecast, by Types 2020 & 2033
- Table 4: Global Fiber Optic Cleaning Swab Volume K Forecast, by Types 2020 & 2033
- Table 5: Global Fiber Optic Cleaning Swab Revenue million Forecast, by Region 2020 & 2033
- Table 6: Global Fiber Optic Cleaning Swab Volume K Forecast, by Region 2020 & 2033
- Table 7: Global Fiber Optic Cleaning Swab Revenue million Forecast, by Application 2020 & 2033
- Table 8: Global Fiber Optic Cleaning Swab Volume K Forecast, by Application 2020 & 2033
- Table 9: Global Fiber Optic Cleaning Swab Revenue million Forecast, by Types 2020 & 2033
- Table 10: Global Fiber Optic Cleaning Swab Volume K Forecast, by Types 2020 & 2033
- Table 11: Global Fiber Optic Cleaning Swab Revenue million Forecast, by Country 2020 & 2033
- Table 12: Global Fiber Optic Cleaning Swab Volume K Forecast, by Country 2020 & 2033
- Table 13: United States Fiber Optic Cleaning Swab Revenue (million) Forecast, by Application 2020 & 2033
- Table 14: United States Fiber Optic Cleaning Swab Volume (K) Forecast, by Application 2020 & 2033
- Table 15: Canada Fiber Optic Cleaning Swab Revenue (million) Forecast, by Application 2020 & 2033
- Table 16: Canada Fiber Optic Cleaning Swab Volume (K) Forecast, by Application 2020 & 2033
- Table 17: Mexico Fiber Optic Cleaning Swab Revenue (million) Forecast, by Application 2020 & 2033
- Table 18: Mexico Fiber Optic Cleaning Swab Volume (K) Forecast, by Application 2020 & 2033
- Table 19: Global Fiber Optic Cleaning Swab Revenue million Forecast, by Application 2020 & 2033
- Table 20: Global Fiber Optic Cleaning Swab Volume K Forecast, by Application 2020 & 2033
- Table 21: Global Fiber Optic Cleaning Swab Revenue million Forecast, by Types 2020 & 2033
- Table 22: Global Fiber Optic Cleaning Swab Volume K Forecast, by Types 2020 & 2033
- Table 23: Global Fiber Optic Cleaning Swab Revenue million Forecast, by Country 2020 & 2033
- Table 24: Global Fiber Optic Cleaning Swab Volume K Forecast, by Country 2020 & 2033
- Table 25: Brazil Fiber Optic Cleaning Swab Revenue (million) Forecast, by Application 2020 & 2033
- Table 26: Brazil Fiber Optic Cleaning Swab Volume (K) Forecast, by Application 2020 & 2033
- Table 27: Argentina Fiber Optic Cleaning Swab Revenue (million) Forecast, by Application 2020 & 2033
- Table 28: Argentina Fiber Optic Cleaning Swab Volume (K) Forecast, by Application 2020 & 2033
- Table 29: Rest of South America Fiber Optic Cleaning Swab Revenue (million) Forecast, by Application 2020 & 2033
- Table 30: Rest of South America Fiber Optic Cleaning Swab Volume (K) Forecast, by Application 2020 & 2033
- Table 31: Global Fiber Optic Cleaning Swab Revenue million Forecast, by Application 2020 & 2033
- Table 32: Global Fiber Optic Cleaning Swab Volume K Forecast, by Application 2020 & 2033
- Table 33: Global Fiber Optic Cleaning Swab Revenue million Forecast, by Types 2020 & 2033
- Table 34: Global Fiber Optic Cleaning Swab Volume K Forecast, by Types 2020 & 2033
- Table 35: Global Fiber Optic Cleaning Swab Revenue million Forecast, by Country 2020 & 2033
- Table 36: Global Fiber Optic Cleaning Swab Volume K Forecast, by Country 2020 & 2033
- Table 37: United Kingdom Fiber Optic Cleaning Swab Revenue (million) Forecast, by Application 2020 & 2033
- Table 38: United Kingdom Fiber Optic Cleaning Swab Volume (K) Forecast, by Application 2020 & 2033
- Table 39: Germany Fiber Optic Cleaning Swab Revenue (million) Forecast, by Application 2020 & 2033
- Table 40: Germany Fiber Optic Cleaning Swab Volume (K) Forecast, by Application 2020 & 2033
- Table 41: France Fiber Optic Cleaning Swab Revenue (million) Forecast, by Application 2020 & 2033
- Table 42: France Fiber Optic Cleaning Swab Volume (K) Forecast, by Application 2020 & 2033
- Table 43: Italy Fiber Optic Cleaning Swab Revenue (million) Forecast, by Application 2020 & 2033
- Table 44: Italy Fiber Optic Cleaning Swab Volume (K) Forecast, by Application 2020 & 2033
- Table 45: Spain Fiber Optic Cleaning Swab Revenue (million) Forecast, by Application 2020 & 2033
- Table 46: Spain Fiber Optic Cleaning Swab Volume (K) Forecast, by Application 2020 & 2033
- Table 47: Russia Fiber Optic Cleaning Swab Revenue (million) Forecast, by Application 2020 & 2033
- Table 48: Russia Fiber Optic Cleaning Swab Volume (K) Forecast, by Application 2020 & 2033
- Table 49: Benelux Fiber Optic Cleaning Swab Revenue (million) Forecast, by Application 2020 & 2033
- Table 50: Benelux Fiber Optic Cleaning Swab Volume (K) Forecast, by Application 2020 & 2033
- Table 51: Nordics Fiber Optic Cleaning Swab Revenue (million) Forecast, by Application 2020 & 2033
- Table 52: Nordics Fiber Optic Cleaning Swab Volume (K) Forecast, by Application 2020 & 2033
- Table 53: Rest of Europe Fiber Optic Cleaning Swab Revenue (million) Forecast, by Application 2020 & 2033
- Table 54: Rest of Europe Fiber Optic Cleaning Swab Volume (K) Forecast, by Application 2020 & 2033
- Table 55: Global Fiber Optic Cleaning Swab Revenue million Forecast, by Application 2020 & 2033
- Table 56: Global Fiber Optic Cleaning Swab Volume K Forecast, by Application 2020 & 2033
- Table 57: Global Fiber Optic Cleaning Swab Revenue million Forecast, by Types 2020 & 2033
- Table 58: Global Fiber Optic Cleaning Swab Volume K Forecast, by Types 2020 & 2033
- Table 59: Global Fiber Optic Cleaning Swab Revenue million Forecast, by Country 2020 & 2033
- Table 60: Global Fiber Optic Cleaning Swab Volume K Forecast, by Country 2020 & 2033
- Table 61: Turkey Fiber Optic Cleaning Swab Revenue (million) Forecast, by Application 2020 & 2033
- Table 62: Turkey Fiber Optic Cleaning Swab Volume (K) Forecast, by Application 2020 & 2033
- Table 63: Israel Fiber Optic Cleaning Swab Revenue (million) Forecast, by Application 2020 & 2033
- Table 64: Israel Fiber Optic Cleaning Swab Volume (K) Forecast, by Application 2020 & 2033
- Table 65: GCC Fiber Optic Cleaning Swab Revenue (million) Forecast, by Application 2020 & 2033
- Table 66: GCC Fiber Optic Cleaning Swab Volume (K) Forecast, by Application 2020 & 2033
- Table 67: North Africa Fiber Optic Cleaning Swab Revenue (million) Forecast, by Application 2020 & 2033
- Table 68: North Africa Fiber Optic Cleaning Swab Volume (K) Forecast, by Application 2020 & 2033
- Table 69: South Africa Fiber Optic Cleaning Swab Revenue (million) Forecast, by Application 2020 & 2033
- Table 70: South Africa Fiber Optic Cleaning Swab Volume (K) Forecast, by Application 2020 & 2033
- Table 71: Rest of Middle East & Africa Fiber Optic Cleaning Swab Revenue (million) Forecast, by Application 2020 & 2033
- Table 72: Rest of Middle East & Africa Fiber Optic Cleaning Swab Volume (K) Forecast, by Application 2020 & 2033
- Table 73: Global Fiber Optic Cleaning Swab Revenue million Forecast, by Application 2020 & 2033
- Table 74: Global Fiber Optic Cleaning Swab Volume K Forecast, by Application 2020 & 2033
- Table 75: Global Fiber Optic Cleaning Swab Revenue million Forecast, by Types 2020 & 2033
- Table 76: Global Fiber Optic Cleaning Swab Volume K Forecast, by Types 2020 & 2033
- Table 77: Global Fiber Optic Cleaning Swab Revenue million Forecast, by Country 2020 & 2033
- Table 78: Global Fiber Optic Cleaning Swab Volume K Forecast, by Country 2020 & 2033
- Table 79: China Fiber Optic Cleaning Swab Revenue (million) Forecast, by Application 2020 & 2033
- Table 80: China Fiber Optic Cleaning Swab Volume (K) Forecast, by Application 2020 & 2033
- Table 81: India Fiber Optic Cleaning Swab Revenue (million) Forecast, by Application 2020 & 2033
- Table 82: India Fiber Optic Cleaning Swab Volume (K) Forecast, by Application 2020 & 2033
- Table 83: Japan Fiber Optic Cleaning Swab Revenue (million) Forecast, by Application 2020 & 2033
- Table 84: Japan Fiber Optic Cleaning Swab Volume (K) Forecast, by Application 2020 & 2033
- Table 85: South Korea Fiber Optic Cleaning Swab Revenue (million) Forecast, by Application 2020 & 2033
- Table 86: South Korea Fiber Optic Cleaning Swab Volume (K) Forecast, by Application 2020 & 2033
- Table 87: ASEAN Fiber Optic Cleaning Swab Revenue (million) Forecast, by Application 2020 & 2033
- Table 88: ASEAN Fiber Optic Cleaning Swab Volume (K) Forecast, by Application 2020 & 2033
- Table 89: Oceania Fiber Optic Cleaning Swab Revenue (million) Forecast, by Application 2020 & 2033
- Table 90: Oceania Fiber Optic Cleaning Swab Volume (K) Forecast, by Application 2020 & 2033
- Table 91: Rest of Asia Pacific Fiber Optic Cleaning Swab Revenue (million) Forecast, by Application 2020 & 2033
- Table 92: Rest of Asia Pacific Fiber Optic Cleaning Swab Volume (K) Forecast, by Application 2020 & 2033
Frequently Asked Questions
1. What is the projected Compound Annual Growth Rate (CAGR) of the Fiber Optic Cleaning Swab?
The projected CAGR is approximately 4.1%.
2. Which companies are prominent players in the Fiber Optic Cleaning Swab?
Key companies in the market include US Conec, Thorlabs, Chemtronics, Fluke Networks, Sticklers, MicroCare, HUBER+SUHNER, Senko, Optcore, Senter Electronic.
3. What are the main segments of the Fiber Optic Cleaning Swab?
The market segments include Application, Types.
4. Can you provide details about the market size?
The market size is estimated to be USD 863.5 million as of 2022.
5. What are some drivers contributing to market growth?
N/A
6. What are the notable trends driving market growth?
N/A
7. Are there any restraints impacting market growth?
N/A
8. Can you provide examples of recent developments in the market?
N/A
9. What pricing options are available for accessing the report?
Pricing options include single-user, multi-user, and enterprise licenses priced at USD 3950.00, USD 5925.00, and USD 7900.00 respectively.
10. Is the market size provided in terms of value or volume?
The market size is provided in terms of value, measured in million and volume, measured in K.
11. Are there any specific market keywords associated with the report?
Yes, the market keyword associated with the report is "Fiber Optic Cleaning Swab," which aids in identifying and referencing the specific market segment covered.
12. How do I determine which pricing option suits my needs best?
The pricing options vary based on user requirements and access needs. Individual users may opt for single-user licenses, while businesses requiring broader access may choose multi-user or enterprise licenses for cost-effective access to the report.
13. Are there any additional resources or data provided in the Fiber Optic Cleaning Swab report?
While the report offers comprehensive insights, it's advisable to review the specific contents or supplementary materials provided to ascertain if additional resources or data are available.
14. How can I stay updated on further developments or reports in the Fiber Optic Cleaning Swab?
To stay informed about further developments, trends, and reports in the Fiber Optic Cleaning Swab, consider subscribing to industry newsletters, following relevant companies and organizations, or regularly checking reputable industry news sources and publications.
Methodology
Step 1 - Identification of Relevant Samples Size from Population Database


Step 2 - Approaches for Defining Global Market Size (Value, Volume* & Price*)

Note*: In applicable scenarios
Step 3 - Data Sources
Primary Research
- Web Analytics
- Survey Reports
- Research Institute
- Latest Research Reports
- Opinion Leaders
Secondary Research
- Annual Reports
- White Paper
- Latest Press Release
- Industry Association
- Paid Database
- Investor Presentations

Step 4 - Data Triangulation
Involves using different sources of information in order to increase the validity of a study
These sources are likely to be stakeholders in a program - participants, other researchers, program staff, other community members, and so on.
Then we put all data in single framework & apply various statistical tools to find out the dynamic on the market.
During the analysis stage, feedback from the stakeholder groups would be compared to determine areas of agreement as well as areas of divergence