

Key Insights
The global fiber optic testing services market is experiencing robust growth, driven by the expanding deployment of fiber optic networks for high-speed data transmission and the increasing demand for reliable network infrastructure. The market's Compound Annual Growth Rate (CAGR) is estimated to be around 8% from 2025-2033, projecting a significant expansion in market value. Key drivers include the proliferation of 5G networks, the rise of cloud computing and data centers requiring extensive fiber connectivity, and the increasing adoption of fiber optics in various industries like telecommunications, healthcare, and manufacturing. Furthermore, the growing need for network monitoring and maintenance to ensure optimal performance and minimize downtime is fueling market demand. The market is segmented by service type (installation testing, maintenance testing, etc.), application (telecommunications, data centers, etc.), and geography. Leading companies in the market are actively investing in research and development to offer innovative testing solutions, such as automated testing systems and advanced diagnostic tools. Competitive landscape is characterized by a mix of established players and emerging companies, creating a dynamic market with continuous innovation.
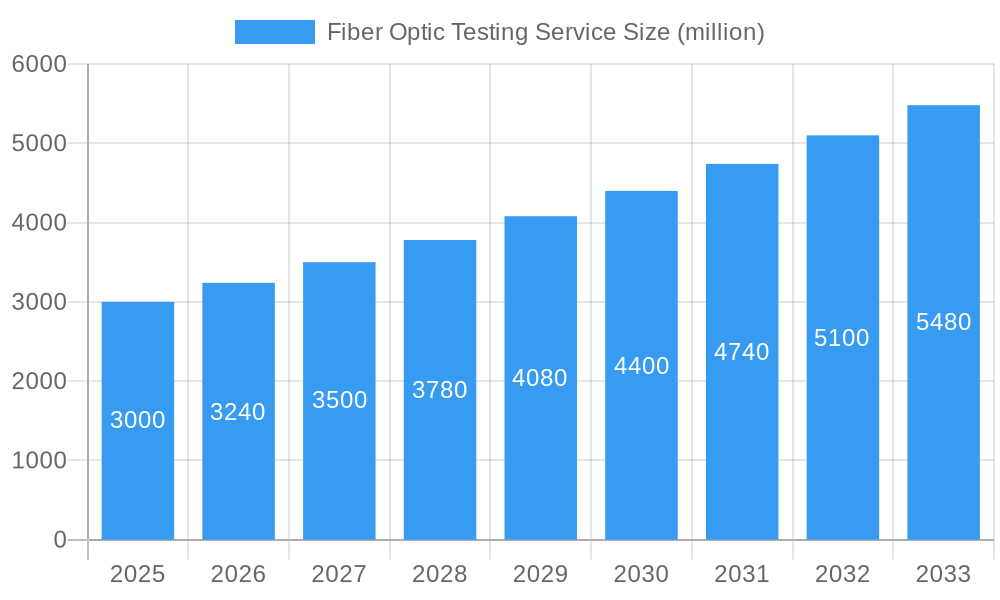
Fiber Optic Testing Service Market Size (In Billion)
Market restraints include the high initial investment costs associated with fiber optic infrastructure and specialized testing equipment. However, ongoing technological advancements are mitigating these challenges, making fiber optic testing solutions more cost-effective and accessible. The emergence of innovative testing methods and the development of more compact and portable equipment are also contributing to the market's growth. The regional distribution of the market is largely influenced by the rate of fiber optic network deployment across various regions, with developed economies initially leading the way, and developing economies witnessing accelerated growth. The forecast period of 2025-2033 presents substantial opportunities for businesses operating in this sector, with continued market expansion fueled by technological advancements and growing industry demand. We project that the market size in 2025 will be around $3 billion, reaching approximately $5 billion by 2033 based on our 8% CAGR estimate.
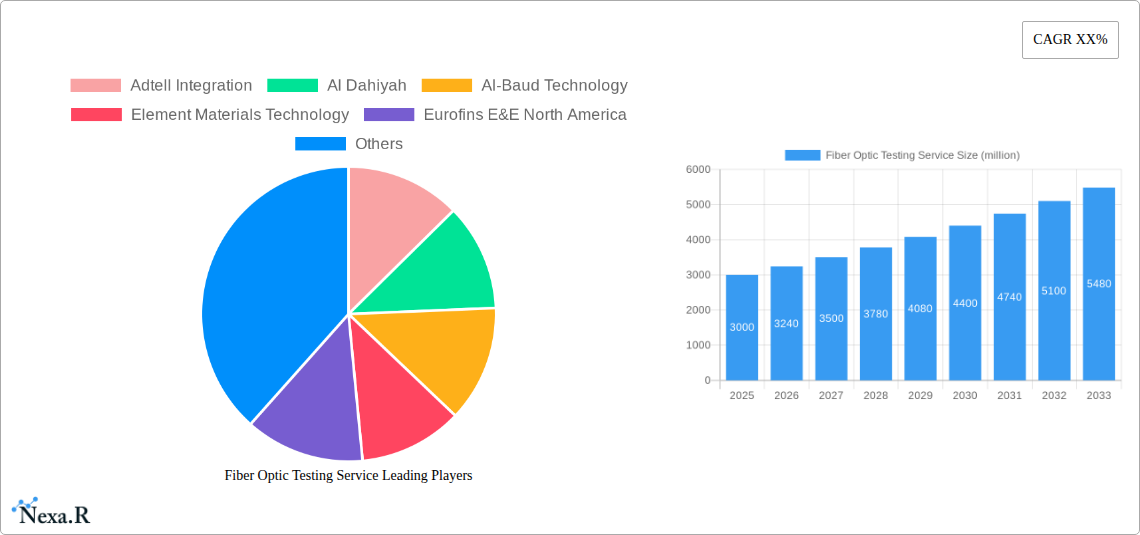
Fiber Optic Testing Service Company Market Share
Fiber Optic Testing Service Market Report: 2019-2033
This comprehensive report provides an in-depth analysis of the Fiber Optic Testing Service market, covering the period from 2019 to 2033. It examines market dynamics, growth trends, regional dominance, product landscape, key players, and future opportunities within the parent market of Telecommunications and the child market of Network Infrastructure. The report leverages extensive primary and secondary research, providing valuable insights for industry professionals, investors, and strategic decision-makers. The base year for this analysis is 2025, with estimations for 2025 and forecasts extending to 2033. The historical period covered is 2019-2024.
Fiber Optic Testing Service Market Dynamics & Structure
The Fiber Optic Testing Service market is characterized by a moderately concentrated structure, with several large players and numerous smaller, specialized firms. Technological innovation, particularly in areas like OTDRs (Optical Time Domain Reflectometers) and optical spectrum analyzers, is a key driver. Regulatory frameworks, particularly concerning network reliability and security, significantly impact market growth. Competitive substitutes include traditional copper-based testing methods, although fiber optics' advantages in bandwidth and distance are increasingly driving market adoption. End-user demographics are expanding beyond telecom providers to include data centers, government agencies, and enterprises. Mergers and acquisitions (M&A) activity has been moderate, with larger firms acquiring smaller specialized companies to expand their product portfolios and service capabilities. The market share of the top 5 players in 2025 is estimated at xx%. In the historical period (2019-2024), approximately xx M&A deals were recorded within the sector, mainly driven by the need for enhanced capabilities and broader market reach.
- Market Concentration: Moderately concentrated; top 5 players hold xx% market share (2025).
- Technological Drivers: Advancements in OTDRs, optical spectrum analyzers, and automated testing systems.
- Regulatory Influence: Stringent standards for network reliability and security drive demand.
- Competitive Substitutes: Traditional copper testing methods, but facing increasing obsolescence.
- End-User Demographics: Expanding to data centers, government, and enterprise segments.
- M&A Activity: Moderate activity (xx deals 2019-2024) focusing on portfolio expansion and geographic reach.
- Innovation Barriers: High R&D costs and the need for specialized expertise.
Fiber Optic Testing Service Growth Trends & Insights
The Fiber Optic Testing Service market exhibited strong growth during the historical period (2019-2024), primarily fueled by the global expansion of high-speed internet infrastructure and the growing adoption of fiber optic networks. The market size increased from xx million USD in 2019 to xx million USD in 2024, representing a CAGR of xx%. This growth is expected to continue during the forecast period (2025-2033), driven by factors such as 5G deployment, the rise of data centers, and increasing demand for high-bandwidth applications. Technological disruptions, such as the integration of AI and machine learning in testing solutions, are further accelerating market expansion. Shifts in consumer behavior, with a growing preference for high-speed, reliable internet services, also contribute to the market’s sustained growth. The market penetration rate is projected to reach xx% by 2033.
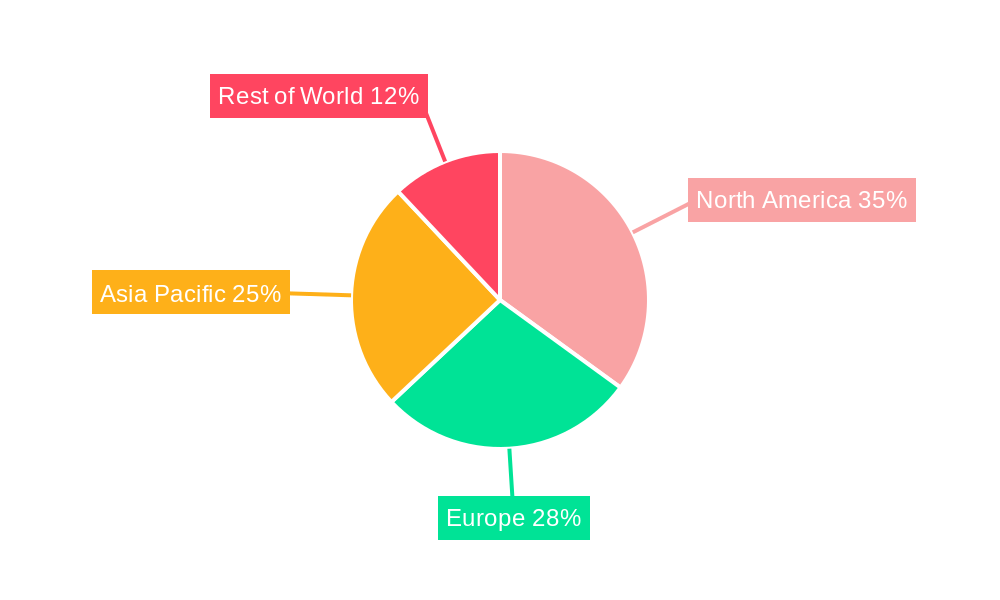
Dominant Regions, Countries, or Segments in Fiber Optic Testing Service
North America currently holds the largest market share in the Fiber Optic Testing Service market, driven by robust investments in infrastructure modernization and the presence of major players. However, Asia-Pacific is projected to witness the fastest growth during the forecast period, fueled by rapid urbanization, increasing digitalization, and substantial government investments in telecom infrastructure. Europe also contributes significantly due to the widespread adoption of fiber optic networks across various sectors.
- North America: Strong market share due to infrastructure investments and established players.
- Asia-Pacific: Fastest growth due to increasing digitalization and infrastructural development.
- Europe: Significant market contribution due to widespread fiber optic network adoption.
- Key Drivers: Government policies favoring digital infrastructure, increasing demand for high-speed internet, and rapid urbanization.
Fiber Optic Testing Service Product Landscape
The Fiber Optic Testing Service market offers a diverse range of products, including OTDRs, optical power meters, optical spectrum analyzers, and integrated testing solutions. Recent innovations focus on enhanced accuracy, portability, automation, and integration with existing network management systems. These advancements improve testing efficiency and reduce operational costs. Key selling propositions often include ease of use, robust performance, and comprehensive reporting capabilities. Technological advancements are consistently improving the speed and accuracy of testing, leading to quicker deployment of fiber optic networks and reduced downtime.
Key Drivers, Barriers & Challenges in Fiber Optic Testing Service
Key Drivers:
- The expanding global fiber optic infrastructure is a major driver.
- Increasing demand for high-bandwidth applications in sectors like telecommunications and data centers fuels growth.
- Technological advancements in testing equipment enhance efficiency and accuracy.
- Favorable government regulations promoting digital infrastructure development.
Challenges & Restraints:
- The high cost of advanced testing equipment can be a barrier to entry for smaller businesses.
- Supply chain disruptions can impact the availability of components and potentially raise prices.
- Intense competition among existing players requires continuous innovation.
- Skill gaps in handling advanced equipment can hinder market expansion.
Emerging Opportunities in Fiber Optic Testing Service
- Expanding into untapped markets in developing regions.
- Development of specialized testing solutions for emerging technologies such as fiber-to-the-home (FTTH) and 5G.
- Integration of AI and machine learning for predictive maintenance and automated fault detection.
- Growing demand for cloud-based testing solutions and remote monitoring capabilities.
Growth Accelerators in the Fiber Optic Testing Service Industry
Strategic partnerships between equipment manufacturers and telecom operators are accelerating market growth by fostering innovation and expanding market access. Technological breakthroughs in fiber optic testing technologies, such as the development of more compact and user-friendly devices, continue to drive adoption. Expansion into new geographical markets and vertical industries, especially in developing economies, offers considerable growth potential.
Key Players Shaping the Fiber Optic Testing Service Market
- Adtell Integration
- Al Dahiyah
- Al-Baud Technology
- Element Materials Technology
- Eurofins E&E North America
- EXFO
- Fibertechs
- Fluke
- Fujikura
- Global Emirates Cables & Systems Industries
- Intertek
- L3Harris Technologies
- Mercantile
- Middle East Fiber Cable Manufacturing
- National Technical Systems
- Nour Communications
- OPTOKON
- Tuv Rheinland
- UL
- Viavi Solutions
Notable Milestones in Fiber Optic Testing Service Sector
- 2020: Viavi Solutions launched a new generation of OTDRs with enhanced capabilities.
- 2021: Fluke acquired a smaller testing equipment manufacturer, expanding its product portfolio.
- 2022: Several key players announced partnerships to develop integrated testing solutions for 5G networks.
- 2023: Significant investments in R&D resulted in several new product launches in the sector.
- 2024: A major merger consolidated market share in the European region.
In-Depth Fiber Optic Testing Service Market Outlook
The Fiber Optic Testing Service market is poised for continued robust growth throughout the forecast period (2025-2033), driven by ongoing investments in global fiber optic infrastructure, technological advancements, and expanding applications across various industries. Strategic partnerships and innovative product development will be crucial for companies to maintain a competitive edge. The market's future potential is substantial, particularly in emerging economies and sectors that rely on high-bandwidth connectivity. Opportunities exist for companies focused on developing advanced testing solutions for emerging technologies and those providing integrated and cloud-based testing services.
Fiber Optic Testing Service Segmentation
-
1. Application
- 1.1. Research and Development
- 1.2. Installation and Maintenance
- 1.3. Measurement Solutions
- 1.4. Safety and Monitoring Solutions
-
2. Types
- 2.1. Certification Services
- 2.2. Inspection Services
- 2.3. Testing Services
Fiber Optic Testing Service Segmentation By Geography
-
1. North America
- 1.1. United States
- 1.2. Canada
- 1.3. Mexico
-
2. South America
- 2.1. Brazil
- 2.2. Argentina
- 2.3. Rest of South America
-
3. Europe
- 3.1. United Kingdom
- 3.2. Germany
- 3.3. France
- 3.4. Italy
- 3.5. Spain
- 3.6. Russia
- 3.7. Benelux
- 3.8. Nordics
- 3.9. Rest of Europe
-
4. Middle East & Africa
- 4.1. Turkey
- 4.2. Israel
- 4.3. GCC
- 4.4. North Africa
- 4.5. South Africa
- 4.6. Rest of Middle East & Africa
-
5. Asia Pacific
- 5.1. China
- 5.2. India
- 5.3. Japan
- 5.4. South Korea
- 5.5. ASEAN
- 5.6. Oceania
- 5.7. Rest of Asia Pacific
Fiber Optic Testing Service Regional Market Share
Geographic Coverage of Fiber Optic Testing Service
Fiber Optic Testing Service REPORT HIGHLIGHTS
| Aspects | Details |
|---|---|
| Study Period | 2020-2034 |
| Base Year | 2025 |
| Estimated Year | 2026 |
| Forecast Period | 2026-2034 |
| Historical Period | 2020-2025 |
| Growth Rate | CAGR of XX% from 2020-2034 |
| Segmentation |
|
Table of Contents
- 1. Introduction
- 1.1. Research Scope
- 1.2. Market Segmentation
- 1.3. Research Methodology
- 1.4. Definitions and Assumptions
- 2. Executive Summary
- 2.1. Introduction
- 3. Market Dynamics
- 3.1. Introduction
- 3.2. Market Drivers
- 3.3. Market Restrains
- 3.4. Market Trends
- 4. Market Factor Analysis
- 4.1. Porters Five Forces
- 4.2. Supply/Value Chain
- 4.3. PESTEL analysis
- 4.4. Market Entropy
- 4.5. Patent/Trademark Analysis
- 5. Global Fiber Optic Testing Service Analysis, Insights and Forecast, 2020-2032
- 5.1. Market Analysis, Insights and Forecast - by Application
- 5.1.1. Research and Development
- 5.1.2. Installation and Maintenance
- 5.1.3. Measurement Solutions
- 5.1.4. Safety and Monitoring Solutions
- 5.2. Market Analysis, Insights and Forecast - by Types
- 5.2.1. Certification Services
- 5.2.2. Inspection Services
- 5.2.3. Testing Services
- 5.3. Market Analysis, Insights and Forecast - by Region
- 5.3.1. North America
- 5.3.2. South America
- 5.3.3. Europe
- 5.3.4. Middle East & Africa
- 5.3.5. Asia Pacific
- 5.1. Market Analysis, Insights and Forecast - by Application
- 6. North America Fiber Optic Testing Service Analysis, Insights and Forecast, 2020-2032
- 6.1. Market Analysis, Insights and Forecast - by Application
- 6.1.1. Research and Development
- 6.1.2. Installation and Maintenance
- 6.1.3. Measurement Solutions
- 6.1.4. Safety and Monitoring Solutions
- 6.2. Market Analysis, Insights and Forecast - by Types
- 6.2.1. Certification Services
- 6.2.2. Inspection Services
- 6.2.3. Testing Services
- 6.1. Market Analysis, Insights and Forecast - by Application
- 7. South America Fiber Optic Testing Service Analysis, Insights and Forecast, 2020-2032
- 7.1. Market Analysis, Insights and Forecast - by Application
- 7.1.1. Research and Development
- 7.1.2. Installation and Maintenance
- 7.1.3. Measurement Solutions
- 7.1.4. Safety and Monitoring Solutions
- 7.2. Market Analysis, Insights and Forecast - by Types
- 7.2.1. Certification Services
- 7.2.2. Inspection Services
- 7.2.3. Testing Services
- 7.1. Market Analysis, Insights and Forecast - by Application
- 8. Europe Fiber Optic Testing Service Analysis, Insights and Forecast, 2020-2032
- 8.1. Market Analysis, Insights and Forecast - by Application
- 8.1.1. Research and Development
- 8.1.2. Installation and Maintenance
- 8.1.3. Measurement Solutions
- 8.1.4. Safety and Monitoring Solutions
- 8.2. Market Analysis, Insights and Forecast - by Types
- 8.2.1. Certification Services
- 8.2.2. Inspection Services
- 8.2.3. Testing Services
- 8.1. Market Analysis, Insights and Forecast - by Application
- 9. Middle East & Africa Fiber Optic Testing Service Analysis, Insights and Forecast, 2020-2032
- 9.1. Market Analysis, Insights and Forecast - by Application
- 9.1.1. Research and Development
- 9.1.2. Installation and Maintenance
- 9.1.3. Measurement Solutions
- 9.1.4. Safety and Monitoring Solutions
- 9.2. Market Analysis, Insights and Forecast - by Types
- 9.2.1. Certification Services
- 9.2.2. Inspection Services
- 9.2.3. Testing Services
- 9.1. Market Analysis, Insights and Forecast - by Application
- 10. Asia Pacific Fiber Optic Testing Service Analysis, Insights and Forecast, 2020-2032
- 10.1. Market Analysis, Insights and Forecast - by Application
- 10.1.1. Research and Development
- 10.1.2. Installation and Maintenance
- 10.1.3. Measurement Solutions
- 10.1.4. Safety and Monitoring Solutions
- 10.2. Market Analysis, Insights and Forecast - by Types
- 10.2.1. Certification Services
- 10.2.2. Inspection Services
- 10.2.3. Testing Services
- 10.1. Market Analysis, Insights and Forecast - by Application
- 11. Competitive Analysis
- 11.1. Global Market Share Analysis 2025
- 11.2. Company Profiles
- 11.2.1 Adtell Integration
- 11.2.1.1. Overview
- 11.2.1.2. Products
- 11.2.1.3. SWOT Analysis
- 11.2.1.4. Recent Developments
- 11.2.1.5. Financials (Based on Availability)
- 11.2.2 Al Dahiyah
- 11.2.2.1. Overview
- 11.2.2.2. Products
- 11.2.2.3. SWOT Analysis
- 11.2.2.4. Recent Developments
- 11.2.2.5. Financials (Based on Availability)
- 11.2.3 Al-Baud Technology
- 11.2.3.1. Overview
- 11.2.3.2. Products
- 11.2.3.3. SWOT Analysis
- 11.2.3.4. Recent Developments
- 11.2.3.5. Financials (Based on Availability)
- 11.2.4 Element Materials Technology
- 11.2.4.1. Overview
- 11.2.4.2. Products
- 11.2.4.3. SWOT Analysis
- 11.2.4.4. Recent Developments
- 11.2.4.5. Financials (Based on Availability)
- 11.2.5 Eurofins E&E North America
- 11.2.5.1. Overview
- 11.2.5.2. Products
- 11.2.5.3. SWOT Analysis
- 11.2.5.4. Recent Developments
- 11.2.5.5. Financials (Based on Availability)
- 11.2.6 EXFO
- 11.2.6.1. Overview
- 11.2.6.2. Products
- 11.2.6.3. SWOT Analysis
- 11.2.6.4. Recent Developments
- 11.2.6.5. Financials (Based on Availability)
- 11.2.7 Fibertechs
- 11.2.7.1. Overview
- 11.2.7.2. Products
- 11.2.7.3. SWOT Analysis
- 11.2.7.4. Recent Developments
- 11.2.7.5. Financials (Based on Availability)
- 11.2.8 Fluke
- 11.2.8.1. Overview
- 11.2.8.2. Products
- 11.2.8.3. SWOT Analysis
- 11.2.8.4. Recent Developments
- 11.2.8.5. Financials (Based on Availability)
- 11.2.9 Fujikura
- 11.2.9.1. Overview
- 11.2.9.2. Products
- 11.2.9.3. SWOT Analysis
- 11.2.9.4. Recent Developments
- 11.2.9.5. Financials (Based on Availability)
- 11.2.10 Global Emirates Cables & Systems Industries
- 11.2.10.1. Overview
- 11.2.10.2. Products
- 11.2.10.3. SWOT Analysis
- 11.2.10.4. Recent Developments
- 11.2.10.5. Financials (Based on Availability)
- 11.2.11 Intertek
- 11.2.11.1. Overview
- 11.2.11.2. Products
- 11.2.11.3. SWOT Analysis
- 11.2.11.4. Recent Developments
- 11.2.11.5. Financials (Based on Availability)
- 11.2.12 L3Harris Technologies
- 11.2.12.1. Overview
- 11.2.12.2. Products
- 11.2.12.3. SWOT Analysis
- 11.2.12.4. Recent Developments
- 11.2.12.5. Financials (Based on Availability)
- 11.2.13 Mercantile
- 11.2.13.1. Overview
- 11.2.13.2. Products
- 11.2.13.3. SWOT Analysis
- 11.2.13.4. Recent Developments
- 11.2.13.5. Financials (Based on Availability)
- 11.2.14 Middle East Fiber Cable Manufacturing
- 11.2.14.1. Overview
- 11.2.14.2. Products
- 11.2.14.3. SWOT Analysis
- 11.2.14.4. Recent Developments
- 11.2.14.5. Financials (Based on Availability)
- 11.2.15 National Technical Systems
- 11.2.15.1. Overview
- 11.2.15.2. Products
- 11.2.15.3. SWOT Analysis
- 11.2.15.4. Recent Developments
- 11.2.15.5. Financials (Based on Availability)
- 11.2.16 Nour Communications
- 11.2.16.1. Overview
- 11.2.16.2. Products
- 11.2.16.3. SWOT Analysis
- 11.2.16.4. Recent Developments
- 11.2.16.5. Financials (Based on Availability)
- 11.2.17 OPTOKON
- 11.2.17.1. Overview
- 11.2.17.2. Products
- 11.2.17.3. SWOT Analysis
- 11.2.17.4. Recent Developments
- 11.2.17.5. Financials (Based on Availability)
- 11.2.18 Tuv Rheinland
- 11.2.18.1. Overview
- 11.2.18.2. Products
- 11.2.18.3. SWOT Analysis
- 11.2.18.4. Recent Developments
- 11.2.18.5. Financials (Based on Availability)
- 11.2.19 Ul
- 11.2.19.1. Overview
- 11.2.19.2. Products
- 11.2.19.3. SWOT Analysis
- 11.2.19.4. Recent Developments
- 11.2.19.5. Financials (Based on Availability)
- 11.2.20 Viavi Solutions
- 11.2.20.1. Overview
- 11.2.20.2. Products
- 11.2.20.3. SWOT Analysis
- 11.2.20.4. Recent Developments
- 11.2.20.5. Financials (Based on Availability)
- 11.2.1 Adtell Integration
List of Figures
- Figure 1: Global Fiber Optic Testing Service Revenue Breakdown (million, %) by Region 2025 & 2033
- Figure 2: North America Fiber Optic Testing Service Revenue (million), by Application 2025 & 2033
- Figure 3: North America Fiber Optic Testing Service Revenue Share (%), by Application 2025 & 2033
- Figure 4: North America Fiber Optic Testing Service Revenue (million), by Types 2025 & 2033
- Figure 5: North America Fiber Optic Testing Service Revenue Share (%), by Types 2025 & 2033
- Figure 6: North America Fiber Optic Testing Service Revenue (million), by Country 2025 & 2033
- Figure 7: North America Fiber Optic Testing Service Revenue Share (%), by Country 2025 & 2033
- Figure 8: South America Fiber Optic Testing Service Revenue (million), by Application 2025 & 2033
- Figure 9: South America Fiber Optic Testing Service Revenue Share (%), by Application 2025 & 2033
- Figure 10: South America Fiber Optic Testing Service Revenue (million), by Types 2025 & 2033
- Figure 11: South America Fiber Optic Testing Service Revenue Share (%), by Types 2025 & 2033
- Figure 12: South America Fiber Optic Testing Service Revenue (million), by Country 2025 & 2033
- Figure 13: South America Fiber Optic Testing Service Revenue Share (%), by Country 2025 & 2033
- Figure 14: Europe Fiber Optic Testing Service Revenue (million), by Application 2025 & 2033
- Figure 15: Europe Fiber Optic Testing Service Revenue Share (%), by Application 2025 & 2033
- Figure 16: Europe Fiber Optic Testing Service Revenue (million), by Types 2025 & 2033
- Figure 17: Europe Fiber Optic Testing Service Revenue Share (%), by Types 2025 & 2033
- Figure 18: Europe Fiber Optic Testing Service Revenue (million), by Country 2025 & 2033
- Figure 19: Europe Fiber Optic Testing Service Revenue Share (%), by Country 2025 & 2033
- Figure 20: Middle East & Africa Fiber Optic Testing Service Revenue (million), by Application 2025 & 2033
- Figure 21: Middle East & Africa Fiber Optic Testing Service Revenue Share (%), by Application 2025 & 2033
- Figure 22: Middle East & Africa Fiber Optic Testing Service Revenue (million), by Types 2025 & 2033
- Figure 23: Middle East & Africa Fiber Optic Testing Service Revenue Share (%), by Types 2025 & 2033
- Figure 24: Middle East & Africa Fiber Optic Testing Service Revenue (million), by Country 2025 & 2033
- Figure 25: Middle East & Africa Fiber Optic Testing Service Revenue Share (%), by Country 2025 & 2033
- Figure 26: Asia Pacific Fiber Optic Testing Service Revenue (million), by Application 2025 & 2033
- Figure 27: Asia Pacific Fiber Optic Testing Service Revenue Share (%), by Application 2025 & 2033
- Figure 28: Asia Pacific Fiber Optic Testing Service Revenue (million), by Types 2025 & 2033
- Figure 29: Asia Pacific Fiber Optic Testing Service Revenue Share (%), by Types 2025 & 2033
- Figure 30: Asia Pacific Fiber Optic Testing Service Revenue (million), by Country 2025 & 2033
- Figure 31: Asia Pacific Fiber Optic Testing Service Revenue Share (%), by Country 2025 & 2033
List of Tables
- Table 1: Global Fiber Optic Testing Service Revenue million Forecast, by Application 2020 & 2033
- Table 2: Global Fiber Optic Testing Service Revenue million Forecast, by Types 2020 & 2033
- Table 3: Global Fiber Optic Testing Service Revenue million Forecast, by Region 2020 & 2033
- Table 4: Global Fiber Optic Testing Service Revenue million Forecast, by Application 2020 & 2033
- Table 5: Global Fiber Optic Testing Service Revenue million Forecast, by Types 2020 & 2033
- Table 6: Global Fiber Optic Testing Service Revenue million Forecast, by Country 2020 & 2033
- Table 7: United States Fiber Optic Testing Service Revenue (million) Forecast, by Application 2020 & 2033
- Table 8: Canada Fiber Optic Testing Service Revenue (million) Forecast, by Application 2020 & 2033
- Table 9: Mexico Fiber Optic Testing Service Revenue (million) Forecast, by Application 2020 & 2033
- Table 10: Global Fiber Optic Testing Service Revenue million Forecast, by Application 2020 & 2033
- Table 11: Global Fiber Optic Testing Service Revenue million Forecast, by Types 2020 & 2033
- Table 12: Global Fiber Optic Testing Service Revenue million Forecast, by Country 2020 & 2033
- Table 13: Brazil Fiber Optic Testing Service Revenue (million) Forecast, by Application 2020 & 2033
- Table 14: Argentina Fiber Optic Testing Service Revenue (million) Forecast, by Application 2020 & 2033
- Table 15: Rest of South America Fiber Optic Testing Service Revenue (million) Forecast, by Application 2020 & 2033
- Table 16: Global Fiber Optic Testing Service Revenue million Forecast, by Application 2020 & 2033
- Table 17: Global Fiber Optic Testing Service Revenue million Forecast, by Types 2020 & 2033
- Table 18: Global Fiber Optic Testing Service Revenue million Forecast, by Country 2020 & 2033
- Table 19: United Kingdom Fiber Optic Testing Service Revenue (million) Forecast, by Application 2020 & 2033
- Table 20: Germany Fiber Optic Testing Service Revenue (million) Forecast, by Application 2020 & 2033
- Table 21: France Fiber Optic Testing Service Revenue (million) Forecast, by Application 2020 & 2033
- Table 22: Italy Fiber Optic Testing Service Revenue (million) Forecast, by Application 2020 & 2033
- Table 23: Spain Fiber Optic Testing Service Revenue (million) Forecast, by Application 2020 & 2033
- Table 24: Russia Fiber Optic Testing Service Revenue (million) Forecast, by Application 2020 & 2033
- Table 25: Benelux Fiber Optic Testing Service Revenue (million) Forecast, by Application 2020 & 2033
- Table 26: Nordics Fiber Optic Testing Service Revenue (million) Forecast, by Application 2020 & 2033
- Table 27: Rest of Europe Fiber Optic Testing Service Revenue (million) Forecast, by Application 2020 & 2033
- Table 28: Global Fiber Optic Testing Service Revenue million Forecast, by Application 2020 & 2033
- Table 29: Global Fiber Optic Testing Service Revenue million Forecast, by Types 2020 & 2033
- Table 30: Global Fiber Optic Testing Service Revenue million Forecast, by Country 2020 & 2033
- Table 31: Turkey Fiber Optic Testing Service Revenue (million) Forecast, by Application 2020 & 2033
- Table 32: Israel Fiber Optic Testing Service Revenue (million) Forecast, by Application 2020 & 2033
- Table 33: GCC Fiber Optic Testing Service Revenue (million) Forecast, by Application 2020 & 2033
- Table 34: North Africa Fiber Optic Testing Service Revenue (million) Forecast, by Application 2020 & 2033
- Table 35: South Africa Fiber Optic Testing Service Revenue (million) Forecast, by Application 2020 & 2033
- Table 36: Rest of Middle East & Africa Fiber Optic Testing Service Revenue (million) Forecast, by Application 2020 & 2033
- Table 37: Global Fiber Optic Testing Service Revenue million Forecast, by Application 2020 & 2033
- Table 38: Global Fiber Optic Testing Service Revenue million Forecast, by Types 2020 & 2033
- Table 39: Global Fiber Optic Testing Service Revenue million Forecast, by Country 2020 & 2033
- Table 40: China Fiber Optic Testing Service Revenue (million) Forecast, by Application 2020 & 2033
- Table 41: India Fiber Optic Testing Service Revenue (million) Forecast, by Application 2020 & 2033
- Table 42: Japan Fiber Optic Testing Service Revenue (million) Forecast, by Application 2020 & 2033
- Table 43: South Korea Fiber Optic Testing Service Revenue (million) Forecast, by Application 2020 & 2033
- Table 44: ASEAN Fiber Optic Testing Service Revenue (million) Forecast, by Application 2020 & 2033
- Table 45: Oceania Fiber Optic Testing Service Revenue (million) Forecast, by Application 2020 & 2033
- Table 46: Rest of Asia Pacific Fiber Optic Testing Service Revenue (million) Forecast, by Application 2020 & 2033
Frequently Asked Questions
1. What is the projected Compound Annual Growth Rate (CAGR) of the Fiber Optic Testing Service?
The projected CAGR is approximately XX%.
2. Which companies are prominent players in the Fiber Optic Testing Service?
Key companies in the market include Adtell Integration, Al Dahiyah, Al-Baud Technology, Element Materials Technology, Eurofins E&E North America, EXFO, Fibertechs, Fluke, Fujikura, Global Emirates Cables & Systems Industries, Intertek, L3Harris Technologies, Mercantile, Middle East Fiber Cable Manufacturing, National Technical Systems, Nour Communications, OPTOKON, Tuv Rheinland, Ul, Viavi Solutions.
3. What are the main segments of the Fiber Optic Testing Service?
The market segments include Application, Types.
4. Can you provide details about the market size?
The market size is estimated to be USD XXX million as of 2022.
5. What are some drivers contributing to market growth?
N/A
6. What are the notable trends driving market growth?
N/A
7. Are there any restraints impacting market growth?
N/A
8. Can you provide examples of recent developments in the market?
N/A
9. What pricing options are available for accessing the report?
Pricing options include single-user, multi-user, and enterprise licenses priced at USD 3350.00, USD 5025.00, and USD 6700.00 respectively.
10. Is the market size provided in terms of value or volume?
The market size is provided in terms of value, measured in million.
11. Are there any specific market keywords associated with the report?
Yes, the market keyword associated with the report is "Fiber Optic Testing Service," which aids in identifying and referencing the specific market segment covered.
12. How do I determine which pricing option suits my needs best?
The pricing options vary based on user requirements and access needs. Individual users may opt for single-user licenses, while businesses requiring broader access may choose multi-user or enterprise licenses for cost-effective access to the report.
13. Are there any additional resources or data provided in the Fiber Optic Testing Service report?
While the report offers comprehensive insights, it's advisable to review the specific contents or supplementary materials provided to ascertain if additional resources or data are available.
14. How can I stay updated on further developments or reports in the Fiber Optic Testing Service?
To stay informed about further developments, trends, and reports in the Fiber Optic Testing Service, consider subscribing to industry newsletters, following relevant companies and organizations, or regularly checking reputable industry news sources and publications.
Methodology
Step 1 - Identification of Relevant Samples Size from Population Database


Step 2 - Approaches for Defining Global Market Size (Value, Volume* & Price*)

Note*: In applicable scenarios
Step 3 - Data Sources
Primary Research
- Web Analytics
- Survey Reports
- Research Institute
- Latest Research Reports
- Opinion Leaders
Secondary Research
- Annual Reports
- White Paper
- Latest Press Release
- Industry Association
- Paid Database
- Investor Presentations

Step 4 - Data Triangulation
Involves using different sources of information in order to increase the validity of a study
These sources are likely to be stakeholders in a program - participants, other researchers, program staff, other community members, and so on.
Then we put all data in single framework & apply various statistical tools to find out the dynamic on the market.
During the analysis stage, feedback from the stakeholder groups would be compared to determine areas of agreement as well as areas of divergence