

Key Insights
The Full HD TV market is poised for significant growth, projected to reach a substantial USD 63.89 billion by 2025. This expansion is underpinned by a healthy CAGR of 4.9%, indicating a robust and sustained upward trajectory for the sector over the forecast period of 2025-2033. The market's resilience and ongoing demand are driven by several key factors. A primary driver is the continued consumer preference for accessible, high-quality viewing experiences. While 4K and 8K technologies are gaining traction, Full HD televisions offer a compelling balance of performance and affordability, making them a popular choice for a wide demographic, particularly in emerging economies and for secondary display needs within households. The increasing penetration of smart TV features in Full HD models further bolsters their appeal, offering enhanced connectivity and entertainment options. Moreover, advancements in display technology, leading to improved picture quality and energy efficiency in Full HD sets, contribute to their sustained relevance. The market is also benefiting from strong growth in the entertainment sector, with an increasing demand for home viewing solutions for gaming, streaming services, and digital content consumption.
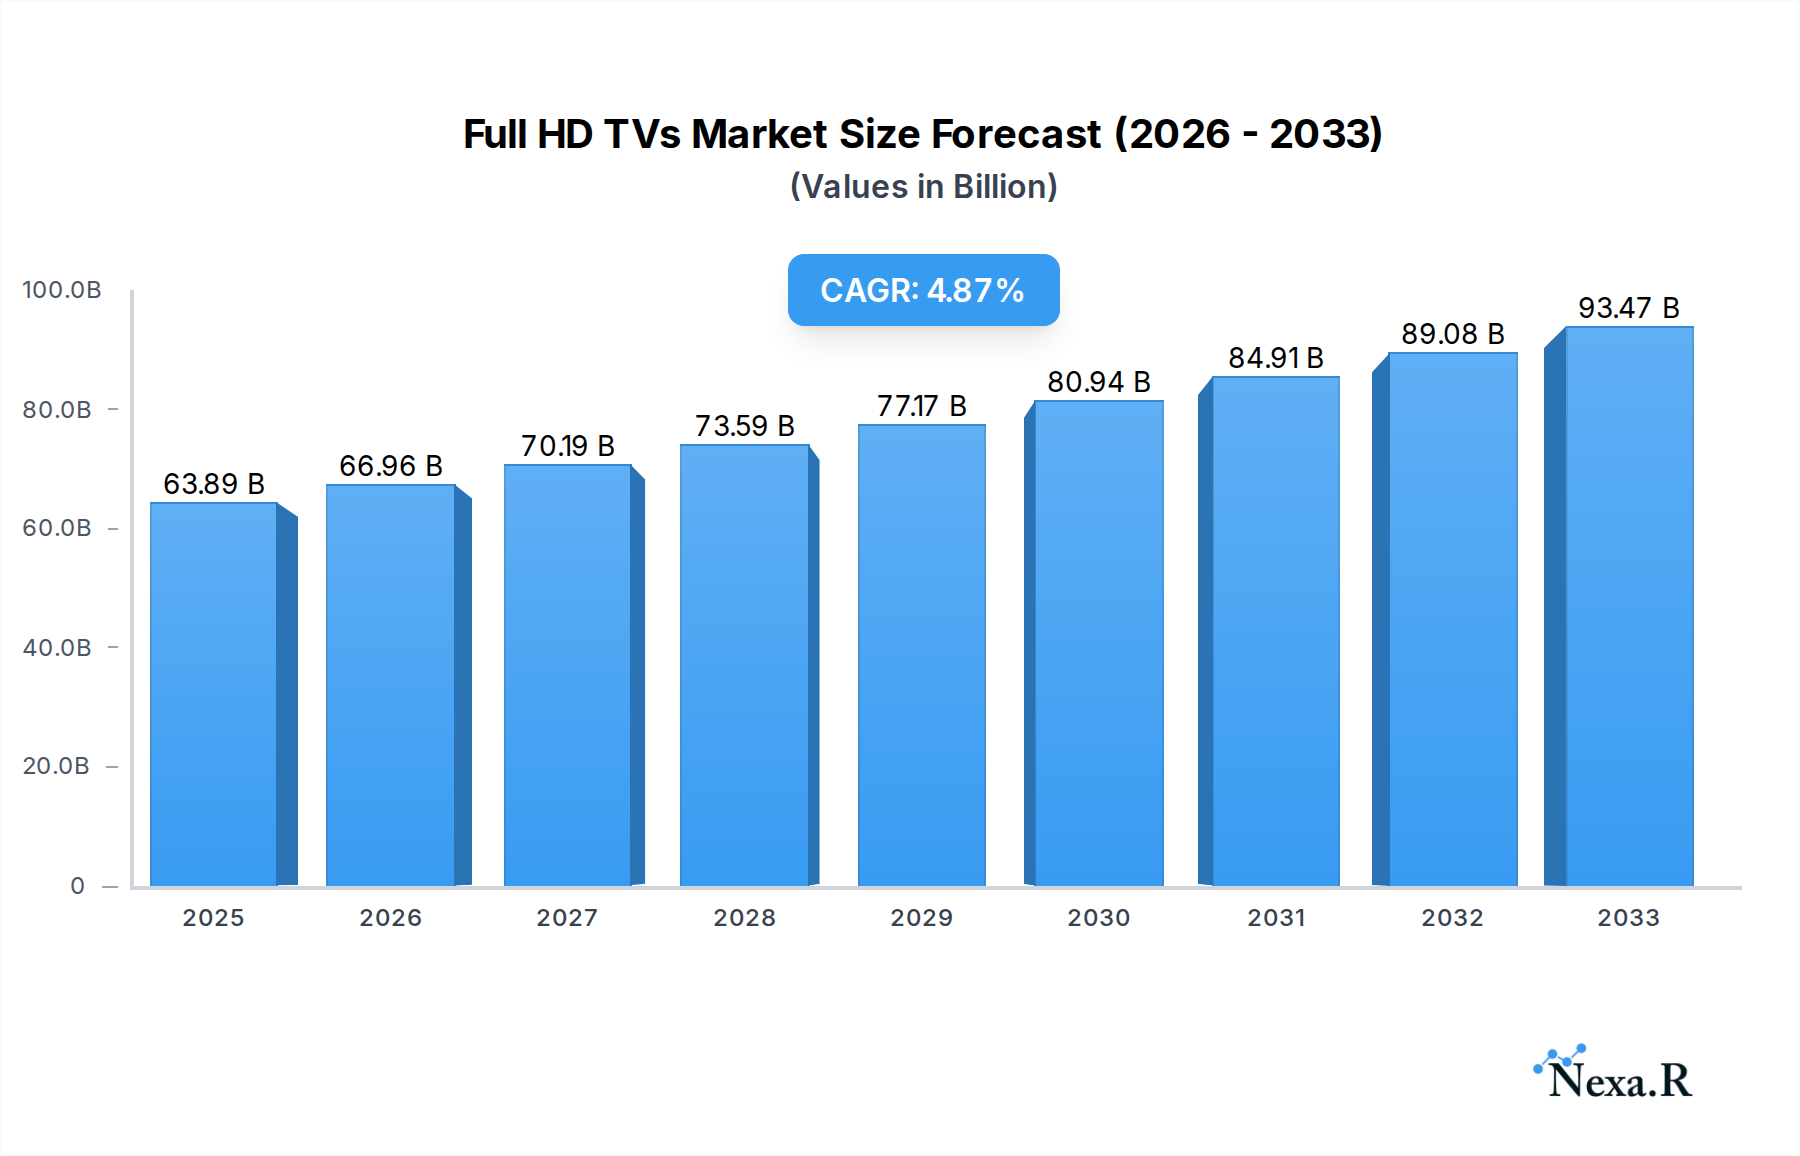
Full HD TVs Market Size (In Billion)
The market segmentation further highlights opportunities. In terms of application, both Family and Public segments are expected to contribute to market expansion, reflecting the versatility of Full HD TVs from personal entertainment hubs to commercial displays in retail, hospitality, and educational institutions. Within types, 55-inch and 65-inch displays are anticipated to dominate sales, catering to the prevailing consumer desire for larger screen sizes that enhance immersive viewing experiences. The presence of numerous established and emerging players, including giants like Samsung, LG, SONY, TCL, and Hisense, indicates a competitive yet dynamic landscape, fostering innovation and driving value for consumers. Geographically, the Asia Pacific region, particularly China and India, is expected to be a major growth engine, owing to a burgeoning middle class and increasing disposable incomes. North America and Europe will continue to be significant markets, driven by technology adoption and replacement cycles. While the increasing prevalence of higher resolution technologies presents a competitive challenge, the inherent cost-effectiveness and widespread availability of Full HD content ensure its continued relevance and market share.

Full HD TVs Company Market Share
Comprehensive Full HD TV Market Analysis: Size, Trends, and Future Outlook (2019-2033)
This in-depth report provides a critical examination of the Full HD TV market, offering actionable insights for industry professionals. Spanning the historical period of 2019–2024 and projecting through the forecast period of 2025–2033, with a base and estimated year of 2025, this analysis delves into market dynamics, growth drivers, regional dominance, product innovation, and key player strategies. We meticulously analyze the parent market of consumer electronics and the child market of display technologies, providing a holistic view of the Full HD TV landscape. Quantifiable data, including market share in billion units, CAGR, and adoption rates, are presented alongside qualitative assessments of competitive landscapes and emerging opportunities.
Full HD TVs Market Dynamics & Structure
The Full HD TV market exhibits a moderately concentrated structure, with dominant players like Samsung and LG holding significant market share. Technological innovation remains a primary driver, with advancements in display refresh rates, HDR compatibility, and smart TV functionalities continuously shaping consumer demand. Regulatory frameworks, particularly those concerning energy efficiency and content accessibility, play a crucial role in product development and market entry. Competitive product substitutes, including 4K and 8K TVs, present a constant challenge, forcing Full HD TV manufacturers to innovate in terms of price-performance ratios and specialized niche applications. End-user demographics are shifting, with a growing demand for larger screen sizes and integrated smart features, particularly within the Family application segment. Mergers and acquisitions (M&A) trends are observed, though often focused on component suppliers or regional distribution networks rather than outright consolidation of major TV brands. For instance, historical data indicates approximately 5-7 significant M&A deals annually within the broader display technology sector, impacting component availability and pricing.
- Market Concentration: Top 5 players account for an estimated 70-75% of the global Full HD TV market share.
- Technological Innovation Drivers: Enhanced refresh rates (e.g., 120Hz), improved color accuracy, and wider HDR support for budget-friendly models.
- Regulatory Frameworks: Energy Star certifications and broadcast standard compliance influencing product designs.
- Competitive Product Substitutes: The increasing affordability of 4K TVs is a significant competitive pressure.
- End-User Demographics: Growing demand for larger screen sizes (55 Inch and 65 Inch) in residential settings.
- M&A Trends: Acquisitions of display panel manufacturers and smart TV software developers to enhance integration.
Full HD TVs Growth Trends & Insights
The Full HD TV market is undergoing a nuanced evolution, characterized by sustained demand in emerging economies and a strategic repositioning in mature markets. While the overall market size is projected to witness a modest CAGR of approximately 2.5% between 2025 and 2033, its penetration remains robust, particularly within the Family application segment. The global market size for Full HD TVs was estimated at $35.8 billion units in 2025 and is projected to reach $41.5 billion units by 2033. Adoption rates are particularly high in developing regions where cost-effectiveness remains a paramount consideration for a significant portion of the population. However, technological disruptions, predominantly the increasing accessibility of 4K and even 8K televisions, have prompted a strategic shift. Manufacturers are focusing on optimizing Full HD models for specific use cases and price points, emphasizing improved smart TV capabilities, energy efficiency, and enhanced viewing experiences within their target demographic. Consumer behavior shifts are evident, with a growing appreciation for value-for-money propositions. While early adopters and tech enthusiasts may gravitate towards higher resolutions, a vast segment of the market continues to find Full HD resolution to be perfectly adequate for their entertainment needs, especially when paired with compelling features and attractive price tags. The market penetration of Full HD TVs within households globally stood at an estimated 78% in 2025, a figure expected to remain strong due to its affordability and widespread availability. This persistent demand underscores the enduring relevance of Full HD technology in bridging the gap between basic television viewing and the premium experience offered by higher resolutions. The report anticipates that the market share of Full HD TVs, while facing competition, will remain substantial, estimated at around 30-35% of the total television market by 2033, largely driven by economic factors and the vast installed base.
Dominant Regions, Countries, or Segments in Full HD TVs
The Family application segment, particularly within the 55 Inch and 65 Inch types, is emerging as the dominant driver of growth for Full HD TVs. This dominance is most pronounced in Asia-Pacific and Latin America, where economic development, a burgeoning middle class, and a strong preference for large-screen entertainment at affordable price points fuel consistent demand. In these regions, Full HD TVs represent a crucial entry point into advanced home entertainment systems. China stands out as a leading country, not only as a massive consumer market but also as a production hub, significantly influencing global pricing and availability.
- Dominant Segment (Application): Family, characterized by increased home entertainment consumption and a need for cost-effective large screens.
- Dominant Segment (Type): 55 Inch and 65 Inch models, offering an optimal balance between immersive viewing and affordability for residential use.
- Leading Region: Asia-Pacific, driven by high population density, increasing disposable incomes, and a strong manufacturing base.
- Key Country: China, as both a major producer and consumer, heavily influences global market dynamics and pricing strategies.
- Market Share within Dominant Segments: The Family application segment is estimated to capture 65-70% of the total Full HD TV market. Within this, 55-inch and 65-inch models together are projected to constitute 60-65% of all Full HD TV sales.
- Growth Potential: Emerging economies within Asia-Pacific and Latin America are expected to exhibit higher growth rates in Full HD TV adoption compared to mature markets.
Full HD TVs Product Landscape
The Full HD TV product landscape is characterized by a focus on delivering compelling value through enhanced features and optimized performance within the 1920x1080 resolution standard. Manufacturers are differentiating their offerings through superior image processing, advanced color reproduction technologies like Triluminos (Sony) and Quantum Dot (Samsung) adapted for Full HD, and improved refresh rates for smoother motion. Smart TV platforms are a key area of innovation, offering seamless access to streaming services, apps, and voice control functionalities. Connectivity options, including multiple HDMI ports and Wi-Fi capabilities, are standard. Unique selling propositions often revolve around specific audio enhancements and energy-efficient designs, catering to budget-conscious consumers seeking a comprehensive entertainment solution.
Key Drivers, Barriers & Challenges in Full HD TVs
The Full HD TV market is propelled by several key drivers. The affordability and cost-effectiveness of Full HD TVs remain their primary advantage, making them accessible to a broad consumer base. The robust existing infrastructure for Full HD content, including broadcast channels and streaming libraries, ensures continued relevance. Technological advancements in panel efficiency and manufacturing processes also contribute to lower production costs, enabling competitive pricing.
- Key Drivers:
- Cost-Effectiveness: Significantly lower price point compared to 4K/8K TVs.
- Content Availability: Widespread availability of Full HD content across broadcast and streaming platforms.
- Energy Efficiency: Continued improvements in energy-saving technologies appeal to environmentally conscious consumers.
- Large Screen Accessibility: Enables larger screen sizes within budget constraints for consumers.
Key challenges and restraints include intense competition from 4K and 8K TVs, which are steadily declining in price, and the perceived obsolescence of Full HD technology by some consumer segments. Supply chain disruptions, though less impactful than for higher-end components, can still affect pricing and availability. Regulatory hurdles related to evolving broadcasting standards or mandatory smart TV features can also pose challenges. The cost of raw materials for panel production remains a constant factor influencing profitability.
- Key Barriers & Challenges:
- Price Erosion of Higher Resolutions: Continuous price drops in 4K and 8K TVs.
- Technological Obsolescence Perception: Consumer belief that Full HD is outdated.
- Supply Chain Volatility: Fluctuations in component costs and availability impacting production.
- Market Saturation in Developed Regions: Limited growth potential in regions with high existing adoption rates.
Emerging Opportunities in Full HD TVs
Emerging opportunities in the Full HD TV market lie in catering to specific niche applications and value-conscious emerging markets. The "Public" application segment, encompassing hospitality, education, and retail displays, presents a significant untapped potential for reliable and cost-effective Full HD solutions. Furthermore, the development of smart Full HD TVs with enhanced gaming features or tailored streaming interfaces can attract segments of the market seeking specific functionalities without the premium cost of higher resolution. The increasing demand for energy-efficient home appliances also opens doors for Full HD TVs that excel in this area.
Growth Accelerators in the Full HD TVs Industry
Growth in the Full HD TV industry is being accelerated by strategic market expansion into developing economies where affordability is a primary purchasing driver. Manufacturers are also focusing on strategic partnerships with content providers to ensure exclusive bundles or optimized viewing experiences for Full HD content. Technological breakthroughs in panel manufacturing that further reduce production costs are crucial. Additionally, the integration of more advanced smart TV operating systems and AI-powered features within Full HD models can enhance their appeal and extend their market lifespan, driving adoption rates even as higher resolutions become more mainstream.
Key Players Shaping the Full HD TVs Market
- Samsung
- LG
- SONY
- Sharp
- Panasonic
- Toshiba
- Seiki (Tongfang)
- Hisense
- Skyworth
- Changhong
- TCL
- Konka
- Philips(Suning)
- Haier
Notable Milestones in Full HD TVs Sector
- 2019: Widespread adoption of HDR support in mid-range Full HD TVs, enhancing visual quality.
- 2020: Increased focus on energy efficiency ratings and sustainable manufacturing processes.
- 2021: Introduction of more advanced AI-powered picture and sound processing in budget Full HD models.
- 2022: Significant price reductions in 4K TVs begin to exert more pressure on Full HD market share.
- 2023: Manufacturers start to emphasize smart TV capabilities and app integration as key selling points for Full HD TVs.
- 2024: Growing interest in larger screen sizes (65 Inch and above) for Full HD TVs in emerging markets.
In-Depth Full HD TVs Market Outlook
The future market outlook for Full HD TVs remains one of sustained relevance, particularly driven by their inherent affordability and the continuous expansion of accessible content. Growth accelerators include further technological innovations in display efficiency, leading to even more competitive pricing, and the strategic targeting of burgeoning markets in developing nations. The increasing integration of sophisticated smart TV functionalities and AI-driven user experiences will also be pivotal in maintaining their appeal. As the market matures, strategic partnerships with streaming platforms and a continued emphasis on value-for-money propositions will ensure that Full HD TVs remain a significant segment of the global display industry, offering a compelling entry point into home entertainment for billions of consumers worldwide.
Full HD TVs Segmentation
-
1. Application
- 1.1. Family
- 1.2. Public
-
2. Types
- 2.1. 55 Inch
- 2.2. 65 Inch
- 2.3. Others
Full HD TVs Segmentation By Geography
-
1. North America
- 1.1. United States
- 1.2. Canada
- 1.3. Mexico
-
2. South America
- 2.1. Brazil
- 2.2. Argentina
- 2.3. Rest of South America
-
3. Europe
- 3.1. United Kingdom
- 3.2. Germany
- 3.3. France
- 3.4. Italy
- 3.5. Spain
- 3.6. Russia
- 3.7. Benelux
- 3.8. Nordics
- 3.9. Rest of Europe
-
4. Middle East & Africa
- 4.1. Turkey
- 4.2. Israel
- 4.3. GCC
- 4.4. North Africa
- 4.5. South Africa
- 4.6. Rest of Middle East & Africa
-
5. Asia Pacific
- 5.1. China
- 5.2. India
- 5.3. Japan
- 5.4. South Korea
- 5.5. ASEAN
- 5.6. Oceania
- 5.7. Rest of Asia Pacific
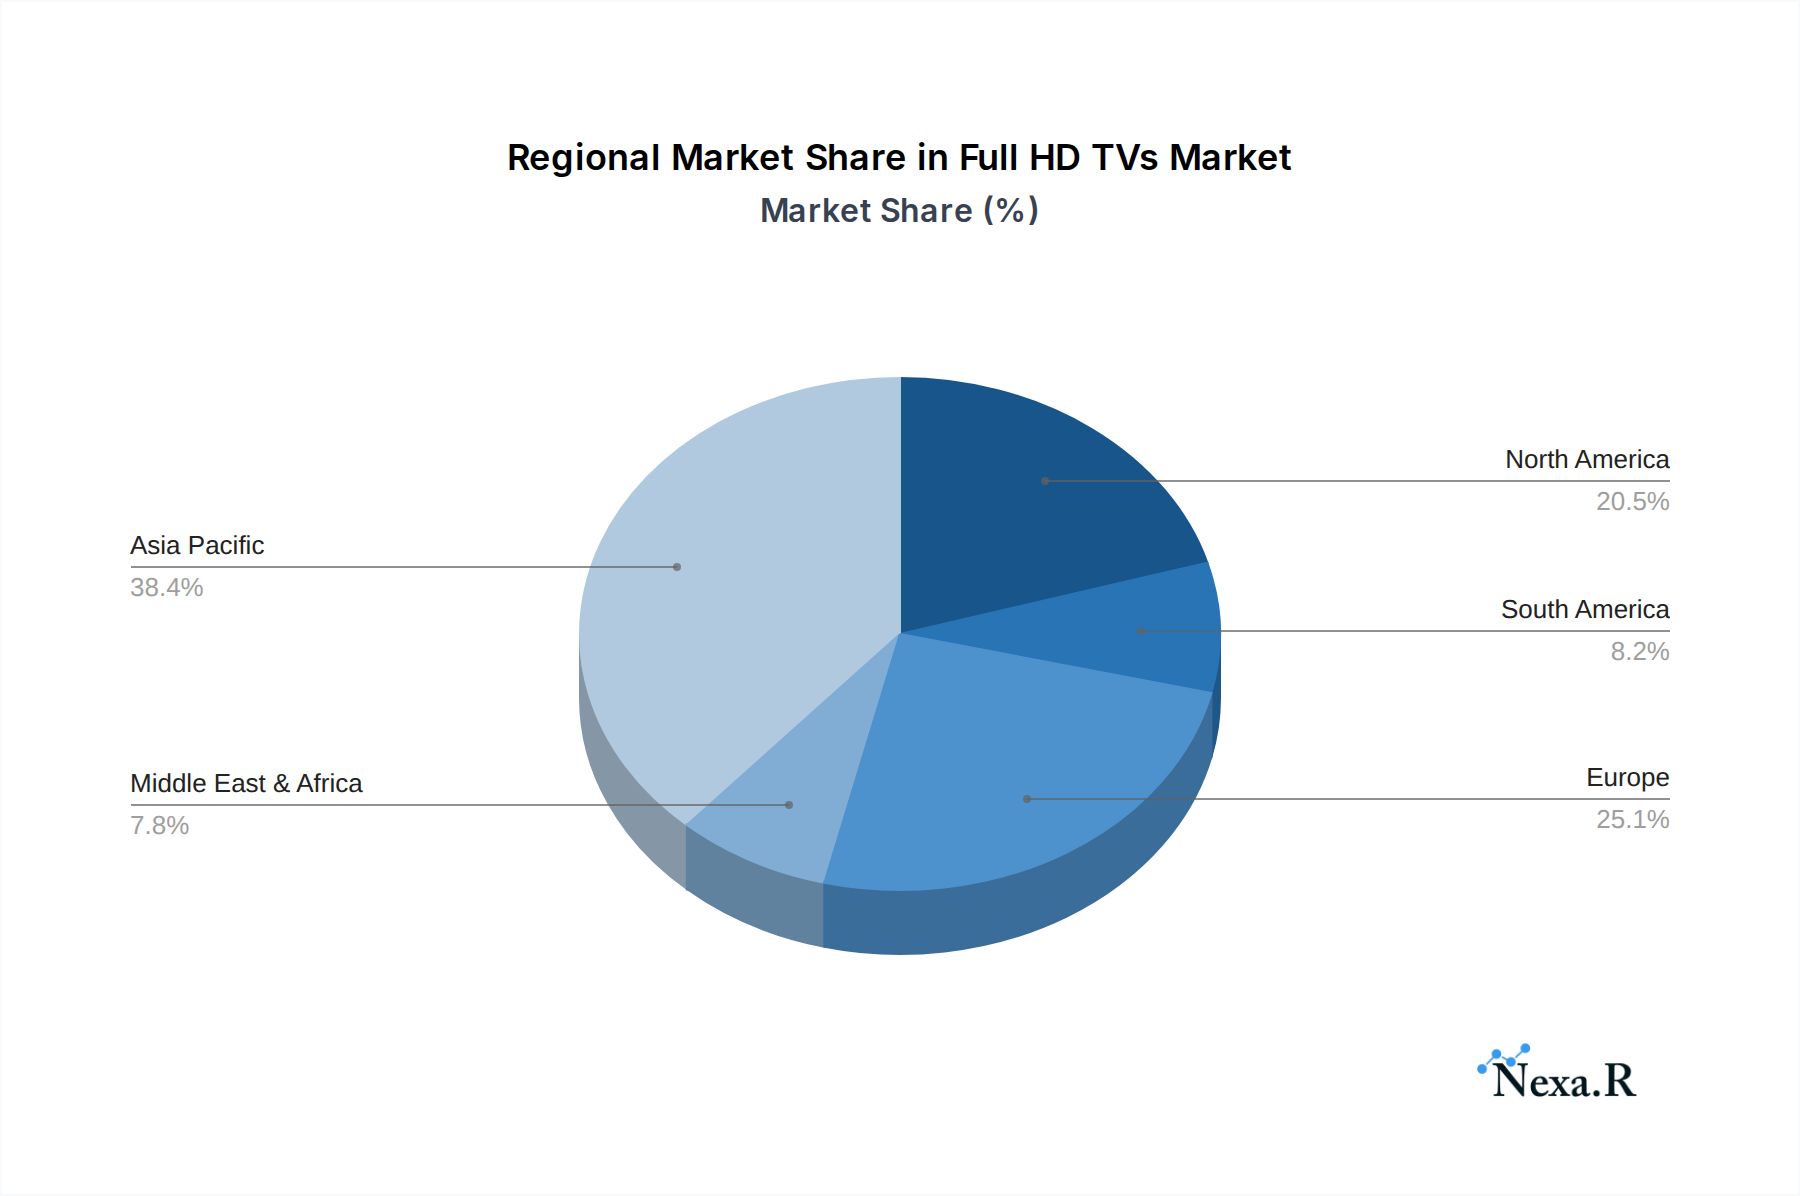
Full HD TVs Regional Market Share
Geographic Coverage of Full HD TVs
Full HD TVs REPORT HIGHLIGHTS
| Aspects | Details |
|---|---|
| Study Period | 2020-2034 |
| Base Year | 2025 |
| Estimated Year | 2026 |
| Forecast Period | 2026-2034 |
| Historical Period | 2020-2025 |
| Growth Rate | CAGR of 4.9% from 2020-2034 |
| Segmentation |
|
Table of Contents
- 1. Introduction
- 1.1. Research Scope
- 1.2. Market Segmentation
- 1.3. Research Objective
- 1.4. Definitions and Assumptions
- 2. Executive Summary
- 2.1. Market Snapshot
- 3. Market Dynamics
- 3.1. Market Drivers
- 3.2. Market Restrains
- 3.3. Market Trends
- 3.4. Market Opportunities
- 4. Market Factor Analysis
- 4.1. Porters Five Forces
- 4.1.1. Bargaining Power of Suppliers
- 4.1.2. Bargaining Power of Buyers
- 4.1.3. Threat of New Entrants
- 4.1.4. Threat of Substitutes
- 4.1.5. Competitive Rivalry
- 4.2. PESTEL analysis
- 4.3. BCG Analysis
- 4.3.1. Stars (High Growth, High Market Share)
- 4.3.2. Cash Cows (Low Growth, High Market Share)
- 4.3.3. Question Mark (High Growth, Low Market Share)
- 4.3.4. Dogs (Low Growth, Low Market Share)
- 4.4. Ansoff Matrix Analysis
- 4.5. Supply Chain Analysis
- 4.6. Regulatory Landscape
- 4.7. Current Market Potential and Opportunity Assessment (TAM–SAM–SOM Framework)
- 4.8. NRP Analyst Note
- 4.1. Porters Five Forces
- 5. Market Analysis, Insights and Forecast 2021-2033
- 5.1. Market Analysis, Insights and Forecast - by Application
- 5.1.1. Family
- 5.1.2. Public
- 5.2. Market Analysis, Insights and Forecast - by Types
- 5.2.1. 55 Inch
- 5.2.2. 65 Inch
- 5.2.3. Others
- 5.3. Market Analysis, Insights and Forecast - by Region
- 5.3.1. North America
- 5.3.2. South America
- 5.3.3. Europe
- 5.3.4. Middle East & Africa
- 5.3.5. Asia Pacific
- 5.1. Market Analysis, Insights and Forecast - by Application
- 6. Global Full HD TVs Analysis, Insights and Forecast, 2021-2033
- 6.1. Market Analysis, Insights and Forecast - by Application
- 6.1.1. Family
- 6.1.2. Public
- 6.2. Market Analysis, Insights and Forecast - by Types
- 6.2.1. 55 Inch
- 6.2.2. 65 Inch
- 6.2.3. Others
- 6.1. Market Analysis, Insights and Forecast - by Application
- 7. North America Full HD TVs Analysis, Insights and Forecast, 2020-2032
- 7.1. Market Analysis, Insights and Forecast - by Application
- 7.1.1. Family
- 7.1.2. Public
- 7.2. Market Analysis, Insights and Forecast - by Types
- 7.2.1. 55 Inch
- 7.2.2. 65 Inch
- 7.2.3. Others
- 7.1. Market Analysis, Insights and Forecast - by Application
- 8. South America Full HD TVs Analysis, Insights and Forecast, 2020-2032
- 8.1. Market Analysis, Insights and Forecast - by Application
- 8.1.1. Family
- 8.1.2. Public
- 8.2. Market Analysis, Insights and Forecast - by Types
- 8.2.1. 55 Inch
- 8.2.2. 65 Inch
- 8.2.3. Others
- 8.1. Market Analysis, Insights and Forecast - by Application
- 9. Europe Full HD TVs Analysis, Insights and Forecast, 2020-2032
- 9.1. Market Analysis, Insights and Forecast - by Application
- 9.1.1. Family
- 9.1.2. Public
- 9.2. Market Analysis, Insights and Forecast - by Types
- 9.2.1. 55 Inch
- 9.2.2. 65 Inch
- 9.2.3. Others
- 9.1. Market Analysis, Insights and Forecast - by Application
- 10. Middle East & Africa Full HD TVs Analysis, Insights and Forecast, 2020-2032
- 10.1. Market Analysis, Insights and Forecast - by Application
- 10.1.1. Family
- 10.1.2. Public
- 10.2. Market Analysis, Insights and Forecast - by Types
- 10.2.1. 55 Inch
- 10.2.2. 65 Inch
- 10.2.3. Others
- 10.1. Market Analysis, Insights and Forecast - by Application
- 11. Asia Pacific Full HD TVs Analysis, Insights and Forecast, 2020-2032
- 11.1. Market Analysis, Insights and Forecast - by Application
- 11.1.1. Family
- 11.1.2. Public
- 11.2. Market Analysis, Insights and Forecast - by Types
- 11.2.1. 55 Inch
- 11.2.2. 65 Inch
- 11.2.3. Others
- 11.1. Market Analysis, Insights and Forecast - by Application
- 12. Competitive Analysis
- 12.1. Company Profiles
- 12.1.1 Samsung
- 12.1.1.1. Company Overview
- 12.1.1.2. Products
- 12.1.1.3. Company Financials
- 12.1.1.4. SWOT Analysis
- 12.1.2 LG
- 12.1.2.1. Company Overview
- 12.1.2.2. Products
- 12.1.2.3. Company Financials
- 12.1.2.4. SWOT Analysis
- 12.1.3 SONY
- 12.1.3.1. Company Overview
- 12.1.3.2. Products
- 12.1.3.3. Company Financials
- 12.1.3.4. SWOT Analysis
- 12.1.4 Sharp
- 12.1.4.1. Company Overview
- 12.1.4.2. Products
- 12.1.4.3. Company Financials
- 12.1.4.4. SWOT Analysis
- 12.1.5 Panasonic
- 12.1.5.1. Company Overview
- 12.1.5.2. Products
- 12.1.5.3. Company Financials
- 12.1.5.4. SWOT Analysis
- 12.1.6 Toshiba
- 12.1.6.1. Company Overview
- 12.1.6.2. Products
- 12.1.6.3. Company Financials
- 12.1.6.4. SWOT Analysis
- 12.1.7 Seiki (Tongfang)
- 12.1.7.1. Company Overview
- 12.1.7.2. Products
- 12.1.7.3. Company Financials
- 12.1.7.4. SWOT Analysis
- 12.1.8 Hisense
- 12.1.8.1. Company Overview
- 12.1.8.2. Products
- 12.1.8.3. Company Financials
- 12.1.8.4. SWOT Analysis
- 12.1.9 Skyworth
- 12.1.9.1. Company Overview
- 12.1.9.2. Products
- 12.1.9.3. Company Financials
- 12.1.9.4. SWOT Analysis
- 12.1.10 Changhong
- 12.1.10.1. Company Overview
- 12.1.10.2. Products
- 12.1.10.3. Company Financials
- 12.1.10.4. SWOT Analysis
- 12.1.11 TCL
- 12.1.11.1. Company Overview
- 12.1.11.2. Products
- 12.1.11.3. Company Financials
- 12.1.11.4. SWOT Analysis
- 12.1.12 Konka
- 12.1.12.1. Company Overview
- 12.1.12.2. Products
- 12.1.12.3. Company Financials
- 12.1.12.4. SWOT Analysis
- 12.1.13 Philips(Suning)
- 12.1.13.1. Company Overview
- 12.1.13.2. Products
- 12.1.13.3. Company Financials
- 12.1.13.4. SWOT Analysis
- 12.1.14 Haier
- 12.1.14.1. Company Overview
- 12.1.14.2. Products
- 12.1.14.3. Company Financials
- 12.1.14.4. SWOT Analysis
- 12.1.1 Samsung
- 12.2. Market Entropy
- 12.2.1 Company's Key Areas Served
- 12.2.2 Recent Developments
- 12.3. Company Market Share Analysis 2025
- 12.3.1 Top 5 Companies Market Share Analysis
- 12.3.2 Top 3 Companies Market Share Analysis
- 12.4. List of Potential Customers
- 13. Research Methodology
List of Figures
- Figure 1: Global Full HD TVs Revenue Breakdown (undefined, %) by Region 2025 & 2033
- Figure 2: Global Full HD TVs Volume Breakdown (K, %) by Region 2025 & 2033
- Figure 3: North America Full HD TVs Revenue (undefined), by Application 2025 & 2033
- Figure 4: North America Full HD TVs Volume (K), by Application 2025 & 2033
- Figure 5: North America Full HD TVs Revenue Share (%), by Application 2025 & 2033
- Figure 6: North America Full HD TVs Volume Share (%), by Application 2025 & 2033
- Figure 7: North America Full HD TVs Revenue (undefined), by Types 2025 & 2033
- Figure 8: North America Full HD TVs Volume (K), by Types 2025 & 2033
- Figure 9: North America Full HD TVs Revenue Share (%), by Types 2025 & 2033
- Figure 10: North America Full HD TVs Volume Share (%), by Types 2025 & 2033
- Figure 11: North America Full HD TVs Revenue (undefined), by Country 2025 & 2033
- Figure 12: North America Full HD TVs Volume (K), by Country 2025 & 2033
- Figure 13: North America Full HD TVs Revenue Share (%), by Country 2025 & 2033
- Figure 14: North America Full HD TVs Volume Share (%), by Country 2025 & 2033
- Figure 15: South America Full HD TVs Revenue (undefined), by Application 2025 & 2033
- Figure 16: South America Full HD TVs Volume (K), by Application 2025 & 2033
- Figure 17: South America Full HD TVs Revenue Share (%), by Application 2025 & 2033
- Figure 18: South America Full HD TVs Volume Share (%), by Application 2025 & 2033
- Figure 19: South America Full HD TVs Revenue (undefined), by Types 2025 & 2033
- Figure 20: South America Full HD TVs Volume (K), by Types 2025 & 2033
- Figure 21: South America Full HD TVs Revenue Share (%), by Types 2025 & 2033
- Figure 22: South America Full HD TVs Volume Share (%), by Types 2025 & 2033
- Figure 23: South America Full HD TVs Revenue (undefined), by Country 2025 & 2033
- Figure 24: South America Full HD TVs Volume (K), by Country 2025 & 2033
- Figure 25: South America Full HD TVs Revenue Share (%), by Country 2025 & 2033
- Figure 26: South America Full HD TVs Volume Share (%), by Country 2025 & 2033
- Figure 27: Europe Full HD TVs Revenue (undefined), by Application 2025 & 2033
- Figure 28: Europe Full HD TVs Volume (K), by Application 2025 & 2033
- Figure 29: Europe Full HD TVs Revenue Share (%), by Application 2025 & 2033
- Figure 30: Europe Full HD TVs Volume Share (%), by Application 2025 & 2033
- Figure 31: Europe Full HD TVs Revenue (undefined), by Types 2025 & 2033
- Figure 32: Europe Full HD TVs Volume (K), by Types 2025 & 2033
- Figure 33: Europe Full HD TVs Revenue Share (%), by Types 2025 & 2033
- Figure 34: Europe Full HD TVs Volume Share (%), by Types 2025 & 2033
- Figure 35: Europe Full HD TVs Revenue (undefined), by Country 2025 & 2033
- Figure 36: Europe Full HD TVs Volume (K), by Country 2025 & 2033
- Figure 37: Europe Full HD TVs Revenue Share (%), by Country 2025 & 2033
- Figure 38: Europe Full HD TVs Volume Share (%), by Country 2025 & 2033
- Figure 39: Middle East & Africa Full HD TVs Revenue (undefined), by Application 2025 & 2033
- Figure 40: Middle East & Africa Full HD TVs Volume (K), by Application 2025 & 2033
- Figure 41: Middle East & Africa Full HD TVs Revenue Share (%), by Application 2025 & 2033
- Figure 42: Middle East & Africa Full HD TVs Volume Share (%), by Application 2025 & 2033
- Figure 43: Middle East & Africa Full HD TVs Revenue (undefined), by Types 2025 & 2033
- Figure 44: Middle East & Africa Full HD TVs Volume (K), by Types 2025 & 2033
- Figure 45: Middle East & Africa Full HD TVs Revenue Share (%), by Types 2025 & 2033
- Figure 46: Middle East & Africa Full HD TVs Volume Share (%), by Types 2025 & 2033
- Figure 47: Middle East & Africa Full HD TVs Revenue (undefined), by Country 2025 & 2033
- Figure 48: Middle East & Africa Full HD TVs Volume (K), by Country 2025 & 2033
- Figure 49: Middle East & Africa Full HD TVs Revenue Share (%), by Country 2025 & 2033
- Figure 50: Middle East & Africa Full HD TVs Volume Share (%), by Country 2025 & 2033
- Figure 51: Asia Pacific Full HD TVs Revenue (undefined), by Application 2025 & 2033
- Figure 52: Asia Pacific Full HD TVs Volume (K), by Application 2025 & 2033
- Figure 53: Asia Pacific Full HD TVs Revenue Share (%), by Application 2025 & 2033
- Figure 54: Asia Pacific Full HD TVs Volume Share (%), by Application 2025 & 2033
- Figure 55: Asia Pacific Full HD TVs Revenue (undefined), by Types 2025 & 2033
- Figure 56: Asia Pacific Full HD TVs Volume (K), by Types 2025 & 2033
- Figure 57: Asia Pacific Full HD TVs Revenue Share (%), by Types 2025 & 2033
- Figure 58: Asia Pacific Full HD TVs Volume Share (%), by Types 2025 & 2033
- Figure 59: Asia Pacific Full HD TVs Revenue (undefined), by Country 2025 & 2033
- Figure 60: Asia Pacific Full HD TVs Volume (K), by Country 2025 & 2033
- Figure 61: Asia Pacific Full HD TVs Revenue Share (%), by Country 2025 & 2033
- Figure 62: Asia Pacific Full HD TVs Volume Share (%), by Country 2025 & 2033
List of Tables
- Table 1: Global Full HD TVs Revenue undefined Forecast, by Application 2020 & 2033
- Table 2: Global Full HD TVs Volume K Forecast, by Application 2020 & 2033
- Table 3: Global Full HD TVs Revenue undefined Forecast, by Types 2020 & 2033
- Table 4: Global Full HD TVs Volume K Forecast, by Types 2020 & 2033
- Table 5: Global Full HD TVs Revenue undefined Forecast, by Region 2020 & 2033
- Table 6: Global Full HD TVs Volume K Forecast, by Region 2020 & 2033
- Table 7: Global Full HD TVs Revenue undefined Forecast, by Application 2020 & 2033
- Table 8: Global Full HD TVs Volume K Forecast, by Application 2020 & 2033
- Table 9: Global Full HD TVs Revenue undefined Forecast, by Types 2020 & 2033
- Table 10: Global Full HD TVs Volume K Forecast, by Types 2020 & 2033
- Table 11: Global Full HD TVs Revenue undefined Forecast, by Country 2020 & 2033
- Table 12: Global Full HD TVs Volume K Forecast, by Country 2020 & 2033
- Table 13: United States Full HD TVs Revenue (undefined) Forecast, by Application 2020 & 2033
- Table 14: United States Full HD TVs Volume (K) Forecast, by Application 2020 & 2033
- Table 15: Canada Full HD TVs Revenue (undefined) Forecast, by Application 2020 & 2033
- Table 16: Canada Full HD TVs Volume (K) Forecast, by Application 2020 & 2033
- Table 17: Mexico Full HD TVs Revenue (undefined) Forecast, by Application 2020 & 2033
- Table 18: Mexico Full HD TVs Volume (K) Forecast, by Application 2020 & 2033
- Table 19: Global Full HD TVs Revenue undefined Forecast, by Application 2020 & 2033
- Table 20: Global Full HD TVs Volume K Forecast, by Application 2020 & 2033
- Table 21: Global Full HD TVs Revenue undefined Forecast, by Types 2020 & 2033
- Table 22: Global Full HD TVs Volume K Forecast, by Types 2020 & 2033
- Table 23: Global Full HD TVs Revenue undefined Forecast, by Country 2020 & 2033
- Table 24: Global Full HD TVs Volume K Forecast, by Country 2020 & 2033
- Table 25: Brazil Full HD TVs Revenue (undefined) Forecast, by Application 2020 & 2033
- Table 26: Brazil Full HD TVs Volume (K) Forecast, by Application 2020 & 2033
- Table 27: Argentina Full HD TVs Revenue (undefined) Forecast, by Application 2020 & 2033
- Table 28: Argentina Full HD TVs Volume (K) Forecast, by Application 2020 & 2033
- Table 29: Rest of South America Full HD TVs Revenue (undefined) Forecast, by Application 2020 & 2033
- Table 30: Rest of South America Full HD TVs Volume (K) Forecast, by Application 2020 & 2033
- Table 31: Global Full HD TVs Revenue undefined Forecast, by Application 2020 & 2033
- Table 32: Global Full HD TVs Volume K Forecast, by Application 2020 & 2033
- Table 33: Global Full HD TVs Revenue undefined Forecast, by Types 2020 & 2033
- Table 34: Global Full HD TVs Volume K Forecast, by Types 2020 & 2033
- Table 35: Global Full HD TVs Revenue undefined Forecast, by Country 2020 & 2033
- Table 36: Global Full HD TVs Volume K Forecast, by Country 2020 & 2033
- Table 37: United Kingdom Full HD TVs Revenue (undefined) Forecast, by Application 2020 & 2033
- Table 38: United Kingdom Full HD TVs Volume (K) Forecast, by Application 2020 & 2033
- Table 39: Germany Full HD TVs Revenue (undefined) Forecast, by Application 2020 & 2033
- Table 40: Germany Full HD TVs Volume (K) Forecast, by Application 2020 & 2033
- Table 41: France Full HD TVs Revenue (undefined) Forecast, by Application 2020 & 2033
- Table 42: France Full HD TVs Volume (K) Forecast, by Application 2020 & 2033
- Table 43: Italy Full HD TVs Revenue (undefined) Forecast, by Application 2020 & 2033
- Table 44: Italy Full HD TVs Volume (K) Forecast, by Application 2020 & 2033
- Table 45: Spain Full HD TVs Revenue (undefined) Forecast, by Application 2020 & 2033
- Table 46: Spain Full HD TVs Volume (K) Forecast, by Application 2020 & 2033
- Table 47: Russia Full HD TVs Revenue (undefined) Forecast, by Application 2020 & 2033
- Table 48: Russia Full HD TVs Volume (K) Forecast, by Application 2020 & 2033
- Table 49: Benelux Full HD TVs Revenue (undefined) Forecast, by Application 2020 & 2033
- Table 50: Benelux Full HD TVs Volume (K) Forecast, by Application 2020 & 2033
- Table 51: Nordics Full HD TVs Revenue (undefined) Forecast, by Application 2020 & 2033
- Table 52: Nordics Full HD TVs Volume (K) Forecast, by Application 2020 & 2033
- Table 53: Rest of Europe Full HD TVs Revenue (undefined) Forecast, by Application 2020 & 2033
- Table 54: Rest of Europe Full HD TVs Volume (K) Forecast, by Application 2020 & 2033
- Table 55: Global Full HD TVs Revenue undefined Forecast, by Application 2020 & 2033
- Table 56: Global Full HD TVs Volume K Forecast, by Application 2020 & 2033
- Table 57: Global Full HD TVs Revenue undefined Forecast, by Types 2020 & 2033
- Table 58: Global Full HD TVs Volume K Forecast, by Types 2020 & 2033
- Table 59: Global Full HD TVs Revenue undefined Forecast, by Country 2020 & 2033
- Table 60: Global Full HD TVs Volume K Forecast, by Country 2020 & 2033
- Table 61: Turkey Full HD TVs Revenue (undefined) Forecast, by Application 2020 & 2033
- Table 62: Turkey Full HD TVs Volume (K) Forecast, by Application 2020 & 2033
- Table 63: Israel Full HD TVs Revenue (undefined) Forecast, by Application 2020 & 2033
- Table 64: Israel Full HD TVs Volume (K) Forecast, by Application 2020 & 2033
- Table 65: GCC Full HD TVs Revenue (undefined) Forecast, by Application 2020 & 2033
- Table 66: GCC Full HD TVs Volume (K) Forecast, by Application 2020 & 2033
- Table 67: North Africa Full HD TVs Revenue (undefined) Forecast, by Application 2020 & 2033
- Table 68: North Africa Full HD TVs Volume (K) Forecast, by Application 2020 & 2033
- Table 69: South Africa Full HD TVs Revenue (undefined) Forecast, by Application 2020 & 2033
- Table 70: South Africa Full HD TVs Volume (K) Forecast, by Application 2020 & 2033
- Table 71: Rest of Middle East & Africa Full HD TVs Revenue (undefined) Forecast, by Application 2020 & 2033
- Table 72: Rest of Middle East & Africa Full HD TVs Volume (K) Forecast, by Application 2020 & 2033
- Table 73: Global Full HD TVs Revenue undefined Forecast, by Application 2020 & 2033
- Table 74: Global Full HD TVs Volume K Forecast, by Application 2020 & 2033
- Table 75: Global Full HD TVs Revenue undefined Forecast, by Types 2020 & 2033
- Table 76: Global Full HD TVs Volume K Forecast, by Types 2020 & 2033
- Table 77: Global Full HD TVs Revenue undefined Forecast, by Country 2020 & 2033
- Table 78: Global Full HD TVs Volume K Forecast, by Country 2020 & 2033
- Table 79: China Full HD TVs Revenue (undefined) Forecast, by Application 2020 & 2033
- Table 80: China Full HD TVs Volume (K) Forecast, by Application 2020 & 2033
- Table 81: India Full HD TVs Revenue (undefined) Forecast, by Application 2020 & 2033
- Table 82: India Full HD TVs Volume (K) Forecast, by Application 2020 & 2033
- Table 83: Japan Full HD TVs Revenue (undefined) Forecast, by Application 2020 & 2033
- Table 84: Japan Full HD TVs Volume (K) Forecast, by Application 2020 & 2033
- Table 85: South Korea Full HD TVs Revenue (undefined) Forecast, by Application 2020 & 2033
- Table 86: South Korea Full HD TVs Volume (K) Forecast, by Application 2020 & 2033
- Table 87: ASEAN Full HD TVs Revenue (undefined) Forecast, by Application 2020 & 2033
- Table 88: ASEAN Full HD TVs Volume (K) Forecast, by Application 2020 & 2033
- Table 89: Oceania Full HD TVs Revenue (undefined) Forecast, by Application 2020 & 2033
- Table 90: Oceania Full HD TVs Volume (K) Forecast, by Application 2020 & 2033
- Table 91: Rest of Asia Pacific Full HD TVs Revenue (undefined) Forecast, by Application 2020 & 2033
- Table 92: Rest of Asia Pacific Full HD TVs Volume (K) Forecast, by Application 2020 & 2033
Frequently Asked Questions
1. What is the projected Compound Annual Growth Rate (CAGR) of the Full HD TVs?
The projected CAGR is approximately 4.9%.
2. Which companies are prominent players in the Full HD TVs?
Key companies in the market include Samsung, LG, SONY, Sharp, Panasonic, Toshiba, Seiki (Tongfang), Hisense, Skyworth, Changhong, TCL, Konka, Philips(Suning), Haier.
3. What are the main segments of the Full HD TVs?
The market segments include Application, Types.
4. Can you provide details about the market size?
The market size is estimated to be USD XXX N/A as of 2022.
5. What are some drivers contributing to market growth?
N/A
6. What are the notable trends driving market growth?
N/A
7. Are there any restraints impacting market growth?
N/A
8. Can you provide examples of recent developments in the market?
N/A
9. What pricing options are available for accessing the report?
Pricing options include single-user, multi-user, and enterprise licenses priced at USD 3350.00, USD 5025.00, and USD 6700.00 respectively.
10. Is the market size provided in terms of value or volume?
The market size is provided in terms of value, measured in N/A and volume, measured in K.
11. Are there any specific market keywords associated with the report?
Yes, the market keyword associated with the report is "Full HD TVs," which aids in identifying and referencing the specific market segment covered.
12. How do I determine which pricing option suits my needs best?
The pricing options vary based on user requirements and access needs. Individual users may opt for single-user licenses, while businesses requiring broader access may choose multi-user or enterprise licenses for cost-effective access to the report.
13. Are there any additional resources or data provided in the Full HD TVs report?
While the report offers comprehensive insights, it's advisable to review the specific contents or supplementary materials provided to ascertain if additional resources or data are available.
14. How can I stay updated on further developments or reports in the Full HD TVs?
To stay informed about further developments, trends, and reports in the Full HD TVs, consider subscribing to industry newsletters, following relevant companies and organizations, or regularly checking reputable industry news sources and publications.
Methodology
Step 1 - Identification of Relevant Samples Size from Population Database


Step 2 - Approaches for Defining Global Market Size (Value, Volume* & Price*)

Note*: In applicable scenarios
Step 3 - Data Sources
Primary Research
- Web Analytics
- Survey Reports
- Research Institute
- Latest Research Reports
- Opinion Leaders
Secondary Research
- Annual Reports
- White Paper
- Latest Press Release
- Industry Association
- Paid Database
- Investor Presentations

Step 4 - Data Triangulation
Involves using different sources of information in order to increase the validity of a study
These sources are likely to be stakeholders in a program - participants, other researchers, program staff, other community members, and so on.
Then we put all data in single framework & apply various statistical tools to find out the dynamic on the market.
During the analysis stage, feedback from the stakeholder groups would be compared to determine areas of agreement as well as areas of divergence