

Key Insights
The functional brain imaging market is poised for significant expansion, propelled by the escalating incidence of neurological and psychiatric conditions, breakthroughs in imaging technology, and a growing imperative for early and precise diagnostics. The market, valued at $5.08 billion in 2025, is projected to grow at a Compound Annual Growth Rate (CAGR) of 7.2% from 2025 to 2033. This robust growth is underpinned by advancements in technologies like fMRI, EEG, MEG, and PET, which provide increasingly detailed insights into brain function. The expanding use of these modalities in research, alongside amplified governmental investment in neurological studies, further stimulates market development. Leading companies are strategically investing in research and development to refine and broaden the accessibility of these critical imaging techniques.
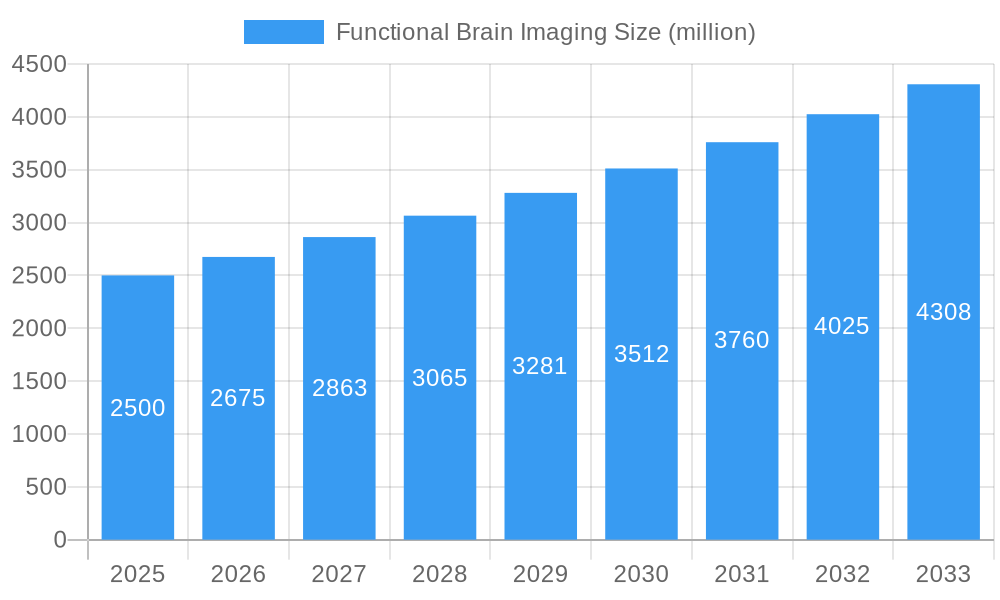
Functional Brain Imaging Market Size (In Billion)
Conversely, market expansion is tempered by challenges. The substantial financial investment required for equipment procurement, ongoing maintenance, and specialized personnel presents a considerable hurdle, particularly for developing economies. The intricate nature of data analysis and interpretation also demands advanced expertise, potentially creating operational constraints. Nevertheless, the emergence of advanced software solutions to simplify data processing and the heightened awareness of the advantages of early intervention for neurological disorders are gradually alleviating these limitations. Market segmentation is categorized by technology (fMRI, EEG, MEG, PET), application (research, clinical diagnostics, therapeutic monitoring), and end-user (hospitals, research institutions, clinics). Regional growth will differ, with North America and Europe anticipated to retain their leading market positions due to elevated healthcare expenditure and widespread adoption of advanced technologies.
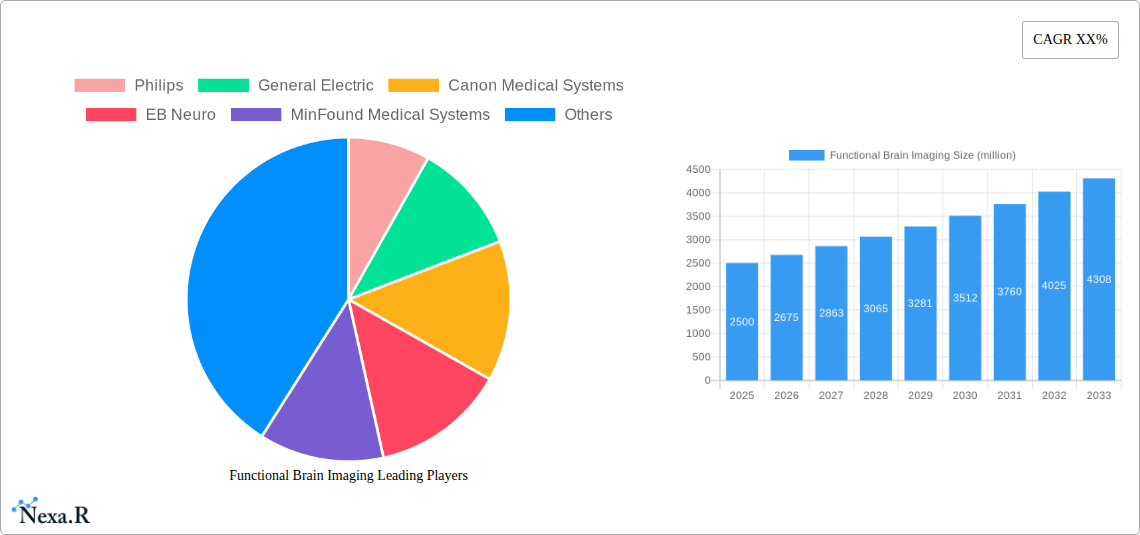
Functional Brain Imaging Company Market Share
Functional Brain Imaging Market Report: 2019-2033
This comprehensive report provides an in-depth analysis of the Functional Brain Imaging market, projecting robust growth from 2025 to 2033. Targeting healthcare professionals, investors, and industry stakeholders, this report offers crucial insights into market dynamics, technological advancements, and key players shaping this rapidly evolving sector. The study period covers 2019-2033, with 2025 as the base and estimated year. The forecast period is 2025-2033, and the historical period is 2019-2024. The global market size in 2025 is estimated at $xx million.
Functional Brain Imaging Market Dynamics & Structure
The Functional Brain Imaging market is characterized by moderate concentration, with key players like Philips, General Electric, and Canon Medical Systems holding significant market share. Technological innovation, particularly in AI-driven image analysis and advanced neuroimaging techniques, is a primary growth driver. Stringent regulatory frameworks, however, pose challenges to market entry and product approvals. Competitive pressure arises from substitute technologies and the emergence of novel diagnostic approaches. The end-user demographic primarily comprises hospitals, research institutions, and specialized clinics. M&A activity remains significant, with xx major deals recorded between 2019 and 2024, reflecting consolidation within the industry.
- Market Concentration: Moderately concentrated, with top 5 players holding approximately 60% market share in 2025.
- Technological Innovation: AI-powered image analysis, advanced fMRI and EEG techniques are key drivers.
- Regulatory Landscape: Stringent FDA and CE marking requirements impact market entry and speed of innovation.
- Competitive Substitutes: PET scans, SPECT scans offer alternative diagnostic options.
- End-User Demographics: Hospitals (45%), Research Institutions (30%), Specialized Clinics (25%) in 2025.
- M&A Activity: xx major mergers and acquisitions recorded between 2019 and 2024.
Functional Brain Imaging Growth Trends & Insights
The Functional Brain Imaging market exhibits a steady growth trajectory, driven by increasing prevalence of neurological disorders, rising research funding for brain-related studies, and technological advancements. The market experienced a CAGR of xx% during the historical period (2019-2024) and is projected to grow at a CAGR of xx% during the forecast period (2025-2033), reaching an estimated $xx million by 2033. Market penetration remains relatively low in emerging economies, presenting significant growth opportunities. Consumer behavior is shifting towards minimally invasive procedures and personalized diagnostic solutions. Technological disruptions, including the integration of AI and cloud computing, are accelerating market expansion.
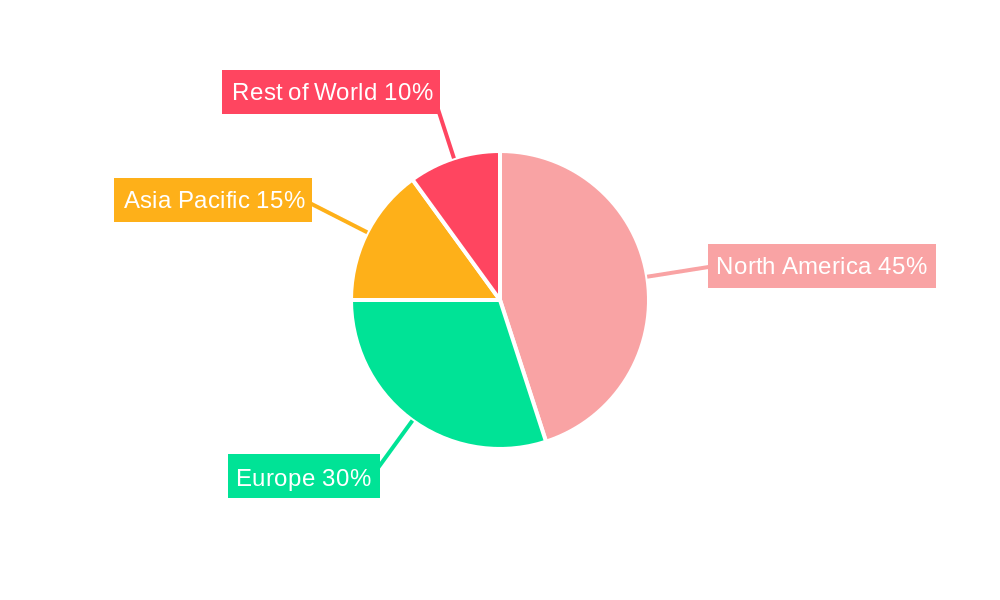
Dominant Regions, Countries, or Segments in Functional Brain Imaging
North America currently dominates the Functional Brain Imaging market, owing to advanced healthcare infrastructure, high research spending, and early adoption of novel technologies. The region holds approximately 45% of the global market share in 2025. Europe follows as a significant market, while Asia-Pacific exhibits high growth potential driven by increasing healthcare expenditure and rising prevalence of neurological diseases.
- North America: High adoption rates, advanced healthcare infrastructure, significant research funding.
- Europe: Well-established healthcare systems, growing demand for advanced diagnostic tools.
- Asia-Pacific: Rapid growth potential, increasing healthcare investment, rising prevalence of neurological disorders.
Functional Brain Imaging Product Landscape
The product landscape encompasses diverse technologies including fMRI, EEG, MEG, and PET scans. Recent innovations focus on enhancing image resolution, improving data analysis, and developing portable and user-friendly systems. Key advancements involve the integration of AI for automated image analysis and improved diagnostic accuracy. This trend reflects the growing demand for faster and more efficient diagnostic solutions.
Key Drivers, Barriers & Challenges in Functional Brain Imaging
Key Drivers:
- Rising prevalence of neurological disorders (Alzheimer's, Parkinson's, stroke).
- Increasing research funding for brain-related research and development.
- Technological advancements in imaging techniques and data analysis.
- Growing demand for minimally invasive diagnostic procedures.
Key Challenges:
- High equipment costs and maintenance expenses impacting market access.
- Stringent regulatory approvals and compliance requirements slowing down product launches.
- Skilled personnel shortage in operating and interpreting complex imaging data.
- Competition from alternative diagnostic methods. This leads to a xx% reduction in market growth annually.
Emerging Opportunities in Functional Brain Imaging
- Expansion into emerging markets with unmet diagnostic needs.
- Development of point-of-care diagnostic tools for faster and more accessible testing.
- Integration of advanced analytics and AI for improved diagnostic accuracy and personalized medicine.
- Growing demand for cloud-based image storage and analysis solutions.
Growth Accelerators in the Functional Brain Imaging Industry
Technological breakthroughs, strategic partnerships between imaging equipment manufacturers and software developers, and expansion into new geographic markets are expected to fuel long-term growth. The development of new applications in neuroscience research and personalized medicine will also significantly drive market expansion.
Key Players Shaping the Functional Brain Imaging Market
- Philips
- General Electric
- Canon Medical Systems
- EB Neuro
- MinFound Medical Systems
- Neurosoft
- Medtronic
- Nihon Kohden
- Hitachi Medical Systems
- Elekta
Notable Milestones in Functional Brain Imaging Sector
- 2020: FDA approval of a new AI-powered fMRI analysis software.
- 2021: Launch of a portable EEG system for remote patient monitoring.
- 2022: Strategic partnership between a major imaging company and a software developer for advanced data analytics.
- 2023: Merger between two key players in the MEG technology market.
In-Depth Functional Brain Imaging Market Outlook
The Functional Brain Imaging market is poised for sustained growth driven by technological innovations, increasing prevalence of neurological diseases, and rising healthcare expenditure. Strategic partnerships, expansion into emerging markets, and the development of new applications will further propel market expansion, unlocking significant opportunities for established players and new entrants. The market's future is bright with continuous advancements and substantial growth potential in the coming years.
Functional Brain Imaging Segmentation
-
1. Application
- 1.1. Hospital
- 1.2. Diagnostic Imaging Center
- 1.3. Others
-
2. Types
- 2.1. Functional MR Imaging (fMRI) Systems
- 2.2. Functional Near Infrared Spectroscopy (fNIRS) Systems
- 2.3. Positron Emission Tomography (PET) System
- 2.4. Others
Functional Brain Imaging Segmentation By Geography
-
1. North America
- 1.1. United States
- 1.2. Canada
- 1.3. Mexico
-
2. South America
- 2.1. Brazil
- 2.2. Argentina
- 2.3. Rest of South America
-
3. Europe
- 3.1. United Kingdom
- 3.2. Germany
- 3.3. France
- 3.4. Italy
- 3.5. Spain
- 3.6. Russia
- 3.7. Benelux
- 3.8. Nordics
- 3.9. Rest of Europe
-
4. Middle East & Africa
- 4.1. Turkey
- 4.2. Israel
- 4.3. GCC
- 4.4. North Africa
- 4.5. South Africa
- 4.6. Rest of Middle East & Africa
-
5. Asia Pacific
- 5.1. China
- 5.2. India
- 5.3. Japan
- 5.4. South Korea
- 5.5. ASEAN
- 5.6. Oceania
- 5.7. Rest of Asia Pacific
Functional Brain Imaging Regional Market Share
Geographic Coverage of Functional Brain Imaging
Functional Brain Imaging REPORT HIGHLIGHTS
| Aspects | Details |
|---|---|
| Study Period | 2020-2034 |
| Base Year | 2025 |
| Estimated Year | 2026 |
| Forecast Period | 2026-2034 |
| Historical Period | 2020-2025 |
| Growth Rate | CAGR of 7.2% from 2020-2034 |
| Segmentation |
|
Table of Contents
- 1. Introduction
- 1.1. Research Scope
- 1.2. Market Segmentation
- 1.3. Research Methodology
- 1.4. Definitions and Assumptions
- 2. Executive Summary
- 2.1. Introduction
- 3. Market Dynamics
- 3.1. Introduction
- 3.2. Market Drivers
- 3.3. Market Restrains
- 3.4. Market Trends
- 4. Market Factor Analysis
- 4.1. Porters Five Forces
- 4.2. Supply/Value Chain
- 4.3. PESTEL analysis
- 4.4. Market Entropy
- 4.5. Patent/Trademark Analysis
- 5. Global Functional Brain Imaging Analysis, Insights and Forecast, 2020-2032
- 5.1. Market Analysis, Insights and Forecast - by Application
- 5.1.1. Hospital
- 5.1.2. Diagnostic Imaging Center
- 5.1.3. Others
- 5.2. Market Analysis, Insights and Forecast - by Types
- 5.2.1. Functional MR Imaging (fMRI) Systems
- 5.2.2. Functional Near Infrared Spectroscopy (fNIRS) Systems
- 5.2.3. Positron Emission Tomography (PET) System
- 5.2.4. Others
- 5.3. Market Analysis, Insights and Forecast - by Region
- 5.3.1. North America
- 5.3.2. South America
- 5.3.3. Europe
- 5.3.4. Middle East & Africa
- 5.3.5. Asia Pacific
- 5.1. Market Analysis, Insights and Forecast - by Application
- 6. North America Functional Brain Imaging Analysis, Insights and Forecast, 2020-2032
- 6.1. Market Analysis, Insights and Forecast - by Application
- 6.1.1. Hospital
- 6.1.2. Diagnostic Imaging Center
- 6.1.3. Others
- 6.2. Market Analysis, Insights and Forecast - by Types
- 6.2.1. Functional MR Imaging (fMRI) Systems
- 6.2.2. Functional Near Infrared Spectroscopy (fNIRS) Systems
- 6.2.3. Positron Emission Tomography (PET) System
- 6.2.4. Others
- 6.1. Market Analysis, Insights and Forecast - by Application
- 7. South America Functional Brain Imaging Analysis, Insights and Forecast, 2020-2032
- 7.1. Market Analysis, Insights and Forecast - by Application
- 7.1.1. Hospital
- 7.1.2. Diagnostic Imaging Center
- 7.1.3. Others
- 7.2. Market Analysis, Insights and Forecast - by Types
- 7.2.1. Functional MR Imaging (fMRI) Systems
- 7.2.2. Functional Near Infrared Spectroscopy (fNIRS) Systems
- 7.2.3. Positron Emission Tomography (PET) System
- 7.2.4. Others
- 7.1. Market Analysis, Insights and Forecast - by Application
- 8. Europe Functional Brain Imaging Analysis, Insights and Forecast, 2020-2032
- 8.1. Market Analysis, Insights and Forecast - by Application
- 8.1.1. Hospital
- 8.1.2. Diagnostic Imaging Center
- 8.1.3. Others
- 8.2. Market Analysis, Insights and Forecast - by Types
- 8.2.1. Functional MR Imaging (fMRI) Systems
- 8.2.2. Functional Near Infrared Spectroscopy (fNIRS) Systems
- 8.2.3. Positron Emission Tomography (PET) System
- 8.2.4. Others
- 8.1. Market Analysis, Insights and Forecast - by Application
- 9. Middle East & Africa Functional Brain Imaging Analysis, Insights and Forecast, 2020-2032
- 9.1. Market Analysis, Insights and Forecast - by Application
- 9.1.1. Hospital
- 9.1.2. Diagnostic Imaging Center
- 9.1.3. Others
- 9.2. Market Analysis, Insights and Forecast - by Types
- 9.2.1. Functional MR Imaging (fMRI) Systems
- 9.2.2. Functional Near Infrared Spectroscopy (fNIRS) Systems
- 9.2.3. Positron Emission Tomography (PET) System
- 9.2.4. Others
- 9.1. Market Analysis, Insights and Forecast - by Application
- 10. Asia Pacific Functional Brain Imaging Analysis, Insights and Forecast, 2020-2032
- 10.1. Market Analysis, Insights and Forecast - by Application
- 10.1.1. Hospital
- 10.1.2. Diagnostic Imaging Center
- 10.1.3. Others
- 10.2. Market Analysis, Insights and Forecast - by Types
- 10.2.1. Functional MR Imaging (fMRI) Systems
- 10.2.2. Functional Near Infrared Spectroscopy (fNIRS) Systems
- 10.2.3. Positron Emission Tomography (PET) System
- 10.2.4. Others
- 10.1. Market Analysis, Insights and Forecast - by Application
- 11. Competitive Analysis
- 11.1. Global Market Share Analysis 2025
- 11.2. Company Profiles
- 11.2.1 Philips
- 11.2.1.1. Overview
- 11.2.1.2. Products
- 11.2.1.3. SWOT Analysis
- 11.2.1.4. Recent Developments
- 11.2.1.5. Financials (Based on Availability)
- 11.2.2 General Electric
- 11.2.2.1. Overview
- 11.2.2.2. Products
- 11.2.2.3. SWOT Analysis
- 11.2.2.4. Recent Developments
- 11.2.2.5. Financials (Based on Availability)
- 11.2.3 Canon Medical Systems
- 11.2.3.1. Overview
- 11.2.3.2. Products
- 11.2.3.3. SWOT Analysis
- 11.2.3.4. Recent Developments
- 11.2.3.5. Financials (Based on Availability)
- 11.2.4 EB Neuro
- 11.2.4.1. Overview
- 11.2.4.2. Products
- 11.2.4.3. SWOT Analysis
- 11.2.4.4. Recent Developments
- 11.2.4.5. Financials (Based on Availability)
- 11.2.5 MinFound Medical Systems
- 11.2.5.1. Overview
- 11.2.5.2. Products
- 11.2.5.3. SWOT Analysis
- 11.2.5.4. Recent Developments
- 11.2.5.5. Financials (Based on Availability)
- 11.2.6 Neurosoft
- 11.2.6.1. Overview
- 11.2.6.2. Products
- 11.2.6.3. SWOT Analysis
- 11.2.6.4. Recent Developments
- 11.2.6.5. Financials (Based on Availability)
- 11.2.7 Medtronic
- 11.2.7.1. Overview
- 11.2.7.2. Products
- 11.2.7.3. SWOT Analysis
- 11.2.7.4. Recent Developments
- 11.2.7.5. Financials (Based on Availability)
- 11.2.8 Nihon Kohden
- 11.2.8.1. Overview
- 11.2.8.2. Products
- 11.2.8.3. SWOT Analysis
- 11.2.8.4. Recent Developments
- 11.2.8.5. Financials (Based on Availability)
- 11.2.9 Hitachi Medical Systems
- 11.2.9.1. Overview
- 11.2.9.2. Products
- 11.2.9.3. SWOT Analysis
- 11.2.9.4. Recent Developments
- 11.2.9.5. Financials (Based on Availability)
- 11.2.10 Elekta
- 11.2.10.1. Overview
- 11.2.10.2. Products
- 11.2.10.3. SWOT Analysis
- 11.2.10.4. Recent Developments
- 11.2.10.5. Financials (Based on Availability)
- 11.2.1 Philips
List of Figures
- Figure 1: Global Functional Brain Imaging Revenue Breakdown (billion, %) by Region 2025 & 2033
- Figure 2: Global Functional Brain Imaging Volume Breakdown (K, %) by Region 2025 & 2033
- Figure 3: North America Functional Brain Imaging Revenue (billion), by Application 2025 & 2033
- Figure 4: North America Functional Brain Imaging Volume (K), by Application 2025 & 2033
- Figure 5: North America Functional Brain Imaging Revenue Share (%), by Application 2025 & 2033
- Figure 6: North America Functional Brain Imaging Volume Share (%), by Application 2025 & 2033
- Figure 7: North America Functional Brain Imaging Revenue (billion), by Types 2025 & 2033
- Figure 8: North America Functional Brain Imaging Volume (K), by Types 2025 & 2033
- Figure 9: North America Functional Brain Imaging Revenue Share (%), by Types 2025 & 2033
- Figure 10: North America Functional Brain Imaging Volume Share (%), by Types 2025 & 2033
- Figure 11: North America Functional Brain Imaging Revenue (billion), by Country 2025 & 2033
- Figure 12: North America Functional Brain Imaging Volume (K), by Country 2025 & 2033
- Figure 13: North America Functional Brain Imaging Revenue Share (%), by Country 2025 & 2033
- Figure 14: North America Functional Brain Imaging Volume Share (%), by Country 2025 & 2033
- Figure 15: South America Functional Brain Imaging Revenue (billion), by Application 2025 & 2033
- Figure 16: South America Functional Brain Imaging Volume (K), by Application 2025 & 2033
- Figure 17: South America Functional Brain Imaging Revenue Share (%), by Application 2025 & 2033
- Figure 18: South America Functional Brain Imaging Volume Share (%), by Application 2025 & 2033
- Figure 19: South America Functional Brain Imaging Revenue (billion), by Types 2025 & 2033
- Figure 20: South America Functional Brain Imaging Volume (K), by Types 2025 & 2033
- Figure 21: South America Functional Brain Imaging Revenue Share (%), by Types 2025 & 2033
- Figure 22: South America Functional Brain Imaging Volume Share (%), by Types 2025 & 2033
- Figure 23: South America Functional Brain Imaging Revenue (billion), by Country 2025 & 2033
- Figure 24: South America Functional Brain Imaging Volume (K), by Country 2025 & 2033
- Figure 25: South America Functional Brain Imaging Revenue Share (%), by Country 2025 & 2033
- Figure 26: South America Functional Brain Imaging Volume Share (%), by Country 2025 & 2033
- Figure 27: Europe Functional Brain Imaging Revenue (billion), by Application 2025 & 2033
- Figure 28: Europe Functional Brain Imaging Volume (K), by Application 2025 & 2033
- Figure 29: Europe Functional Brain Imaging Revenue Share (%), by Application 2025 & 2033
- Figure 30: Europe Functional Brain Imaging Volume Share (%), by Application 2025 & 2033
- Figure 31: Europe Functional Brain Imaging Revenue (billion), by Types 2025 & 2033
- Figure 32: Europe Functional Brain Imaging Volume (K), by Types 2025 & 2033
- Figure 33: Europe Functional Brain Imaging Revenue Share (%), by Types 2025 & 2033
- Figure 34: Europe Functional Brain Imaging Volume Share (%), by Types 2025 & 2033
- Figure 35: Europe Functional Brain Imaging Revenue (billion), by Country 2025 & 2033
- Figure 36: Europe Functional Brain Imaging Volume (K), by Country 2025 & 2033
- Figure 37: Europe Functional Brain Imaging Revenue Share (%), by Country 2025 & 2033
- Figure 38: Europe Functional Brain Imaging Volume Share (%), by Country 2025 & 2033
- Figure 39: Middle East & Africa Functional Brain Imaging Revenue (billion), by Application 2025 & 2033
- Figure 40: Middle East & Africa Functional Brain Imaging Volume (K), by Application 2025 & 2033
- Figure 41: Middle East & Africa Functional Brain Imaging Revenue Share (%), by Application 2025 & 2033
- Figure 42: Middle East & Africa Functional Brain Imaging Volume Share (%), by Application 2025 & 2033
- Figure 43: Middle East & Africa Functional Brain Imaging Revenue (billion), by Types 2025 & 2033
- Figure 44: Middle East & Africa Functional Brain Imaging Volume (K), by Types 2025 & 2033
- Figure 45: Middle East & Africa Functional Brain Imaging Revenue Share (%), by Types 2025 & 2033
- Figure 46: Middle East & Africa Functional Brain Imaging Volume Share (%), by Types 2025 & 2033
- Figure 47: Middle East & Africa Functional Brain Imaging Revenue (billion), by Country 2025 & 2033
- Figure 48: Middle East & Africa Functional Brain Imaging Volume (K), by Country 2025 & 2033
- Figure 49: Middle East & Africa Functional Brain Imaging Revenue Share (%), by Country 2025 & 2033
- Figure 50: Middle East & Africa Functional Brain Imaging Volume Share (%), by Country 2025 & 2033
- Figure 51: Asia Pacific Functional Brain Imaging Revenue (billion), by Application 2025 & 2033
- Figure 52: Asia Pacific Functional Brain Imaging Volume (K), by Application 2025 & 2033
- Figure 53: Asia Pacific Functional Brain Imaging Revenue Share (%), by Application 2025 & 2033
- Figure 54: Asia Pacific Functional Brain Imaging Volume Share (%), by Application 2025 & 2033
- Figure 55: Asia Pacific Functional Brain Imaging Revenue (billion), by Types 2025 & 2033
- Figure 56: Asia Pacific Functional Brain Imaging Volume (K), by Types 2025 & 2033
- Figure 57: Asia Pacific Functional Brain Imaging Revenue Share (%), by Types 2025 & 2033
- Figure 58: Asia Pacific Functional Brain Imaging Volume Share (%), by Types 2025 & 2033
- Figure 59: Asia Pacific Functional Brain Imaging Revenue (billion), by Country 2025 & 2033
- Figure 60: Asia Pacific Functional Brain Imaging Volume (K), by Country 2025 & 2033
- Figure 61: Asia Pacific Functional Brain Imaging Revenue Share (%), by Country 2025 & 2033
- Figure 62: Asia Pacific Functional Brain Imaging Volume Share (%), by Country 2025 & 2033
List of Tables
- Table 1: Global Functional Brain Imaging Revenue billion Forecast, by Application 2020 & 2033
- Table 2: Global Functional Brain Imaging Volume K Forecast, by Application 2020 & 2033
- Table 3: Global Functional Brain Imaging Revenue billion Forecast, by Types 2020 & 2033
- Table 4: Global Functional Brain Imaging Volume K Forecast, by Types 2020 & 2033
- Table 5: Global Functional Brain Imaging Revenue billion Forecast, by Region 2020 & 2033
- Table 6: Global Functional Brain Imaging Volume K Forecast, by Region 2020 & 2033
- Table 7: Global Functional Brain Imaging Revenue billion Forecast, by Application 2020 & 2033
- Table 8: Global Functional Brain Imaging Volume K Forecast, by Application 2020 & 2033
- Table 9: Global Functional Brain Imaging Revenue billion Forecast, by Types 2020 & 2033
- Table 10: Global Functional Brain Imaging Volume K Forecast, by Types 2020 & 2033
- Table 11: Global Functional Brain Imaging Revenue billion Forecast, by Country 2020 & 2033
- Table 12: Global Functional Brain Imaging Volume K Forecast, by Country 2020 & 2033
- Table 13: United States Functional Brain Imaging Revenue (billion) Forecast, by Application 2020 & 2033
- Table 14: United States Functional Brain Imaging Volume (K) Forecast, by Application 2020 & 2033
- Table 15: Canada Functional Brain Imaging Revenue (billion) Forecast, by Application 2020 & 2033
- Table 16: Canada Functional Brain Imaging Volume (K) Forecast, by Application 2020 & 2033
- Table 17: Mexico Functional Brain Imaging Revenue (billion) Forecast, by Application 2020 & 2033
- Table 18: Mexico Functional Brain Imaging Volume (K) Forecast, by Application 2020 & 2033
- Table 19: Global Functional Brain Imaging Revenue billion Forecast, by Application 2020 & 2033
- Table 20: Global Functional Brain Imaging Volume K Forecast, by Application 2020 & 2033
- Table 21: Global Functional Brain Imaging Revenue billion Forecast, by Types 2020 & 2033
- Table 22: Global Functional Brain Imaging Volume K Forecast, by Types 2020 & 2033
- Table 23: Global Functional Brain Imaging Revenue billion Forecast, by Country 2020 & 2033
- Table 24: Global Functional Brain Imaging Volume K Forecast, by Country 2020 & 2033
- Table 25: Brazil Functional Brain Imaging Revenue (billion) Forecast, by Application 2020 & 2033
- Table 26: Brazil Functional Brain Imaging Volume (K) Forecast, by Application 2020 & 2033
- Table 27: Argentina Functional Brain Imaging Revenue (billion) Forecast, by Application 2020 & 2033
- Table 28: Argentina Functional Brain Imaging Volume (K) Forecast, by Application 2020 & 2033
- Table 29: Rest of South America Functional Brain Imaging Revenue (billion) Forecast, by Application 2020 & 2033
- Table 30: Rest of South America Functional Brain Imaging Volume (K) Forecast, by Application 2020 & 2033
- Table 31: Global Functional Brain Imaging Revenue billion Forecast, by Application 2020 & 2033
- Table 32: Global Functional Brain Imaging Volume K Forecast, by Application 2020 & 2033
- Table 33: Global Functional Brain Imaging Revenue billion Forecast, by Types 2020 & 2033
- Table 34: Global Functional Brain Imaging Volume K Forecast, by Types 2020 & 2033
- Table 35: Global Functional Brain Imaging Revenue billion Forecast, by Country 2020 & 2033
- Table 36: Global Functional Brain Imaging Volume K Forecast, by Country 2020 & 2033
- Table 37: United Kingdom Functional Brain Imaging Revenue (billion) Forecast, by Application 2020 & 2033
- Table 38: United Kingdom Functional Brain Imaging Volume (K) Forecast, by Application 2020 & 2033
- Table 39: Germany Functional Brain Imaging Revenue (billion) Forecast, by Application 2020 & 2033
- Table 40: Germany Functional Brain Imaging Volume (K) Forecast, by Application 2020 & 2033
- Table 41: France Functional Brain Imaging Revenue (billion) Forecast, by Application 2020 & 2033
- Table 42: France Functional Brain Imaging Volume (K) Forecast, by Application 2020 & 2033
- Table 43: Italy Functional Brain Imaging Revenue (billion) Forecast, by Application 2020 & 2033
- Table 44: Italy Functional Brain Imaging Volume (K) Forecast, by Application 2020 & 2033
- Table 45: Spain Functional Brain Imaging Revenue (billion) Forecast, by Application 2020 & 2033
- Table 46: Spain Functional Brain Imaging Volume (K) Forecast, by Application 2020 & 2033
- Table 47: Russia Functional Brain Imaging Revenue (billion) Forecast, by Application 2020 & 2033
- Table 48: Russia Functional Brain Imaging Volume (K) Forecast, by Application 2020 & 2033
- Table 49: Benelux Functional Brain Imaging Revenue (billion) Forecast, by Application 2020 & 2033
- Table 50: Benelux Functional Brain Imaging Volume (K) Forecast, by Application 2020 & 2033
- Table 51: Nordics Functional Brain Imaging Revenue (billion) Forecast, by Application 2020 & 2033
- Table 52: Nordics Functional Brain Imaging Volume (K) Forecast, by Application 2020 & 2033
- Table 53: Rest of Europe Functional Brain Imaging Revenue (billion) Forecast, by Application 2020 & 2033
- Table 54: Rest of Europe Functional Brain Imaging Volume (K) Forecast, by Application 2020 & 2033
- Table 55: Global Functional Brain Imaging Revenue billion Forecast, by Application 2020 & 2033
- Table 56: Global Functional Brain Imaging Volume K Forecast, by Application 2020 & 2033
- Table 57: Global Functional Brain Imaging Revenue billion Forecast, by Types 2020 & 2033
- Table 58: Global Functional Brain Imaging Volume K Forecast, by Types 2020 & 2033
- Table 59: Global Functional Brain Imaging Revenue billion Forecast, by Country 2020 & 2033
- Table 60: Global Functional Brain Imaging Volume K Forecast, by Country 2020 & 2033
- Table 61: Turkey Functional Brain Imaging Revenue (billion) Forecast, by Application 2020 & 2033
- Table 62: Turkey Functional Brain Imaging Volume (K) Forecast, by Application 2020 & 2033
- Table 63: Israel Functional Brain Imaging Revenue (billion) Forecast, by Application 2020 & 2033
- Table 64: Israel Functional Brain Imaging Volume (K) Forecast, by Application 2020 & 2033
- Table 65: GCC Functional Brain Imaging Revenue (billion) Forecast, by Application 2020 & 2033
- Table 66: GCC Functional Brain Imaging Volume (K) Forecast, by Application 2020 & 2033
- Table 67: North Africa Functional Brain Imaging Revenue (billion) Forecast, by Application 2020 & 2033
- Table 68: North Africa Functional Brain Imaging Volume (K) Forecast, by Application 2020 & 2033
- Table 69: South Africa Functional Brain Imaging Revenue (billion) Forecast, by Application 2020 & 2033
- Table 70: South Africa Functional Brain Imaging Volume (K) Forecast, by Application 2020 & 2033
- Table 71: Rest of Middle East & Africa Functional Brain Imaging Revenue (billion) Forecast, by Application 2020 & 2033
- Table 72: Rest of Middle East & Africa Functional Brain Imaging Volume (K) Forecast, by Application 2020 & 2033
- Table 73: Global Functional Brain Imaging Revenue billion Forecast, by Application 2020 & 2033
- Table 74: Global Functional Brain Imaging Volume K Forecast, by Application 2020 & 2033
- Table 75: Global Functional Brain Imaging Revenue billion Forecast, by Types 2020 & 2033
- Table 76: Global Functional Brain Imaging Volume K Forecast, by Types 2020 & 2033
- Table 77: Global Functional Brain Imaging Revenue billion Forecast, by Country 2020 & 2033
- Table 78: Global Functional Brain Imaging Volume K Forecast, by Country 2020 & 2033
- Table 79: China Functional Brain Imaging Revenue (billion) Forecast, by Application 2020 & 2033
- Table 80: China Functional Brain Imaging Volume (K) Forecast, by Application 2020 & 2033
- Table 81: India Functional Brain Imaging Revenue (billion) Forecast, by Application 2020 & 2033
- Table 82: India Functional Brain Imaging Volume (K) Forecast, by Application 2020 & 2033
- Table 83: Japan Functional Brain Imaging Revenue (billion) Forecast, by Application 2020 & 2033
- Table 84: Japan Functional Brain Imaging Volume (K) Forecast, by Application 2020 & 2033
- Table 85: South Korea Functional Brain Imaging Revenue (billion) Forecast, by Application 2020 & 2033
- Table 86: South Korea Functional Brain Imaging Volume (K) Forecast, by Application 2020 & 2033
- Table 87: ASEAN Functional Brain Imaging Revenue (billion) Forecast, by Application 2020 & 2033
- Table 88: ASEAN Functional Brain Imaging Volume (K) Forecast, by Application 2020 & 2033
- Table 89: Oceania Functional Brain Imaging Revenue (billion) Forecast, by Application 2020 & 2033
- Table 90: Oceania Functional Brain Imaging Volume (K) Forecast, by Application 2020 & 2033
- Table 91: Rest of Asia Pacific Functional Brain Imaging Revenue (billion) Forecast, by Application 2020 & 2033
- Table 92: Rest of Asia Pacific Functional Brain Imaging Volume (K) Forecast, by Application 2020 & 2033
Frequently Asked Questions
1. What is the projected Compound Annual Growth Rate (CAGR) of the Functional Brain Imaging?
The projected CAGR is approximately 7.2%.
2. Which companies are prominent players in the Functional Brain Imaging?
Key companies in the market include Philips, General Electric, Canon Medical Systems, EB Neuro, MinFound Medical Systems, Neurosoft, Medtronic, Nihon Kohden, Hitachi Medical Systems, Elekta.
3. What are the main segments of the Functional Brain Imaging?
The market segments include Application, Types.
4. Can you provide details about the market size?
The market size is estimated to be USD 5.08 billion as of 2022.
5. What are some drivers contributing to market growth?
N/A
6. What are the notable trends driving market growth?
N/A
7. Are there any restraints impacting market growth?
N/A
8. Can you provide examples of recent developments in the market?
N/A
9. What pricing options are available for accessing the report?
Pricing options include single-user, multi-user, and enterprise licenses priced at USD 3350.00, USD 5025.00, and USD 6700.00 respectively.
10. Is the market size provided in terms of value or volume?
The market size is provided in terms of value, measured in billion and volume, measured in K.
11. Are there any specific market keywords associated with the report?
Yes, the market keyword associated with the report is "Functional Brain Imaging," which aids in identifying and referencing the specific market segment covered.
12. How do I determine which pricing option suits my needs best?
The pricing options vary based on user requirements and access needs. Individual users may opt for single-user licenses, while businesses requiring broader access may choose multi-user or enterprise licenses for cost-effective access to the report.
13. Are there any additional resources or data provided in the Functional Brain Imaging report?
While the report offers comprehensive insights, it's advisable to review the specific contents or supplementary materials provided to ascertain if additional resources or data are available.
14. How can I stay updated on further developments or reports in the Functional Brain Imaging?
To stay informed about further developments, trends, and reports in the Functional Brain Imaging, consider subscribing to industry newsletters, following relevant companies and organizations, or regularly checking reputable industry news sources and publications.
Methodology
Step 1 - Identification of Relevant Samples Size from Population Database


Step 2 - Approaches for Defining Global Market Size (Value, Volume* & Price*)

Note*: In applicable scenarios
Step 3 - Data Sources
Primary Research
- Web Analytics
- Survey Reports
- Research Institute
- Latest Research Reports
- Opinion Leaders
Secondary Research
- Annual Reports
- White Paper
- Latest Press Release
- Industry Association
- Paid Database
- Investor Presentations

Step 4 - Data Triangulation
Involves using different sources of information in order to increase the validity of a study
These sources are likely to be stakeholders in a program - participants, other researchers, program staff, other community members, and so on.
Then we put all data in single framework & apply various statistical tools to find out the dynamic on the market.
During the analysis stage, feedback from the stakeholder groups would be compared to determine areas of agreement as well as areas of divergence