

Key Insights
The global gemstones market, valued at $12.7 billion in the base year of 2025, is projected for significant expansion. Driven by a Compound Annual Growth Rate (CAGR) of 6.3%, the market is anticipated to reach substantial figures by 2033. This growth is attributed to rising disposable incomes in emerging economies, increased consumer preference for personalized and ethically sourced jewelry, and the burgeoning e-commerce sector. Online retail channels are experiencing notable growth, complementing traditional offline sales. Key product segments include rings, necklaces, earrings, and bracelets, with chains and pendants also showing strong performance. Despite challenges such as price volatility and supply chain risks, innovation in design, technology, and marketing by leading companies, including The Swatch Group AG, PANDORA, and LVMH, ensures a positive market outlook. Geographically, North America and Asia Pacific dominate market share, with emerging markets within these regions and expanding presence in Europe and South America poised to be significant growth contributors.
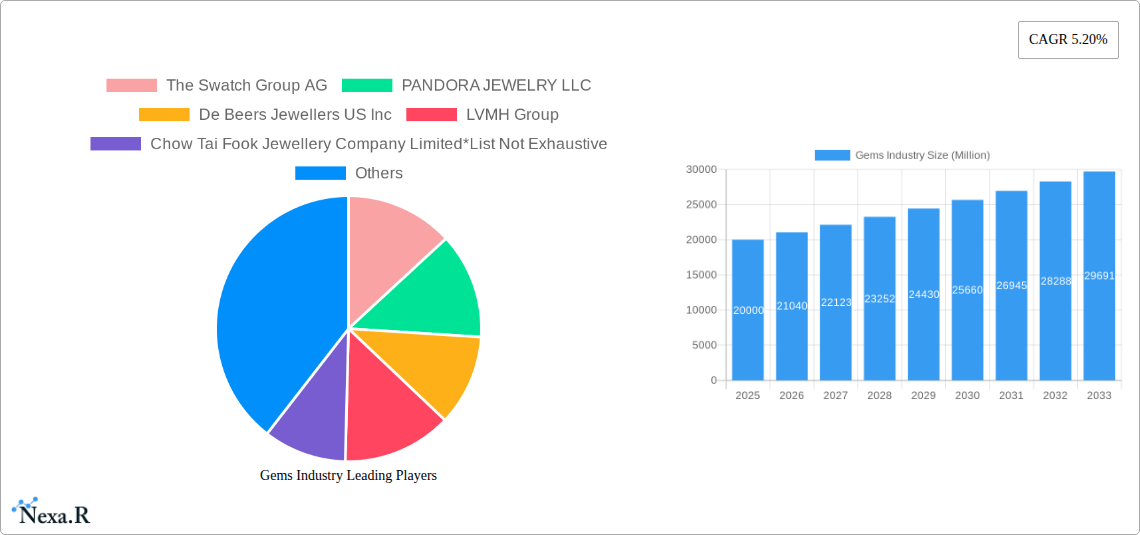
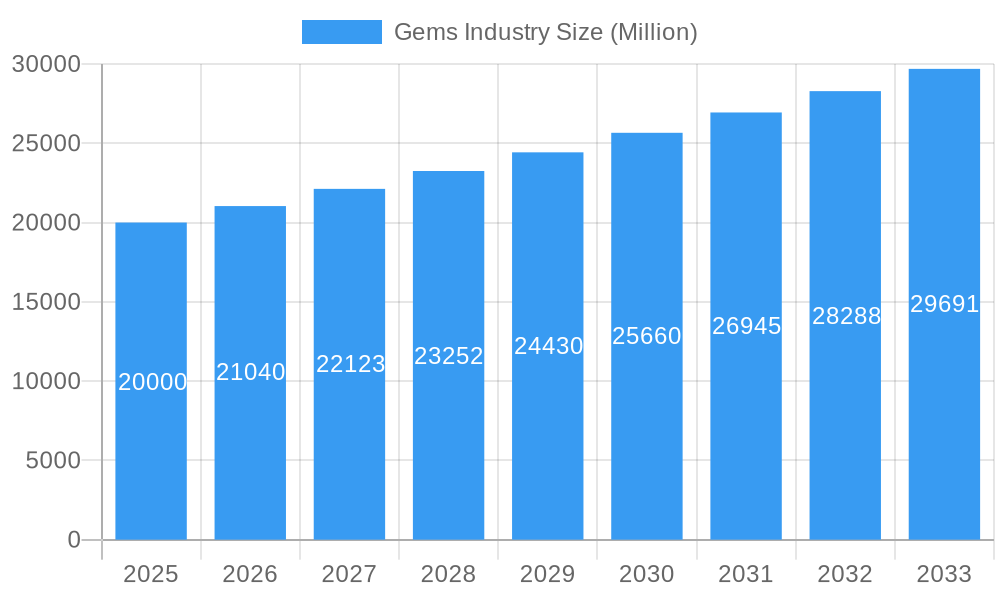
Gems Industry Market Size (In Billion)
Market segmentation by product type highlights consistent demand for rings, necklaces, and earrings, reflecting enduring consumer appeal for classic designs. The "Other Product Types" segment presents a notable opportunity for growth through unique and customized offerings. The dual presence of online and offline retail channels underscores a comprehensive customer outreach strategy by industry participants. The competitive environment features a blend of established luxury brands and agile new entrants, fostering innovation and intense competition. Continuous adaptation to evolving consumer demands and technological advancements will be crucial for market players to sustain their competitive edge and leverage emerging opportunities.
Gems Industry Company Market Share
Gems Industry Market Report: 2019-2033
This comprehensive report provides a detailed analysis of the Gems Industry, encompassing market dynamics, growth trends, key players, and future outlook. The study period covers 2019-2033, with a base year of 2025 and a forecast period of 2025-2033. The report delves into parent markets (Luxury Goods, Fashion Accessories) and child markets (Fine Jewelry, Costume Jewelry, etc.) to offer a holistic perspective. The report's value is in Million units.
Gems Industry Market Dynamics & Structure
The global gems industry is a dynamic market characterized by high concentration among major players and continuous technological innovation. Regulatory frameworks, including those related to ethical sourcing and environmental sustainability, play a significant role. Competitive pressures from product substitutes, such as imitation jewelry, are also significant. End-user demographics, particularly the preferences of millennials and Gen Z, are shaping demand. Mergers and acquisitions (M&A) activity is common, with major players consolidating their market positions.
- Market Concentration: The top 10 players hold approximately xx% of the global market share in 2025.
- Technological Innovation: 3D printing and lab-grown diamonds are transforming manufacturing processes and impacting pricing.
- Regulatory Frameworks: Increasingly stringent regulations regarding ethical sourcing and conflict-free diamonds are influencing supply chains.
- Competitive Product Substitutes: Imitation jewelry and other fashion accessories present competitive pressure.
- End-User Demographics: Millennials and Gen Z show a growing preference for personalized and sustainable jewelry.
- M&A Trends: The number of M&A deals in the industry averaged xx per year between 2019 and 2024, with a projected increase to xx per year during 2025-2033. The total value of these deals exceeded xx million during the historical period.
Gems Industry Growth Trends & Insights
The gems industry has witnessed robust growth in recent years. The market size, valued at xx million in 2024, is projected to reach xx million by 2033, exhibiting a CAGR of xx% during the forecast period. This growth is fueled by factors including increasing disposable incomes in emerging markets, a growing preference for luxury goods, and the rise of e-commerce. Technological disruptions, like lab-grown diamonds, are influencing pricing and consumer perceptions. Consumer behavior is shifting towards personalized, ethically sourced, and sustainable jewelry.
Dominant Regions, Countries, or Segments in Gems Industry
The North American and Asian markets are currently the dominant regions for the gems industry, with North America leading in per capita spending and Asia exhibiting high volume growth. Within product types, rings and necklaces represent the largest segments, while online retail stores are gaining market share over traditional offline retail channels.
- Key Drivers by Region:
- North America: Strong consumer spending, established luxury market.
- Asia: Rapid economic growth, increasing disposable incomes, cultural significance of jewelry.
- Key Drivers by Product Type:
- Rings & Necklaces: High demand across all demographics and occasions.
- Key Drivers by Distribution Channel:
- Online Retail: Convenience, wider selection, competitive pricing.
Gems Industry Product Landscape
The gems industry offers a wide range of products, from precious gemstone jewelry to fashion jewelry, with continuous innovation in design and materials. Lab-grown diamonds and other sustainable alternatives are gaining popularity, while technological advancements are enhancing production efficiency and product customization. Unique selling propositions frequently include ethically sourced materials, unique design aesthetics, and craftsmanship.
Key Drivers, Barriers & Challenges in Gems Industry
Key Drivers:
- Increasing disposable incomes globally
- Growing demand for luxury goods
- Rise of e-commerce
- Technological advancements in production and design
Key Challenges:
- Supply chain disruptions, particularly for ethically sourced gemstones
- Fluctuations in gemstone prices
- Intense competition
- Counterfeit products
- xx million in losses due to supply chain issues in 2024.
Emerging Opportunities in Gems Industry
The industry presents exciting opportunities in personalized jewelry design, the growing market for sustainable and ethically sourced gems, expansion into emerging markets, and leveraging technological innovations like augmented reality for virtual try-ons. Untapped markets in certain regions and the development of unique jewelry infused with technology are also promising avenues.
Growth Accelerators in the Gems Industry Industry
Strategic partnerships between jewelry manufacturers and technology companies, expansion into new markets through e-commerce, and the development of innovative, sustainable jewelry designs will accelerate the industry's growth over the next decade. Breakthroughs in lab-grown diamond technology also present significant potential.
Key Players Shaping the Gems Industry Market
- The Swatch Group AG
- PANDORA JEWELRY LLC
- De Beers Jewellers US Inc
- LVMH Group
- Chow Tai Fook Jewellery Company Limited
- Richemont SA
- Swarovski Crystal Online AG
- Chow Tai Fook Jewelry Company Limited
- Tata Sons Private Ltd
- Signet Jewelers
Notable Milestones in Gems Industry Sector
- August 2022: Pandora launched 'Pandora Brilliance,' a line of lab-grown diamonds.
- August 2022: Louis Vuitton launched its Empreinte Fine Jewelry collection.
- September 2022: Tanishq launched its 'The Chola' collection inspired by Indian history.
In-Depth Gems Industry Market Outlook
The gems industry is poised for sustained growth driven by continued technological advancements, increasing consumer spending, and evolving consumer preferences toward personalized and sustainable products. Strategic partnerships and expansion into new markets will further accelerate this growth. The market's future holds significant potential for innovation and expansion.
Gems Industry Segmentation
-
1. Product Type
- 1.1. Rings
- 1.2. Necklaces
- 1.3. Earrings
- 1.4. Bracelets
- 1.5. Chains and Pendants
- 1.6. Other Product Types
-
2. Distribution Channel
- 2.1. Offline Retail Stores
- 2.2. Online Retail Stores
Gems Industry Segmentation By Geography
-
1. North America
- 1.1. United States
- 1.2. Canada
- 1.3. Mexico
- 1.4. Rest of North America
-
2. Europe
- 2.1. Spain
- 2.2. United Kingdom
- 2.3. France
- 2.4. Germany
- 2.5. Russia
- 2.6. Italy
- 2.7. Rest of Europe
-
3. Asia Pacific
- 3.1. China
- 3.2. Japan
- 3.3. India
- 3.4. Australia
- 3.5. Rest of Asia Pacific
-
4. South America
- 4.1. Brazil
- 4.2. Argentina
- 4.3. Rest of South America
-
5. Middle East and Africa
- 5.1. South Africa
- 5.2. United Arab Emirates
- 5.3. Rest of Middle East and Africa
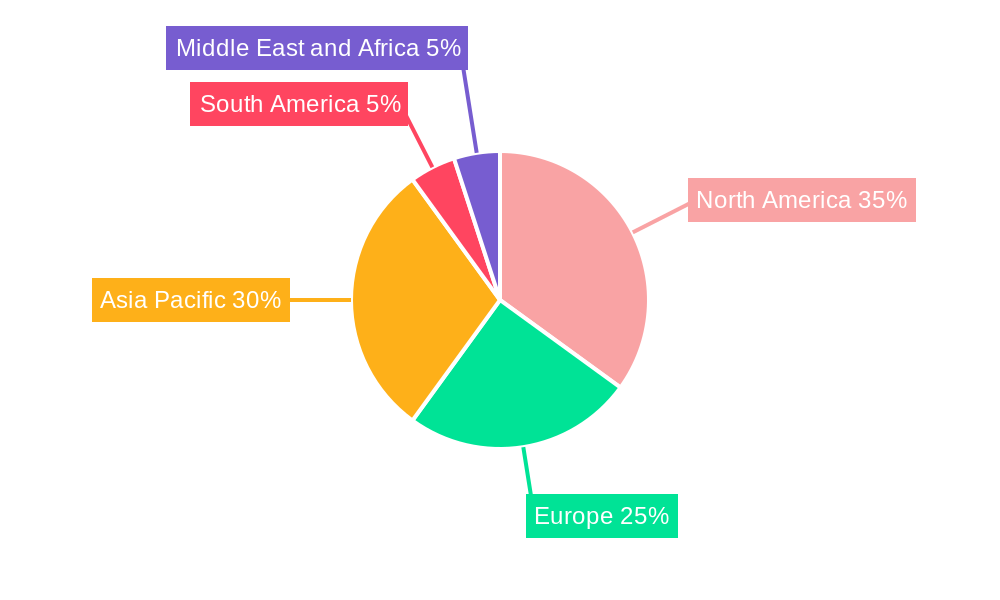
Gems Industry Regional Market Share
Geographic Coverage of Gems Industry
Gems Industry REPORT HIGHLIGHTS
| Aspects | Details |
|---|---|
| Study Period | 2020-2034 |
| Base Year | 2025 |
| Estimated Year | 2026 |
| Forecast Period | 2026-2034 |
| Historical Period | 2020-2025 |
| Growth Rate | CAGR of 6.3% from 2020-2034 |
| Segmentation |
|
Table of Contents
- 1. Introduction
- 1.1. Research Scope
- 1.2. Market Segmentation
- 1.3. Research Objective
- 1.4. Definitions and Assumptions
- 2. Executive Summary
- 2.1. Market Snapshot
- 3. Market Dynamics
- 3.1. Market Drivers
- 3.2. Market Restrains
- 3.3. Market Trends
- 3.4. Market Opportunities
- 4. Market Factor Analysis
- 4.1. Porters Five Forces
- 4.1.1. Bargaining Power of Suppliers
- 4.1.2. Bargaining Power of Buyers
- 4.1.3. Threat of New Entrants
- 4.1.4. Threat of Substitutes
- 4.1.5. Competitive Rivalry
- 4.2. PESTEL analysis
- 4.3. BCG Analysis
- 4.3.1. Stars (High Growth, High Market Share)
- 4.3.2. Cash Cows (Low Growth, High Market Share)
- 4.3.3. Question Mark (High Growth, Low Market Share)
- 4.3.4. Dogs (Low Growth, Low Market Share)
- 4.4. Ansoff Matrix Analysis
- 4.5. Supply Chain Analysis
- 4.6. Regulatory Landscape
- 4.7. Current Market Potential and Opportunity Assessment (TAM–SAM–SOM Framework)
- 4.8. NRP Analyst Note
- 4.1. Porters Five Forces
- 5. Market Analysis, Insights and Forecast 2021-2033
- 5.1. Market Analysis, Insights and Forecast - by Product Type
- 5.1.1. Rings
- 5.1.2. Necklaces
- 5.1.3. Earrings
- 5.1.4. Bracelets
- 5.1.5. Chains and Pendants
- 5.1.6. Other Product Types
- 5.2. Market Analysis, Insights and Forecast - by Distribution Channel
- 5.2.1. Offline Retail Stores
- 5.2.2. Online Retail Stores
- 5.3. Market Analysis, Insights and Forecast - by Region
- 5.3.1. North America
- 5.3.2. Europe
- 5.3.3. Asia Pacific
- 5.3.4. South America
- 5.3.5. Middle East and Africa
- 5.1. Market Analysis, Insights and Forecast - by Product Type
- 6. Global Gems Industry Analysis, Insights and Forecast, 2021-2033
- 6.1. Market Analysis, Insights and Forecast - by Product Type
- 6.1.1. Rings
- 6.1.2. Necklaces
- 6.1.3. Earrings
- 6.1.4. Bracelets
- 6.1.5. Chains and Pendants
- 6.1.6. Other Product Types
- 6.2. Market Analysis, Insights and Forecast - by Distribution Channel
- 6.2.1. Offline Retail Stores
- 6.2.2. Online Retail Stores
- 6.1. Market Analysis, Insights and Forecast - by Product Type
- 7. North America Gems Industry Analysis, Insights and Forecast, 2020-2032
- 7.1. Market Analysis, Insights and Forecast - by Product Type
- 7.1.1. Rings
- 7.1.2. Necklaces
- 7.1.3. Earrings
- 7.1.4. Bracelets
- 7.1.5. Chains and Pendants
- 7.1.6. Other Product Types
- 7.2. Market Analysis, Insights and Forecast - by Distribution Channel
- 7.2.1. Offline Retail Stores
- 7.2.2. Online Retail Stores
- 7.1. Market Analysis, Insights and Forecast - by Product Type
- 8. Europe Gems Industry Analysis, Insights and Forecast, 2020-2032
- 8.1. Market Analysis, Insights and Forecast - by Product Type
- 8.1.1. Rings
- 8.1.2. Necklaces
- 8.1.3. Earrings
- 8.1.4. Bracelets
- 8.1.5. Chains and Pendants
- 8.1.6. Other Product Types
- 8.2. Market Analysis, Insights and Forecast - by Distribution Channel
- 8.2.1. Offline Retail Stores
- 8.2.2. Online Retail Stores
- 8.1. Market Analysis, Insights and Forecast - by Product Type
- 9. Asia Pacific Gems Industry Analysis, Insights and Forecast, 2020-2032
- 9.1. Market Analysis, Insights and Forecast - by Product Type
- 9.1.1. Rings
- 9.1.2. Necklaces
- 9.1.3. Earrings
- 9.1.4. Bracelets
- 9.1.5. Chains and Pendants
- 9.1.6. Other Product Types
- 9.2. Market Analysis, Insights and Forecast - by Distribution Channel
- 9.2.1. Offline Retail Stores
- 9.2.2. Online Retail Stores
- 9.1. Market Analysis, Insights and Forecast - by Product Type
- 10. South America Gems Industry Analysis, Insights and Forecast, 2020-2032
- 10.1. Market Analysis, Insights and Forecast - by Product Type
- 10.1.1. Rings
- 10.1.2. Necklaces
- 10.1.3. Earrings
- 10.1.4. Bracelets
- 10.1.5. Chains and Pendants
- 10.1.6. Other Product Types
- 10.2. Market Analysis, Insights and Forecast - by Distribution Channel
- 10.2.1. Offline Retail Stores
- 10.2.2. Online Retail Stores
- 10.1. Market Analysis, Insights and Forecast - by Product Type
- 11. Middle East and Africa Gems Industry Analysis, Insights and Forecast, 2020-2032
- 11.1. Market Analysis, Insights and Forecast - by Product Type
- 11.1.1. Rings
- 11.1.2. Necklaces
- 11.1.3. Earrings
- 11.1.4. Bracelets
- 11.1.5. Chains and Pendants
- 11.1.6. Other Product Types
- 11.2. Market Analysis, Insights and Forecast - by Distribution Channel
- 11.2.1. Offline Retail Stores
- 11.2.2. Online Retail Stores
- 11.1. Market Analysis, Insights and Forecast - by Product Type
- 12. Competitive Analysis
- 12.1. Company Profiles
- 12.1.1 The Swatch Group AG
- 12.1.1.1. Company Overview
- 12.1.1.2. Products
- 12.1.1.3. Company Financials
- 12.1.1.4. SWOT Analysis
- 12.1.2 PANDORA JEWELRY LLC
- 12.1.2.1. Company Overview
- 12.1.2.2. Products
- 12.1.2.3. Company Financials
- 12.1.2.4. SWOT Analysis
- 12.1.3 De Beers Jewellers US Inc
- 12.1.3.1. Company Overview
- 12.1.3.2. Products
- 12.1.3.3. Company Financials
- 12.1.3.4. SWOT Analysis
- 12.1.4 LVMH Group
- 12.1.4.1. Company Overview
- 12.1.4.2. Products
- 12.1.4.3. Company Financials
- 12.1.4.4. SWOT Analysis
- 12.1.5 Chow Tai Fook Jewellery Company Limited*List Not Exhaustive
- 12.1.5.1. Company Overview
- 12.1.5.2. Products
- 12.1.5.3. Company Financials
- 12.1.5.4. SWOT Analysis
- 12.1.6 Richemont SA
- 12.1.6.1. Company Overview
- 12.1.6.2. Products
- 12.1.6.3. Company Financials
- 12.1.6.4. SWOT Analysis
- 12.1.7 Swarovski Crystal Online AG
- 12.1.7.1. Company Overview
- 12.1.7.2. Products
- 12.1.7.3. Company Financials
- 12.1.7.4. SWOT Analysis
- 12.1.8 Chow Tai Fook Jewelry Company Limited
- 12.1.8.1. Company Overview
- 12.1.8.2. Products
- 12.1.8.3. Company Financials
- 12.1.8.4. SWOT Analysis
- 12.1.9 Tata Sons Private Ltd
- 12.1.9.1. Company Overview
- 12.1.9.2. Products
- 12.1.9.3. Company Financials
- 12.1.9.4. SWOT Analysis
- 12.1.10 Signet Jewelers
- 12.1.10.1. Company Overview
- 12.1.10.2. Products
- 12.1.10.3. Company Financials
- 12.1.10.4. SWOT Analysis
- 12.1.1 The Swatch Group AG
- 12.2. Market Entropy
- 12.2.1 Company's Key Areas Served
- 12.2.2 Recent Developments
- 12.3. Company Market Share Analysis 2025
- 12.3.1 Top 5 Companies Market Share Analysis
- 12.3.2 Top 3 Companies Market Share Analysis
- 12.4. List of Potential Customers
- 13. Research Methodology
List of Figures
- Figure 1: Global Gems Industry Revenue Breakdown (billion, %) by Region 2025 & 2033
- Figure 2: North America Gems Industry Revenue (billion), by Product Type 2025 & 2033
- Figure 3: North America Gems Industry Revenue Share (%), by Product Type 2025 & 2033
- Figure 4: North America Gems Industry Revenue (billion), by Distribution Channel 2025 & 2033
- Figure 5: North America Gems Industry Revenue Share (%), by Distribution Channel 2025 & 2033
- Figure 6: North America Gems Industry Revenue (billion), by Country 2025 & 2033
- Figure 7: North America Gems Industry Revenue Share (%), by Country 2025 & 2033
- Figure 8: Europe Gems Industry Revenue (billion), by Product Type 2025 & 2033
- Figure 9: Europe Gems Industry Revenue Share (%), by Product Type 2025 & 2033
- Figure 10: Europe Gems Industry Revenue (billion), by Distribution Channel 2025 & 2033
- Figure 11: Europe Gems Industry Revenue Share (%), by Distribution Channel 2025 & 2033
- Figure 12: Europe Gems Industry Revenue (billion), by Country 2025 & 2033
- Figure 13: Europe Gems Industry Revenue Share (%), by Country 2025 & 2033
- Figure 14: Asia Pacific Gems Industry Revenue (billion), by Product Type 2025 & 2033
- Figure 15: Asia Pacific Gems Industry Revenue Share (%), by Product Type 2025 & 2033
- Figure 16: Asia Pacific Gems Industry Revenue (billion), by Distribution Channel 2025 & 2033
- Figure 17: Asia Pacific Gems Industry Revenue Share (%), by Distribution Channel 2025 & 2033
- Figure 18: Asia Pacific Gems Industry Revenue (billion), by Country 2025 & 2033
- Figure 19: Asia Pacific Gems Industry Revenue Share (%), by Country 2025 & 2033
- Figure 20: South America Gems Industry Revenue (billion), by Product Type 2025 & 2033
- Figure 21: South America Gems Industry Revenue Share (%), by Product Type 2025 & 2033
- Figure 22: South America Gems Industry Revenue (billion), by Distribution Channel 2025 & 2033
- Figure 23: South America Gems Industry Revenue Share (%), by Distribution Channel 2025 & 2033
- Figure 24: South America Gems Industry Revenue (billion), by Country 2025 & 2033
- Figure 25: South America Gems Industry Revenue Share (%), by Country 2025 & 2033
- Figure 26: Middle East and Africa Gems Industry Revenue (billion), by Product Type 2025 & 2033
- Figure 27: Middle East and Africa Gems Industry Revenue Share (%), by Product Type 2025 & 2033
- Figure 28: Middle East and Africa Gems Industry Revenue (billion), by Distribution Channel 2025 & 2033
- Figure 29: Middle East and Africa Gems Industry Revenue Share (%), by Distribution Channel 2025 & 2033
- Figure 30: Middle East and Africa Gems Industry Revenue (billion), by Country 2025 & 2033
- Figure 31: Middle East and Africa Gems Industry Revenue Share (%), by Country 2025 & 2033
List of Tables
- Table 1: Global Gems Industry Revenue billion Forecast, by Product Type 2020 & 2033
- Table 2: Global Gems Industry Revenue billion Forecast, by Distribution Channel 2020 & 2033
- Table 3: Global Gems Industry Revenue billion Forecast, by Region 2020 & 2033
- Table 4: Global Gems Industry Revenue billion Forecast, by Product Type 2020 & 2033
- Table 5: Global Gems Industry Revenue billion Forecast, by Distribution Channel 2020 & 2033
- Table 6: Global Gems Industry Revenue billion Forecast, by Country 2020 & 2033
- Table 7: United States Gems Industry Revenue (billion) Forecast, by Application 2020 & 2033
- Table 8: Canada Gems Industry Revenue (billion) Forecast, by Application 2020 & 2033
- Table 9: Mexico Gems Industry Revenue (billion) Forecast, by Application 2020 & 2033
- Table 10: Rest of North America Gems Industry Revenue (billion) Forecast, by Application 2020 & 2033
- Table 11: Global Gems Industry Revenue billion Forecast, by Product Type 2020 & 2033
- Table 12: Global Gems Industry Revenue billion Forecast, by Distribution Channel 2020 & 2033
- Table 13: Global Gems Industry Revenue billion Forecast, by Country 2020 & 2033
- Table 14: Spain Gems Industry Revenue (billion) Forecast, by Application 2020 & 2033
- Table 15: United Kingdom Gems Industry Revenue (billion) Forecast, by Application 2020 & 2033
- Table 16: France Gems Industry Revenue (billion) Forecast, by Application 2020 & 2033
- Table 17: Germany Gems Industry Revenue (billion) Forecast, by Application 2020 & 2033
- Table 18: Russia Gems Industry Revenue (billion) Forecast, by Application 2020 & 2033
- Table 19: Italy Gems Industry Revenue (billion) Forecast, by Application 2020 & 2033
- Table 20: Rest of Europe Gems Industry Revenue (billion) Forecast, by Application 2020 & 2033
- Table 21: Global Gems Industry Revenue billion Forecast, by Product Type 2020 & 2033
- Table 22: Global Gems Industry Revenue billion Forecast, by Distribution Channel 2020 & 2033
- Table 23: Global Gems Industry Revenue billion Forecast, by Country 2020 & 2033
- Table 24: China Gems Industry Revenue (billion) Forecast, by Application 2020 & 2033
- Table 25: Japan Gems Industry Revenue (billion) Forecast, by Application 2020 & 2033
- Table 26: India Gems Industry Revenue (billion) Forecast, by Application 2020 & 2033
- Table 27: Australia Gems Industry Revenue (billion) Forecast, by Application 2020 & 2033
- Table 28: Rest of Asia Pacific Gems Industry Revenue (billion) Forecast, by Application 2020 & 2033
- Table 29: Global Gems Industry Revenue billion Forecast, by Product Type 2020 & 2033
- Table 30: Global Gems Industry Revenue billion Forecast, by Distribution Channel 2020 & 2033
- Table 31: Global Gems Industry Revenue billion Forecast, by Country 2020 & 2033
- Table 32: Brazil Gems Industry Revenue (billion) Forecast, by Application 2020 & 2033
- Table 33: Argentina Gems Industry Revenue (billion) Forecast, by Application 2020 & 2033
- Table 34: Rest of South America Gems Industry Revenue (billion) Forecast, by Application 2020 & 2033
- Table 35: Global Gems Industry Revenue billion Forecast, by Product Type 2020 & 2033
- Table 36: Global Gems Industry Revenue billion Forecast, by Distribution Channel 2020 & 2033
- Table 37: Global Gems Industry Revenue billion Forecast, by Country 2020 & 2033
- Table 38: South Africa Gems Industry Revenue (billion) Forecast, by Application 2020 & 2033
- Table 39: United Arab Emirates Gems Industry Revenue (billion) Forecast, by Application 2020 & 2033
- Table 40: Rest of Middle East and Africa Gems Industry Revenue (billion) Forecast, by Application 2020 & 2033
Frequently Asked Questions
1. What is the projected Compound Annual Growth Rate (CAGR) of the Gems Industry?
The projected CAGR is approximately 6.3%.
2. Which companies are prominent players in the Gems Industry?
Key companies in the market include The Swatch Group AG, PANDORA JEWELRY LLC, De Beers Jewellers US Inc, LVMH Group, Chow Tai Fook Jewellery Company Limited*List Not Exhaustive, Richemont SA, Swarovski Crystal Online AG, Chow Tai Fook Jewelry Company Limited, Tata Sons Private Ltd, Signet Jewelers.
3. What are the main segments of the Gems Industry?
The market segments include Product Type, Distribution Channel.
4. Can you provide details about the market size?
The market size is estimated to be USD 12.7 billion as of 2022.
5. What are some drivers contributing to market growth?
Product Innovations to Drive Demand for Watches; Rising Demand for Premium Fashion Items.
6. What are the notable trends driving market growth?
Rising Demand for Gems & Jewellery Owing to the Emerging Middle Class.
7. Are there any restraints impacting market growth?
Presence of Counterfeit Products.
8. Can you provide examples of recent developments in the market?
September 2022: As an ode to the Chola Dynasty, which is considered a golden age of Indian history, Tanishq launched its new exclusive collection The Chola, which is an ode to the dynasty.
9. What pricing options are available for accessing the report?
Pricing options include single-user, multi-user, and enterprise licenses priced at USD 4750, USD 5250, and USD 8750 respectively.
10. Is the market size provided in terms of value or volume?
The market size is provided in terms of value, measured in billion.
11. Are there any specific market keywords associated with the report?
Yes, the market keyword associated with the report is "Gems Industry," which aids in identifying and referencing the specific market segment covered.
12. How do I determine which pricing option suits my needs best?
The pricing options vary based on user requirements and access needs. Individual users may opt for single-user licenses, while businesses requiring broader access may choose multi-user or enterprise licenses for cost-effective access to the report.
13. Are there any additional resources or data provided in the Gems Industry report?
While the report offers comprehensive insights, it's advisable to review the specific contents or supplementary materials provided to ascertain if additional resources or data are available.
14. How can I stay updated on further developments or reports in the Gems Industry?
To stay informed about further developments, trends, and reports in the Gems Industry, consider subscribing to industry newsletters, following relevant companies and organizations, or regularly checking reputable industry news sources and publications.
Methodology
Step 1 - Identification of Relevant Samples Size from Population Database


Step 2 - Approaches for Defining Global Market Size (Value, Volume* & Price*)

Note*: In applicable scenarios
Step 3 - Data Sources
Primary Research
- Web Analytics
- Survey Reports
- Research Institute
- Latest Research Reports
- Opinion Leaders
Secondary Research
- Annual Reports
- White Paper
- Latest Press Release
- Industry Association
- Paid Database
- Investor Presentations

Step 4 - Data Triangulation
Involves using different sources of information in order to increase the validity of a study
These sources are likely to be stakeholders in a program - participants, other researchers, program staff, other community members, and so on.
Then we put all data in single framework & apply various statistical tools to find out the dynamic on the market.
During the analysis stage, feedback from the stakeholder groups would be compared to determine areas of agreement as well as areas of divergence