

Key Insights
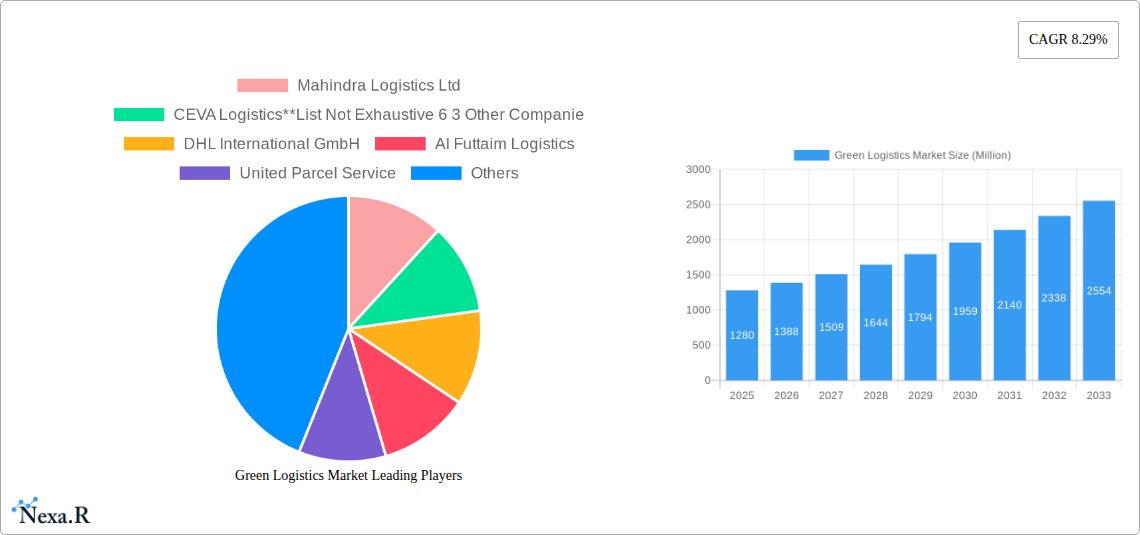
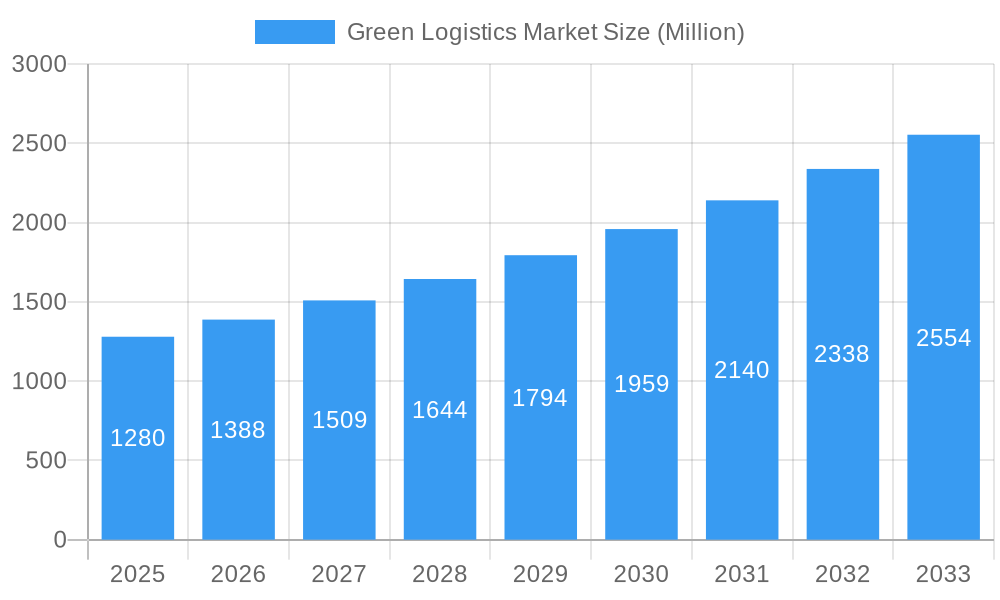
The global green logistics market, valued at $1.28 billion in 2025, is projected to experience robust growth, driven by increasing environmental concerns, stringent government regulations on carbon emissions, and the rising adoption of sustainable practices across various industries. The market's Compound Annual Growth Rate (CAGR) of 8.29% from 2025 to 2033 indicates significant expansion potential. Key growth drivers include the burgeoning e-commerce sector demanding efficient and eco-friendly delivery solutions, the increasing focus on reducing the carbon footprint of supply chains, and the rising adoption of alternative fuels and electric vehicles in transportation. Market segments like warehousing, distribution, and value-added services within the green logistics sector are experiencing particularly strong growth due to increased demand for optimized supply chain management that prioritizes sustainability. While challenges remain, such as the high initial investment required for green technologies and the lack of widespread infrastructure supporting sustainable logistics in certain regions, the overall trend points towards a considerable market expansion. The strong performance of major players like Mahindra Logistics, DHL, and UPS underscores the industry's maturity and future potential.
Green Logistics Market Market Size (In Billion)
The geographical distribution of the green logistics market reflects the varying levels of environmental awareness and regulatory frameworks across regions. North America and Europe are expected to maintain a significant market share due to well-established regulatory frameworks and higher consumer awareness of environmental issues. The Asia-Pacific region, especially India and China, is projected to experience significant growth driven by rapid industrialization and increasing investments in sustainable infrastructure. The LAMEA (Latin America, Middle East, and Africa) region presents a considerable opportunity for future growth, albeit at a potentially slower pace due to factors like infrastructure limitations and varying levels of regulatory support. The diverse range of end-users, including healthcare, manufacturing, automotive, and e-commerce, signifies the market's broad applicability and future potential. The continued development of innovative technologies, coupled with supportive government policies and increasing corporate social responsibility initiatives, will further propel the growth of the green logistics market.
Green Logistics Market Company Market Share
Green Logistics Market: A Comprehensive Report (2019-2033)
This comprehensive report provides a detailed analysis of the Green Logistics Market, encompassing market dynamics, growth trends, regional dominance, key players, and future outlook. With a study period spanning 2019-2033, a base year of 2025, and a forecast period of 2025-2033, this report offers invaluable insights for industry professionals, investors, and stakeholders seeking to navigate this rapidly evolving market. The report segments the market by end-user (Healthcare, Manufacturing, Automotive, Banking & Financial Services, Retail & E-commerce, Others), business type (Warehousing, Distribution, Value-Added Services), and mode of operation (Storage, Roadways Distribution, Seaways Distribution, Others). The total market size is projected to reach xx Million by 2033.
Green Logistics Market Dynamics & Structure
The Green Logistics Market is characterized by increasing market concentration, driven by mergers and acquisitions (M&A) among major players. While the market remains fragmented, larger companies are aggressively pursuing strategic acquisitions to expand their service offerings and geographic reach. Technological innovation, particularly in areas like electric vehicles, alternative fuels, and route optimization software, is a key driver of growth. Stringent environmental regulations and government incentives are further accelerating the adoption of green logistics solutions. However, high initial investment costs associated with green technologies and a lack of standardized infrastructure present significant barriers to entry and widespread adoption. The market is also witnessing the emergence of innovative business models, such as collaborative platforms and on-demand delivery services, which are enhancing efficiency and sustainability.
- Market Concentration: Moderately concentrated, with top 10 players holding approximately xx% market share in 2025.
- M&A Activity: An estimated xx M&A deals in the green logistics sector between 2019 and 2024, with an average deal value of xx Million.
- Technological Innovation: Significant investments in electric fleets, autonomous vehicles, and AI-powered route optimization.
- Regulatory Framework: Increasingly stringent emission regulations and carbon tax policies are creating a favorable environment for green logistics.
- Competitive Substitutes: Traditional logistics solutions continue to compete, but their market share is steadily declining.
- End-User Demographics: Growth is driven by a rising demand for sustainable supply chain solutions across various sectors.
Green Logistics Market Growth Trends & Insights
The Green Logistics Market has witnessed robust growth over the past few years, driven by heightened environmental concerns, evolving consumer preferences, and supportive government policies. The market is projected to experience a Compound Annual Growth Rate (CAGR) of xx% during the forecast period (2025-2033). This growth is fueled by increasing adoption of eco-friendly transportation modes, technological advancements enabling efficient resource utilization, and the shift towards sustainable business practices across industries. The market penetration rate for green logistics solutions is expected to increase from xx% in 2025 to xx% by 2033. Technological disruptions such as the rise of autonomous vehicles and the implementation of blockchain technology for enhanced supply chain transparency are further accelerating market growth. Consumer demand for ethically sourced products and environmentally conscious delivery options is also playing a significant role.
Dominant Regions, Countries, or Segments in Green Logistics Market
North America currently spearheads the green logistics sector, propelled by robust government backing for sustainability initiatives and a high propensity among businesses to adopt eco-friendly technologies. Simultaneously, the Asia-Pacific region is poised for the most dynamic growth throughout the forecast period, fueled by rapid economic expansion, escalating industrialization, and substantial investments in green infrastructure. Within specific segments, the Retail & E-commerce sector stands out as a primary growth engine, directly attributable to the surge in online shopping and the consequent demand for highly efficient and environmentally conscious last-mile delivery solutions. The warehousing segment is also experiencing a pronounced expansion, as organizations increasingly prioritize the optimization of their storage facilities to curtail their environmental footprint.
- Key Drivers (North America): Stringent emission regulations, comprehensive government incentives, and a pronounced consumer awareness regarding environmental impact.
- Key Drivers (Asia-Pacific): Accelerated economic growth, escalating industrialization, and growing commitments to investing in renewable energy infrastructure.
- Dominant End-User Segment: Retail & E-commerce, projected to hold a significant market share of approximately XX% by 2025, underscoring its pivotal role.
- Dominant Business Type: Warehousing, anticipated to contribute a substantial **XX%** of the total market revenue in 2025, reflecting its increasing importance.
- Dominant Mode of Operation: Roadways Distribution, expected to command an estimated **XX%** of the market share in 2025, highlighting its continued prevalence.
Green Logistics Market Product Landscape
The green logistics market boasts a rich and diverse portfolio of products and services meticulously designed to minimize environmental impact across the entire supply chain. This includes a spectrum of offerings such as advanced electric vehicles (EVs), versatile alternative fuel vehicles (AFVs), intelligent optimized routing software, and innovative sustainable packaging solutions. These offerings are engineered not only to reduce carbon emissions but also to significantly enhance operational efficiency and fuel economy. Furthermore, the landscape is being shaped by the emergence of cutting-edge technologies like drone delivery and autonomous vehicles, which are opening up novel avenues for truly sustainable logistics operations. The inherent value proposition of these products is consistently centered on their ability to deliver reduced emissions, superior fuel efficiency, and augmented operational performance.
Key Drivers, Barriers & Challenges in Green Logistics Market
Key Drivers:
- Growing environmental concerns and increasing pressure to reduce carbon footprint.
- Stringent government regulations and incentives promoting green logistics.
- Technological advancements enabling efficient and sustainable operations.
- Rising consumer demand for eco-friendly products and services.
Key Challenges:
- High initial investment costs associated with green technologies.
- Lack of standardized infrastructure for alternative fuels and electric vehicles.
- Limited availability of skilled workforce specializing in green logistics solutions.
- Interoperability challenges between different green logistics systems. This results in a xx Million loss annually.
Emerging Opportunities in Green Logistics Market
The green logistics market is ripe with burgeoning opportunities, notably in the expansion of last-mile delivery solutions that leverage electric vehicles and eco-friendly cargo bikes. There's a growing trend towards the adoption of sustainable packaging materials, alongside the continuous development of sophisticated route optimization software. Emerging markets in developing economies, particularly those witnessing a robust growth in their e-commerce sectors, present considerable untapped potential. Moreover, the strategic integration of blockchain technology offers a significant avenue for enhancing supply chain transparency and traceability, further contributing to the market's evolution.
Growth Accelerators in the Green Logistics Market Industry
Long-term growth in the green logistics market will be driven by technological breakthroughs in areas such as battery technology and autonomous vehicles, leading to further cost reductions and efficiency improvements. Strategic partnerships between logistics providers and technology companies are also crucial for innovation and market penetration. Expanding into new markets, particularly in developing economies, along with increased investment in research and development, will also fuel market expansion.
Key Players Shaping the Green Logistics Market Market
- Mahindra Logistics Ltd
- CEVA Logistics
- DHL International GmbH
- AI Futtaim Logistics
- United Parcel Service
- Yusen Logistics Co Ltd
- GEODIS
- XPO Logistics
- Agility Public Warehousing Company K S C P
- Bollore Logistics
- Bowling Green Logistics
- 6 Other Companies
Notable Milestones in Green Logistics Market Sector
- 2020: Witnessed the strategic deployment of multiple large-scale electric vehicle fleets by leading logistics enterprises, signaling a commitment to cleaner transportation.
- 2021: Marked by a substantial upswing in investments funnelled into burgeoning green logistics technology startups, fostering innovation and growth.
- 2022: Saw several governments enacting and enforcing more stringent emission regulations specifically targeting the transportation sector, driving industry-wide change.
- 2023: Characterized by the successful launch of a variety of innovative route optimization software solutions, enhancing efficiency and sustainability in logistics planning.
In-Depth Green Logistics Market Market Outlook
The green logistics market is poised for continued growth, fueled by increasing demand for sustainable solutions, technological advancements, and supportive government policies. Future growth will be driven by the expansion of electric vehicle fleets, the development of innovative logistics technologies, and the growing adoption of sustainable practices across various industries. Companies that strategically invest in green technologies and develop robust partnerships will be well-positioned to capitalize on the significant opportunities in this rapidly evolving market.
Green Logistics Market Segmentation
-
1. End User
- 1.1. Healthcare
- 1.2. Manufacturing
- 1.3. Automotive
- 1.4. Banking and Financial services
- 1.5. Retail and E-commerce
- 1.6. Others
-
2. Business Type
- 2.1. Warehousing
- 2.2. Distribution
- 2.3. Value-Added Services
-
3. Mode of Operation
- 3.1. Storage
- 3.2. Roadways Distribution
- 3.3. Seaways Distribution
- 3.4. Others
Green Logistics Market Segmentation By Geography
-
1. North America
- 1.1. US
- 1.2. Canada
- 1.3. Mexico
-
2. Europe
- 2.1. Germany
- 2.2. UK
- 2.3. France
- 2.4. Russia
- 2.5. Spain
- 2.6. Rest of Europe
-
3. Asia Pacific
- 3.1. India
- 3.2. China
- 3.3. Japan
- 3.4. South Korea
- 3.5. Rest of Asia Pacific
-
4. LAMEA
- 4.1. Latin America
- 4.2. Middle East
- 4.3. Africa
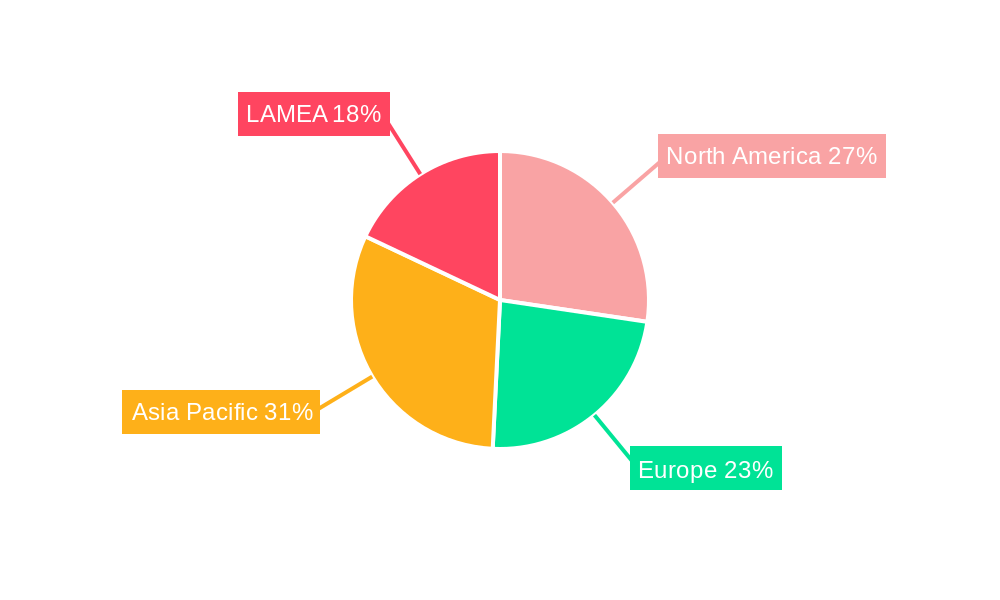
Green Logistics Market Regional Market Share
Geographic Coverage of Green Logistics Market
Green Logistics Market REPORT HIGHLIGHTS
| Aspects | Details |
|---|---|
| Study Period | 2020-2034 |
| Base Year | 2025 |
| Estimated Year | 2026 |
| Forecast Period | 2026-2034 |
| Historical Period | 2020-2025 |
| Growth Rate | CAGR of 8.29% from 2020-2034 |
| Segmentation |
|
Table of Contents
- 1. Introduction
- 1.1. Research Scope
- 1.2. Market Segmentation
- 1.3. Research Objective
- 1.4. Definitions and Assumptions
- 2. Executive Summary
- 2.1. Market Snapshot
- 3. Market Dynamics
- 3.1. Market Drivers
- 3.2. Market Restrains
- 3.3. Market Trends
- 3.4. Market Opportunities
- 4. Market Factor Analysis
- 4.1. Porters Five Forces
- 4.1.1. Bargaining Power of Suppliers
- 4.1.2. Bargaining Power of Buyers
- 4.1.3. Threat of New Entrants
- 4.1.4. Threat of Substitutes
- 4.1.5. Competitive Rivalry
- 4.2. PESTEL analysis
- 4.3. BCG Analysis
- 4.3.1. Stars (High Growth, High Market Share)
- 4.3.2. Cash Cows (Low Growth, High Market Share)
- 4.3.3. Question Mark (High Growth, Low Market Share)
- 4.3.4. Dogs (Low Growth, Low Market Share)
- 4.4. Ansoff Matrix Analysis
- 4.5. Supply Chain Analysis
- 4.6. Regulatory Landscape
- 4.7. Current Market Potential and Opportunity Assessment (TAM–SAM–SOM Framework)
- 4.8. NRP Analyst Note
- 4.1. Porters Five Forces
- 5. Market Analysis, Insights and Forecast 2021-2033
- 5.1. Market Analysis, Insights and Forecast - by End User
- 5.1.1. Healthcare
- 5.1.2. Manufacturing
- 5.1.3. Automotive
- 5.1.4. Banking and Financial services
- 5.1.5. Retail and E-commerce
- 5.1.6. Others
- 5.2. Market Analysis, Insights and Forecast - by Business Type
- 5.2.1. Warehousing
- 5.2.2. Distribution
- 5.2.3. Value-Added Services
- 5.3. Market Analysis, Insights and Forecast - by Mode of Operation
- 5.3.1. Storage
- 5.3.2. Roadways Distribution
- 5.3.3. Seaways Distribution
- 5.3.4. Others
- 5.4. Market Analysis, Insights and Forecast - by Region
- 5.4.1. North America
- 5.4.2. Europe
- 5.4.3. Asia Pacific
- 5.4.4. LAMEA
- 5.1. Market Analysis, Insights and Forecast - by End User
- 6. Green Logistics Market Analysis, Insights and Forecast, 2021-2033
- 6.1. Market Analysis, Insights and Forecast - by End User
- 6.1.1. Healthcare
- 6.1.2. Manufacturing
- 6.1.3. Automotive
- 6.1.4. Banking and Financial services
- 6.1.5. Retail and E-commerce
- 6.1.6. Others
- 6.2. Market Analysis, Insights and Forecast - by Business Type
- 6.2.1. Warehousing
- 6.2.2. Distribution
- 6.2.3. Value-Added Services
- 6.3. Market Analysis, Insights and Forecast - by Mode of Operation
- 6.3.1. Storage
- 6.3.2. Roadways Distribution
- 6.3.3. Seaways Distribution
- 6.3.4. Others
- 6.1. Market Analysis, Insights and Forecast - by End User
- 7. North America Green Logistics Market Analysis, Insights and Forecast, 2020-2032
- 7.1. Market Analysis, Insights and Forecast - by End User
- 7.1.1. Healthcare
- 7.1.2. Manufacturing
- 7.1.3. Automotive
- 7.1.4. Banking and Financial services
- 7.1.5. Retail and E-commerce
- 7.1.6. Others
- 7.2. Market Analysis, Insights and Forecast - by Business Type
- 7.2.1. Warehousing
- 7.2.2. Distribution
- 7.2.3. Value-Added Services
- 7.3. Market Analysis, Insights and Forecast - by Mode of Operation
- 7.3.1. Storage
- 7.3.2. Roadways Distribution
- 7.3.3. Seaways Distribution
- 7.3.4. Others
- 7.1. Market Analysis, Insights and Forecast - by End User
- 8. Europe Green Logistics Market Analysis, Insights and Forecast, 2020-2032
- 8.1. Market Analysis, Insights and Forecast - by End User
- 8.1.1. Healthcare
- 8.1.2. Manufacturing
- 8.1.3. Automotive
- 8.1.4. Banking and Financial services
- 8.1.5. Retail and E-commerce
- 8.1.6. Others
- 8.2. Market Analysis, Insights and Forecast - by Business Type
- 8.2.1. Warehousing
- 8.2.2. Distribution
- 8.2.3. Value-Added Services
- 8.3. Market Analysis, Insights and Forecast - by Mode of Operation
- 8.3.1. Storage
- 8.3.2. Roadways Distribution
- 8.3.3. Seaways Distribution
- 8.3.4. Others
- 8.1. Market Analysis, Insights and Forecast - by End User
- 9. Asia Pacific Green Logistics Market Analysis, Insights and Forecast, 2020-2032
- 9.1. Market Analysis, Insights and Forecast - by End User
- 9.1.1. Healthcare
- 9.1.2. Manufacturing
- 9.1.3. Automotive
- 9.1.4. Banking and Financial services
- 9.1.5. Retail and E-commerce
- 9.1.6. Others
- 9.2. Market Analysis, Insights and Forecast - by Business Type
- 9.2.1. Warehousing
- 9.2.2. Distribution
- 9.2.3. Value-Added Services
- 9.3. Market Analysis, Insights and Forecast - by Mode of Operation
- 9.3.1. Storage
- 9.3.2. Roadways Distribution
- 9.3.3. Seaways Distribution
- 9.3.4. Others
- 9.1. Market Analysis, Insights and Forecast - by End User
- 10. LAMEA Green Logistics Market Analysis, Insights and Forecast, 2020-2032
- 10.1. Market Analysis, Insights and Forecast - by End User
- 10.1.1. Healthcare
- 10.1.2. Manufacturing
- 10.1.3. Automotive
- 10.1.4. Banking and Financial services
- 10.1.5. Retail and E-commerce
- 10.1.6. Others
- 10.2. Market Analysis, Insights and Forecast - by Business Type
- 10.2.1. Warehousing
- 10.2.2. Distribution
- 10.2.3. Value-Added Services
- 10.3. Market Analysis, Insights and Forecast - by Mode of Operation
- 10.3.1. Storage
- 10.3.2. Roadways Distribution
- 10.3.3. Seaways Distribution
- 10.3.4. Others
- 10.1. Market Analysis, Insights and Forecast - by End User
- 11. Competitive Analysis
- 11.1. Company Profiles
- 11.1.1 Mahindra Logistics Ltd
- 11.1.1.1. Company Overview
- 11.1.1.2. Products
- 11.1.1.3. Company Financials
- 11.1.1.4. SWOT Analysis
- 11.1.2 CEVA Logistics**List Not Exhaustive 6 3 Other Companie
- 11.1.2.1. Company Overview
- 11.1.2.2. Products
- 11.1.2.3. Company Financials
- 11.1.2.4. SWOT Analysis
- 11.1.3 DHL International GmbH
- 11.1.3.1. Company Overview
- 11.1.3.2. Products
- 11.1.3.3. Company Financials
- 11.1.3.4. SWOT Analysis
- 11.1.4 AI Futtaim Logistics
- 11.1.4.1. Company Overview
- 11.1.4.2. Products
- 11.1.4.3. Company Financials
- 11.1.4.4. SWOT Analysis
- 11.1.5 United Parcel Service
- 11.1.5.1. Company Overview
- 11.1.5.2. Products
- 11.1.5.3. Company Financials
- 11.1.5.4. SWOT Analysis
- 11.1.6 Yusen Logistics Co Ltd
- 11.1.6.1. Company Overview
- 11.1.6.2. Products
- 11.1.6.3. Company Financials
- 11.1.6.4. SWOT Analysis
- 11.1.7 GEODIS
- 11.1.7.1. Company Overview
- 11.1.7.2. Products
- 11.1.7.3. Company Financials
- 11.1.7.4. SWOT Analysis
- 11.1.8 XPO Logistics
- 11.1.8.1. Company Overview
- 11.1.8.2. Products
- 11.1.8.3. Company Financials
- 11.1.8.4. SWOT Analysis
- 11.1.9 Agility Public Warehousing Company K S C P
- 11.1.9.1. Company Overview
- 11.1.9.2. Products
- 11.1.9.3. Company Financials
- 11.1.9.4. SWOT Analysis
- 11.1.10 Bollore Logistics
- 11.1.10.1. Company Overview
- 11.1.10.2. Products
- 11.1.10.3. Company Financials
- 11.1.10.4. SWOT Analysis
- 11.1.11 Bowling Green Logistics
- 11.1.11.1. Company Overview
- 11.1.11.2. Products
- 11.1.11.3. Company Financials
- 11.1.11.4. SWOT Analysis
- 11.1.1 Mahindra Logistics Ltd
- 11.2. Market Entropy
- 11.2.1 Company's Key Areas Served
- 11.2.2 Recent Developments
- 11.3. Company Market Share Analysis 2025
- 11.3.1 Top 5 Companies Market Share Analysis
- 11.3.2 Top 3 Companies Market Share Analysis
- 11.4. List of Potential Customers
- 12. Research Methodology
List of Figures
- Figure 1: Green Logistics Market Revenue Breakdown (Million, %) by Product 2025 & 2033
- Figure 2: Green Logistics Market Share (%) by Company 2025
List of Tables
- Table 1: Green Logistics Market Revenue Million Forecast, by End User 2020 & 2033
- Table 2: Green Logistics Market Revenue Million Forecast, by Business Type 2020 & 2033
- Table 3: Green Logistics Market Revenue Million Forecast, by Mode of Operation 2020 & 2033
- Table 4: Green Logistics Market Revenue Million Forecast, by Region 2020 & 2033
- Table 5: Green Logistics Market Revenue Million Forecast, by End User 2020 & 2033
- Table 6: Green Logistics Market Revenue Million Forecast, by Business Type 2020 & 2033
- Table 7: Green Logistics Market Revenue Million Forecast, by Mode of Operation 2020 & 2033
- Table 8: Green Logistics Market Revenue Million Forecast, by Country 2020 & 2033
- Table 9: US Green Logistics Market Revenue (Million) Forecast, by Application 2020 & 2033
- Table 10: Canada Green Logistics Market Revenue (Million) Forecast, by Application 2020 & 2033
- Table 11: Mexico Green Logistics Market Revenue (Million) Forecast, by Application 2020 & 2033
- Table 12: Green Logistics Market Revenue Million Forecast, by End User 2020 & 2033
- Table 13: Green Logistics Market Revenue Million Forecast, by Business Type 2020 & 2033
- Table 14: Green Logistics Market Revenue Million Forecast, by Mode of Operation 2020 & 2033
- Table 15: Green Logistics Market Revenue Million Forecast, by Country 2020 & 2033
- Table 16: Germany Green Logistics Market Revenue (Million) Forecast, by Application 2020 & 2033
- Table 17: UK Green Logistics Market Revenue (Million) Forecast, by Application 2020 & 2033
- Table 18: France Green Logistics Market Revenue (Million) Forecast, by Application 2020 & 2033
- Table 19: Russia Green Logistics Market Revenue (Million) Forecast, by Application 2020 & 2033
- Table 20: Spain Green Logistics Market Revenue (Million) Forecast, by Application 2020 & 2033
- Table 21: Rest of Europe Green Logistics Market Revenue (Million) Forecast, by Application 2020 & 2033
- Table 22: Green Logistics Market Revenue Million Forecast, by End User 2020 & 2033
- Table 23: Green Logistics Market Revenue Million Forecast, by Business Type 2020 & 2033
- Table 24: Green Logistics Market Revenue Million Forecast, by Mode of Operation 2020 & 2033
- Table 25: Green Logistics Market Revenue Million Forecast, by Country 2020 & 2033
- Table 26: India Green Logistics Market Revenue (Million) Forecast, by Application 2020 & 2033
- Table 27: China Green Logistics Market Revenue (Million) Forecast, by Application 2020 & 2033
- Table 28: Japan Green Logistics Market Revenue (Million) Forecast, by Application 2020 & 2033
- Table 29: South Korea Green Logistics Market Revenue (Million) Forecast, by Application 2020 & 2033
- Table 30: Rest of Asia Pacific Green Logistics Market Revenue (Million) Forecast, by Application 2020 & 2033
- Table 31: Green Logistics Market Revenue Million Forecast, by End User 2020 & 2033
- Table 32: Green Logistics Market Revenue Million Forecast, by Business Type 2020 & 2033
- Table 33: Green Logistics Market Revenue Million Forecast, by Mode of Operation 2020 & 2033
- Table 34: Green Logistics Market Revenue Million Forecast, by Country 2020 & 2033
- Table 35: Latin America Green Logistics Market Revenue (Million) Forecast, by Application 2020 & 2033
- Table 36: Middle East Green Logistics Market Revenue (Million) Forecast, by Application 2020 & 2033
- Table 37: Africa Green Logistics Market Revenue (Million) Forecast, by Application 2020 & 2033
Frequently Asked Questions
1. What is the projected Compound Annual Growth Rate (CAGR) of the Green Logistics Market?
The projected CAGR is approximately 8.29%.
2. Which companies are prominent players in the Green Logistics Market?
Key companies in the market include Mahindra Logistics Ltd, CEVA Logistics**List Not Exhaustive 6 3 Other Companie, DHL International GmbH, AI Futtaim Logistics, United Parcel Service, Yusen Logistics Co Ltd, GEODIS, XPO Logistics, Agility Public Warehousing Company K S C P, Bollore Logistics, Bowling Green Logistics.
3. What are the main segments of the Green Logistics Market?
The market segments include End User, Business Type, Mode of Operation.
4. Can you provide details about the market size?
The market size is estimated to be USD 1.28 Million as of 2022.
5. What are some drivers contributing to market growth?
Growing adoption of EVs in the logistics industry; Increase in adoption of artificial intelligence (AI) in the global logistics industry.
6. What are the notable trends driving market growth?
The Demand for Green Warehouses is Rising.
7. Are there any restraints impacting market growth?
Dependency on fossil fuels. majority for transportation; The high costs of implementing green procurement practices discourage potential investors.
8. Can you provide examples of recent developments in the market?
N/A
9. What pricing options are available for accessing the report?
Pricing options include single-user, multi-user, and enterprise licenses priced at USD 3800, USD 4500, and USD 5800 respectively.
10. Is the market size provided in terms of value or volume?
The market size is provided in terms of value, measured in Million.
11. Are there any specific market keywords associated with the report?
Yes, the market keyword associated with the report is "Green Logistics Market," which aids in identifying and referencing the specific market segment covered.
12. How do I determine which pricing option suits my needs best?
The pricing options vary based on user requirements and access needs. Individual users may opt for single-user licenses, while businesses requiring broader access may choose multi-user or enterprise licenses for cost-effective access to the report.
13. Are there any additional resources or data provided in the Green Logistics Market report?
While the report offers comprehensive insights, it's advisable to review the specific contents or supplementary materials provided to ascertain if additional resources or data are available.
14. How can I stay updated on further developments or reports in the Green Logistics Market?
To stay informed about further developments, trends, and reports in the Green Logistics Market, consider subscribing to industry newsletters, following relevant companies and organizations, or regularly checking reputable industry news sources and publications.
Methodology
Step 1 - Identification of Relevant Samples Size from Population Database


Step 2 - Approaches for Defining Global Market Size (Value, Volume* & Price*)

Note*: In applicable scenarios
Step 3 - Data Sources
Primary Research
- Web Analytics
- Survey Reports
- Research Institute
- Latest Research Reports
- Opinion Leaders
Secondary Research
- Annual Reports
- White Paper
- Latest Press Release
- Industry Association
- Paid Database
- Investor Presentations

Step 4 - Data Triangulation
Involves using different sources of information in order to increase the validity of a study
These sources are likely to be stakeholders in a program - participants, other researchers, program staff, other community members, and so on.
Then we put all data in single framework & apply various statistical tools to find out the dynamic on the market.
During the analysis stage, feedback from the stakeholder groups would be compared to determine areas of agreement as well as areas of divergence