

Key Insights
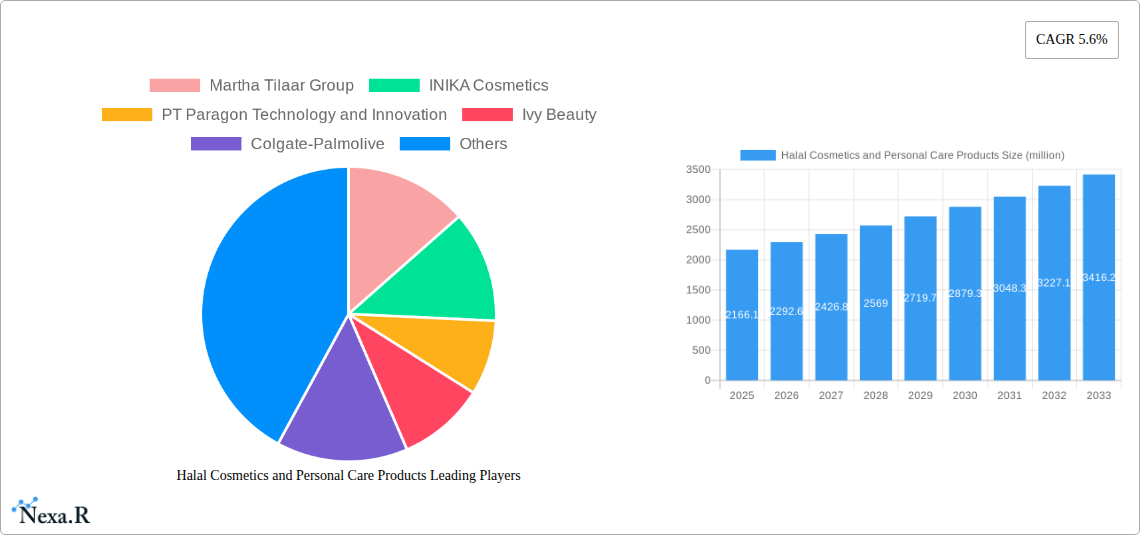
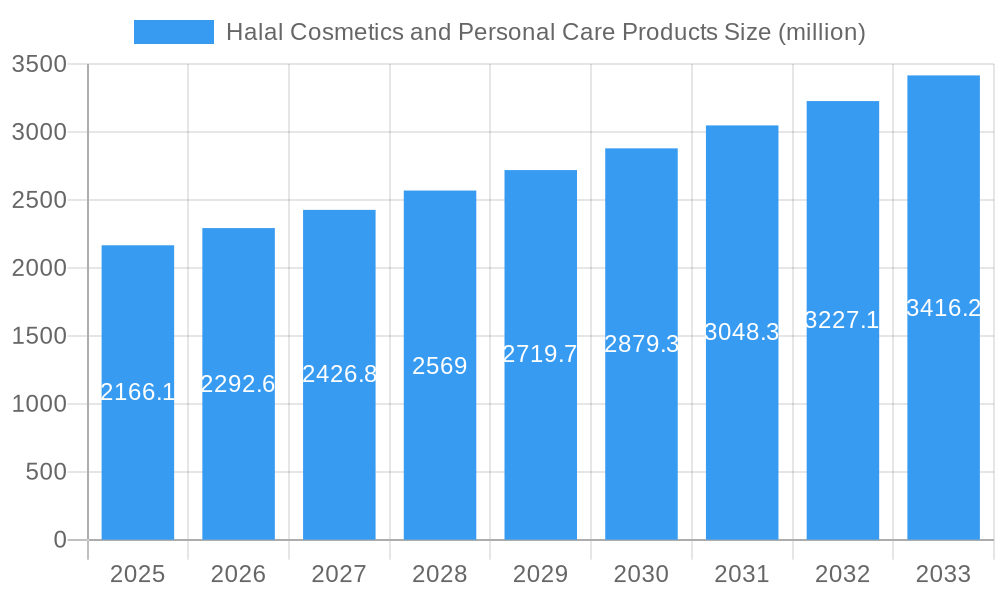
The Halal cosmetics and personal care products market, valued at $2166.1 million in 2025, is experiencing robust growth, projected to expand at a Compound Annual Growth Rate (CAGR) of 5.6% from 2025 to 2033. This surge is driven by the increasing global Muslim population, a rising awareness of natural and ethically sourced ingredients, and a growing demand for products aligning with Islamic principles. Key players like Martha Tilaar Group, INIKA Cosmetics, and PT Paragon Technology and Innovation are capitalizing on this trend, offering a diverse range of high-quality products catering to specific needs and preferences within the Halal consumer base. Furthermore, the market is witnessing a shift towards sustainable and eco-friendly formulations, further fueling its expansion. The increasing accessibility of online retail channels and a growing middle class in key emerging markets also contribute significantly to market growth. While regulatory challenges and variations in Halal certification standards across different regions present some hurdles, the overall market outlook remains positive. Innovation in product development, focusing on specific skin types and addressing consumer concerns, will be critical for sustained growth and success in this dynamic market segment.
Halal Cosmetics and Personal Care Products Market Size (In Billion)
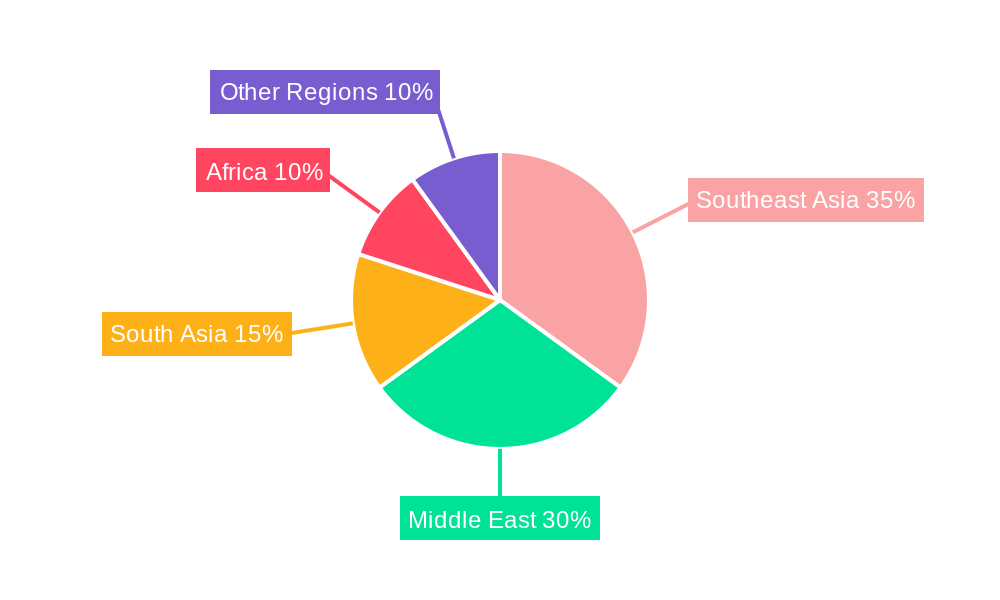
The competitive landscape is marked by a blend of established multinational corporations and smaller, niche players specializing in Halal cosmetics. Strategic partnerships, acquisitions, and product diversification are key strategies employed by companies to maintain a competitive edge. Geographical expansion into regions with large Muslim populations is another crucial factor impacting market growth. While precise regional breakdowns are unavailable, strong growth is anticipated in Southeast Asia, the Middle East, and parts of Africa, driven by increasing consumer spending power and a strong preference for Halal-certified products in these regions. The market is segmented by product type (skincare, haircare, makeup, etc.), price range, and distribution channels, providing varied opportunities for market participants. Future growth will likely be influenced by technological advancements in formulation and packaging, as well as evolving consumer preferences and demand for personalized and customized products.
Halal Cosmetics and Personal Care Products Company Market Share
This comprehensive report provides an in-depth analysis of the Halal cosmetics and personal care products market, offering invaluable insights for industry professionals, investors, and stakeholders. The study covers the period 2019-2033, with a focus on the 2025-2033 forecast period and a base year of 2025. The market is segmented by product type (e.g., skincare, haircare, makeup), distribution channel (e.g., online, offline), and geography, providing a granular understanding of market dynamics and growth potential. The report values are presented in million units.
Halal Cosmetics and Personal Care Products Market Dynamics & Structure
This section analyzes the market structure, encompassing market concentration, technological innovation, regulatory landscapes, competitive substitutes, end-user demographics, and M&A activities within the Halal cosmetics and personal care products sector. The global market is experiencing a notable surge, driven by increasing consumer demand for ethically sourced and ethically produced products.
Market Concentration: The market exhibits a blend of established multinational corporations and smaller, specialized brands. The top five players account for approximately xx% of the market share in 2025, indicating a moderately concentrated landscape.
Technological Innovation: Innovation in natural ingredients, sustainable packaging, and personalized formulations is key. However, barriers to entry exist, including high R&D costs and stringent Halal certification requirements.
Regulatory Frameworks: Stringent Halal certification processes vary across regions, creating complexities for manufacturers aiming for global reach. Compliance demands significant investment and thorough documentation.
Competitive Substitutes: Conventional cosmetics and personal care products pose a significant competitive threat, especially within price-sensitive market segments.
End-User Demographics: The primary end-users are Muslim consumers globally, with a strong emphasis on women aged 25-45. However, the market's appeal is expanding to include consumers prioritizing ethical and sustainable products.
M&A Trends: The number of M&A deals in the sector from 2019-2024 averaged xx per year, with a majority focused on expanding product portfolios and geographical reach. This trend is expected to continue, fueled by market consolidation and increased investor interest.
- Market Share (2025): Top 5 Players - xx%
- Average M&A Deals (2019-2024): xx per year
- Key Innovation Barriers: High R&D costs, stringent certification
Halal Cosmetics and Personal Care Products Growth Trends & Insights
The Halal cosmetics and personal care products market is experiencing robust growth, driven by rising disposable incomes in key emerging markets and increasing awareness of natural and ethical beauty products among Muslim and non-Muslim consumers alike. The market size expanded from xx million units in 2019 to xx million units in 2024, exhibiting a CAGR of xx%. We project the market to reach xx million units by 2033, with a forecast CAGR of xx% from 2025 to 2033. This growth is fueled by several factors, including rising awareness of halal certification, increased disposable incomes, especially in emerging economies, and growing preference for naturally sourced ingredients. Technological advancements, such as personalized beauty solutions and AI-driven skincare recommendations, are further driving adoption. Shifting consumer preferences towards sustainable and ethically-sourced products are also contributing to this remarkable growth trajectory.
Dominant Regions, Countries, or Segments in Halal Cosmetics and Personal Care Products
The Southeast Asian region currently dominates the Halal cosmetics and personal care products market, driven by a large Muslim population and strong economic growth. Indonesia, Malaysia, and the United Arab Emirates are key contributors, representing xx%, xx%, and xx% of the global market share, respectively, in 2025. This dominance is primarily due to favorable government policies supporting the Halal industry, a robust infrastructure for manufacturing and distribution, and a high level of consumer awareness and acceptance. The skincare segment holds the largest market share, followed by hair care and makeup. Future growth will be driven by increased demand in regions like Sub-Saharan Africa and South Asia, as well as the growing popularity of halal-certified personal care products in Western markets.
- Leading Region (2025): Southeast Asia
- Top Countries (2025): Indonesia (xx%), Malaysia (xx%), UAE (xx%)
- Largest Segment (2025): Skincare
Halal Cosmetics and Personal Care Products Product Landscape
The Halal cosmetics and personal care products market offers a diverse range of products, from basic skincare essentials to sophisticated makeup and hair care solutions. Formulations increasingly prioritize natural and organic ingredients, with a focus on sustainable and ethically-sourced materials. Product innovation centers around personalized solutions, leveraging data analytics and AI to cater to individual skin types and concerns. Moreover, manufacturers are investing heavily in eco-friendly packaging solutions, minimizing the environmental impact of their products.
Key Drivers, Barriers & Challenges in Halal Cosmetics and Personal Care Products
Key Drivers:
- Rising disposable incomes, particularly in developing economies.
- Growing awareness of halal certification and its significance.
- Increased consumer preference for natural and ethically sourced ingredients.
- Technological advancements leading to innovative product formulations.
Challenges & Restraints:
- Stringent and varying Halal certification requirements across regions.
- High R&D costs associated with developing new, certified products.
- Competition from conventional cosmetics and personal care brands.
- Supply chain complexities and potential disruptions. The impact of supply chain disruptions, estimated to be xx million units in lost sales in 2024, highlights the vulnerability of the market.
Emerging Opportunities in Halal Cosmetics and Personal Care Products
Untapped markets in Sub-Saharan Africa and South Asia offer significant growth opportunities. The increasing demand for personalized cosmetics, driven by technology, creates scope for innovative products and services. Furthermore, the growing interest in sustainable and eco-friendly packaging presents opportunities for brands to differentiate themselves and attract environmentally conscious consumers.
Growth Accelerators in the Halal Cosmetics and Personal Care Products Industry
Technological breakthroughs in formulation and packaging, coupled with strategic partnerships between manufacturers and ingredient suppliers, will significantly accelerate market growth. Expanding into new markets through strategic distribution partnerships and e-commerce platforms will also contribute to long-term expansion.
Key Players Shaping the Halal Cosmetics and Personal Care Products Market
- Martha Tilaar Group
- INIKA Cosmetics
- PT Paragon Technology and Innovation
- Ivy Beauty
- Colgate-Palmolive
- Jetaine
- Tanamera Tropical
- Wipro Unza Holdings
- INGLOT
- Muslimah Manufacturing
Notable Milestones in Halal Cosmetics and Personal Care Products Sector
- 2020: Increased government support for the Halal industry in several Southeast Asian countries.
- 2021: Launch of several new Halal-certified skincare lines by major multinational companies.
- 2022: Significant rise in e-commerce sales of Halal cosmetics and personal care products.
- 2023: Several successful mergers and acquisitions within the sector.
In-Depth Halal Cosmetics and Personal Care Products Market Outlook
The Halal cosmetics and personal care products market is poised for continued strong growth over the next decade. Strategic investments in research and development, coupled with expansion into new and untapped markets, will drive this expansion. The increasing consumer demand for ethical, sustainable, and personalized beauty products creates immense potential for innovation and growth in this dynamic sector. The market is expected to reach xx million units by 2033, presenting numerous opportunities for both established and emerging players.
Halal Cosmetics and Personal Care Products Segmentation
-
1. Application
- 1.1. Hair Care Products
- 1.2. Skin Care Products
- 1.3. Color Cosmetics Products
- 1.4. Fragrance Products
- 1.5. Others
-
2. Types
- 2.1. Personal Care
- 2.2. Color Cosmetics
- 2.3. Perfumes
- 2.4. Others
Halal Cosmetics and Personal Care Products Segmentation By Geography
-
1. North America
- 1.1. United States
- 1.2. Canada
- 1.3. Mexico
-
2. South America
- 2.1. Brazil
- 2.2. Argentina
- 2.3. Rest of South America
-
3. Europe
- 3.1. United Kingdom
- 3.2. Germany
- 3.3. France
- 3.4. Italy
- 3.5. Spain
- 3.6. Russia
- 3.7. Benelux
- 3.8. Nordics
- 3.9. Rest of Europe
-
4. Middle East & Africa
- 4.1. Turkey
- 4.2. Israel
- 4.3. GCC
- 4.4. North Africa
- 4.5. South Africa
- 4.6. Rest of Middle East & Africa
-
5. Asia Pacific
- 5.1. China
- 5.2. India
- 5.3. Japan
- 5.4. South Korea
- 5.5. ASEAN
- 5.6. Oceania
- 5.7. Rest of Asia Pacific
Halal Cosmetics and Personal Care Products Regional Market Share
Geographic Coverage of Halal Cosmetics and Personal Care Products
Halal Cosmetics and Personal Care Products REPORT HIGHLIGHTS
| Aspects | Details |
|---|---|
| Study Period | 2020-2034 |
| Base Year | 2025 |
| Estimated Year | 2026 |
| Forecast Period | 2026-2034 |
| Historical Period | 2020-2025 |
| Growth Rate | CAGR of 7.56% from 2020-2034 |
| Segmentation |
|
Table of Contents
- 1. Introduction
- 1.1. Research Scope
- 1.2. Market Segmentation
- 1.3. Research Objective
- 1.4. Definitions and Assumptions
- 2. Executive Summary
- 2.1. Market Snapshot
- 3. Market Dynamics
- 3.1. Market Drivers
- 3.2. Market Restrains
- 3.3. Market Trends
- 3.4. Market Opportunities
- 4. Market Factor Analysis
- 4.1. Porters Five Forces
- 4.1.1. Bargaining Power of Suppliers
- 4.1.2. Bargaining Power of Buyers
- 4.1.3. Threat of New Entrants
- 4.1.4. Threat of Substitutes
- 4.1.5. Competitive Rivalry
- 4.2. PESTEL analysis
- 4.3. BCG Analysis
- 4.3.1. Stars (High Growth, High Market Share)
- 4.3.2. Cash Cows (Low Growth, High Market Share)
- 4.3.3. Question Mark (High Growth, Low Market Share)
- 4.3.4. Dogs (Low Growth, Low Market Share)
- 4.4. Ansoff Matrix Analysis
- 4.5. Supply Chain Analysis
- 4.6. Regulatory Landscape
- 4.7. Current Market Potential and Opportunity Assessment (TAM–SAM–SOM Framework)
- 4.8. NRP Analyst Note
- 4.1. Porters Five Forces
- 5. Market Analysis, Insights and Forecast 2021-2033
- 5.1. Market Analysis, Insights and Forecast - by Application
- 5.1.1. Hair Care Products
- 5.1.2. Skin Care Products
- 5.1.3. Color Cosmetics Products
- 5.1.4. Fragrance Products
- 5.1.5. Others
- 5.2. Market Analysis, Insights and Forecast - by Types
- 5.2.1. Personal Care
- 5.2.2. Color Cosmetics
- 5.2.3. Perfumes
- 5.2.4. Others
- 5.3. Market Analysis, Insights and Forecast - by Region
- 5.3.1. North America
- 5.3.2. South America
- 5.3.3. Europe
- 5.3.4. Middle East & Africa
- 5.3.5. Asia Pacific
- 5.1. Market Analysis, Insights and Forecast - by Application
- 6. Global Halal Cosmetics and Personal Care Products Analysis, Insights and Forecast, 2021-2033
- 6.1. Market Analysis, Insights and Forecast - by Application
- 6.1.1. Hair Care Products
- 6.1.2. Skin Care Products
- 6.1.3. Color Cosmetics Products
- 6.1.4. Fragrance Products
- 6.1.5. Others
- 6.2. Market Analysis, Insights and Forecast - by Types
- 6.2.1. Personal Care
- 6.2.2. Color Cosmetics
- 6.2.3. Perfumes
- 6.2.4. Others
- 6.1. Market Analysis, Insights and Forecast - by Application
- 7. North America Halal Cosmetics and Personal Care Products Analysis, Insights and Forecast, 2020-2032
- 7.1. Market Analysis, Insights and Forecast - by Application
- 7.1.1. Hair Care Products
- 7.1.2. Skin Care Products
- 7.1.3. Color Cosmetics Products
- 7.1.4. Fragrance Products
- 7.1.5. Others
- 7.2. Market Analysis, Insights and Forecast - by Types
- 7.2.1. Personal Care
- 7.2.2. Color Cosmetics
- 7.2.3. Perfumes
- 7.2.4. Others
- 7.1. Market Analysis, Insights and Forecast - by Application
- 8. South America Halal Cosmetics and Personal Care Products Analysis, Insights and Forecast, 2020-2032
- 8.1. Market Analysis, Insights and Forecast - by Application
- 8.1.1. Hair Care Products
- 8.1.2. Skin Care Products
- 8.1.3. Color Cosmetics Products
- 8.1.4. Fragrance Products
- 8.1.5. Others
- 8.2. Market Analysis, Insights and Forecast - by Types
- 8.2.1. Personal Care
- 8.2.2. Color Cosmetics
- 8.2.3. Perfumes
- 8.2.4. Others
- 8.1. Market Analysis, Insights and Forecast - by Application
- 9. Europe Halal Cosmetics and Personal Care Products Analysis, Insights and Forecast, 2020-2032
- 9.1. Market Analysis, Insights and Forecast - by Application
- 9.1.1. Hair Care Products
- 9.1.2. Skin Care Products
- 9.1.3. Color Cosmetics Products
- 9.1.4. Fragrance Products
- 9.1.5. Others
- 9.2. Market Analysis, Insights and Forecast - by Types
- 9.2.1. Personal Care
- 9.2.2. Color Cosmetics
- 9.2.3. Perfumes
- 9.2.4. Others
- 9.1. Market Analysis, Insights and Forecast - by Application
- 10. Middle East & Africa Halal Cosmetics and Personal Care Products Analysis, Insights and Forecast, 2020-2032
- 10.1. Market Analysis, Insights and Forecast - by Application
- 10.1.1. Hair Care Products
- 10.1.2. Skin Care Products
- 10.1.3. Color Cosmetics Products
- 10.1.4. Fragrance Products
- 10.1.5. Others
- 10.2. Market Analysis, Insights and Forecast - by Types
- 10.2.1. Personal Care
- 10.2.2. Color Cosmetics
- 10.2.3. Perfumes
- 10.2.4. Others
- 10.1. Market Analysis, Insights and Forecast - by Application
- 11. Asia Pacific Halal Cosmetics and Personal Care Products Analysis, Insights and Forecast, 2020-2032
- 11.1. Market Analysis, Insights and Forecast - by Application
- 11.1.1. Hair Care Products
- 11.1.2. Skin Care Products
- 11.1.3. Color Cosmetics Products
- 11.1.4. Fragrance Products
- 11.1.5. Others
- 11.2. Market Analysis, Insights and Forecast - by Types
- 11.2.1. Personal Care
- 11.2.2. Color Cosmetics
- 11.2.3. Perfumes
- 11.2.4. Others
- 11.1. Market Analysis, Insights and Forecast - by Application
- 12. Competitive Analysis
- 12.1. Company Profiles
- 12.1.1 Martha Tilaar Group
- 12.1.1.1. Company Overview
- 12.1.1.2. Products
- 12.1.1.3. Company Financials
- 12.1.1.4. SWOT Analysis
- 12.1.2 INIKA Cosmetics
- 12.1.2.1. Company Overview
- 12.1.2.2. Products
- 12.1.2.3. Company Financials
- 12.1.2.4. SWOT Analysis
- 12.1.3 PT Paragon Technology and Innovation
- 12.1.3.1. Company Overview
- 12.1.3.2. Products
- 12.1.3.3. Company Financials
- 12.1.3.4. SWOT Analysis
- 12.1.4 Ivy Beauty
- 12.1.4.1. Company Overview
- 12.1.4.2. Products
- 12.1.4.3. Company Financials
- 12.1.4.4. SWOT Analysis
- 12.1.5 Colgate-Palmolive
- 12.1.5.1. Company Overview
- 12.1.5.2. Products
- 12.1.5.3. Company Financials
- 12.1.5.4. SWOT Analysis
- 12.1.6 Jetaine
- 12.1.6.1. Company Overview
- 12.1.6.2. Products
- 12.1.6.3. Company Financials
- 12.1.6.4. SWOT Analysis
- 12.1.7 Tanamera Tropical
- 12.1.7.1. Company Overview
- 12.1.7.2. Products
- 12.1.7.3. Company Financials
- 12.1.7.4. SWOT Analysis
- 12.1.8 Wipro Unza Holdings
- 12.1.8.1. Company Overview
- 12.1.8.2. Products
- 12.1.8.3. Company Financials
- 12.1.8.4. SWOT Analysis
- 12.1.9 INGLOT
- 12.1.9.1. Company Overview
- 12.1.9.2. Products
- 12.1.9.3. Company Financials
- 12.1.9.4. SWOT Analysis
- 12.1.10 Muslimah Manufacturing
- 12.1.10.1. Company Overview
- 12.1.10.2. Products
- 12.1.10.3. Company Financials
- 12.1.10.4. SWOT Analysis
- 12.1.1 Martha Tilaar Group
- 12.2. Market Entropy
- 12.2.1 Company's Key Areas Served
- 12.2.2 Recent Developments
- 12.3. Company Market Share Analysis 2025
- 12.3.1 Top 5 Companies Market Share Analysis
- 12.3.2 Top 3 Companies Market Share Analysis
- 12.4. List of Potential Customers
- 13. Research Methodology
List of Figures
- Figure 1: Global Halal Cosmetics and Personal Care Products Revenue Breakdown (billion, %) by Region 2025 & 2033
- Figure 2: Global Halal Cosmetics and Personal Care Products Volume Breakdown (K, %) by Region 2025 & 2033
- Figure 3: North America Halal Cosmetics and Personal Care Products Revenue (billion), by Application 2025 & 2033
- Figure 4: North America Halal Cosmetics and Personal Care Products Volume (K), by Application 2025 & 2033
- Figure 5: North America Halal Cosmetics and Personal Care Products Revenue Share (%), by Application 2025 & 2033
- Figure 6: North America Halal Cosmetics and Personal Care Products Volume Share (%), by Application 2025 & 2033
- Figure 7: North America Halal Cosmetics and Personal Care Products Revenue (billion), by Types 2025 & 2033
- Figure 8: North America Halal Cosmetics and Personal Care Products Volume (K), by Types 2025 & 2033
- Figure 9: North America Halal Cosmetics and Personal Care Products Revenue Share (%), by Types 2025 & 2033
- Figure 10: North America Halal Cosmetics and Personal Care Products Volume Share (%), by Types 2025 & 2033
- Figure 11: North America Halal Cosmetics and Personal Care Products Revenue (billion), by Country 2025 & 2033
- Figure 12: North America Halal Cosmetics and Personal Care Products Volume (K), by Country 2025 & 2033
- Figure 13: North America Halal Cosmetics and Personal Care Products Revenue Share (%), by Country 2025 & 2033
- Figure 14: North America Halal Cosmetics and Personal Care Products Volume Share (%), by Country 2025 & 2033
- Figure 15: South America Halal Cosmetics and Personal Care Products Revenue (billion), by Application 2025 & 2033
- Figure 16: South America Halal Cosmetics and Personal Care Products Volume (K), by Application 2025 & 2033
- Figure 17: South America Halal Cosmetics and Personal Care Products Revenue Share (%), by Application 2025 & 2033
- Figure 18: South America Halal Cosmetics and Personal Care Products Volume Share (%), by Application 2025 & 2033
- Figure 19: South America Halal Cosmetics and Personal Care Products Revenue (billion), by Types 2025 & 2033
- Figure 20: South America Halal Cosmetics and Personal Care Products Volume (K), by Types 2025 & 2033
- Figure 21: South America Halal Cosmetics and Personal Care Products Revenue Share (%), by Types 2025 & 2033
- Figure 22: South America Halal Cosmetics and Personal Care Products Volume Share (%), by Types 2025 & 2033
- Figure 23: South America Halal Cosmetics and Personal Care Products Revenue (billion), by Country 2025 & 2033
- Figure 24: South America Halal Cosmetics and Personal Care Products Volume (K), by Country 2025 & 2033
- Figure 25: South America Halal Cosmetics and Personal Care Products Revenue Share (%), by Country 2025 & 2033
- Figure 26: South America Halal Cosmetics and Personal Care Products Volume Share (%), by Country 2025 & 2033
- Figure 27: Europe Halal Cosmetics and Personal Care Products Revenue (billion), by Application 2025 & 2033
- Figure 28: Europe Halal Cosmetics and Personal Care Products Volume (K), by Application 2025 & 2033
- Figure 29: Europe Halal Cosmetics and Personal Care Products Revenue Share (%), by Application 2025 & 2033
- Figure 30: Europe Halal Cosmetics and Personal Care Products Volume Share (%), by Application 2025 & 2033
- Figure 31: Europe Halal Cosmetics and Personal Care Products Revenue (billion), by Types 2025 & 2033
- Figure 32: Europe Halal Cosmetics and Personal Care Products Volume (K), by Types 2025 & 2033
- Figure 33: Europe Halal Cosmetics and Personal Care Products Revenue Share (%), by Types 2025 & 2033
- Figure 34: Europe Halal Cosmetics and Personal Care Products Volume Share (%), by Types 2025 & 2033
- Figure 35: Europe Halal Cosmetics and Personal Care Products Revenue (billion), by Country 2025 & 2033
- Figure 36: Europe Halal Cosmetics and Personal Care Products Volume (K), by Country 2025 & 2033
- Figure 37: Europe Halal Cosmetics and Personal Care Products Revenue Share (%), by Country 2025 & 2033
- Figure 38: Europe Halal Cosmetics and Personal Care Products Volume Share (%), by Country 2025 & 2033
- Figure 39: Middle East & Africa Halal Cosmetics and Personal Care Products Revenue (billion), by Application 2025 & 2033
- Figure 40: Middle East & Africa Halal Cosmetics and Personal Care Products Volume (K), by Application 2025 & 2033
- Figure 41: Middle East & Africa Halal Cosmetics and Personal Care Products Revenue Share (%), by Application 2025 & 2033
- Figure 42: Middle East & Africa Halal Cosmetics and Personal Care Products Volume Share (%), by Application 2025 & 2033
- Figure 43: Middle East & Africa Halal Cosmetics and Personal Care Products Revenue (billion), by Types 2025 & 2033
- Figure 44: Middle East & Africa Halal Cosmetics and Personal Care Products Volume (K), by Types 2025 & 2033
- Figure 45: Middle East & Africa Halal Cosmetics and Personal Care Products Revenue Share (%), by Types 2025 & 2033
- Figure 46: Middle East & Africa Halal Cosmetics and Personal Care Products Volume Share (%), by Types 2025 & 2033
- Figure 47: Middle East & Africa Halal Cosmetics and Personal Care Products Revenue (billion), by Country 2025 & 2033
- Figure 48: Middle East & Africa Halal Cosmetics and Personal Care Products Volume (K), by Country 2025 & 2033
- Figure 49: Middle East & Africa Halal Cosmetics and Personal Care Products Revenue Share (%), by Country 2025 & 2033
- Figure 50: Middle East & Africa Halal Cosmetics and Personal Care Products Volume Share (%), by Country 2025 & 2033
- Figure 51: Asia Pacific Halal Cosmetics and Personal Care Products Revenue (billion), by Application 2025 & 2033
- Figure 52: Asia Pacific Halal Cosmetics and Personal Care Products Volume (K), by Application 2025 & 2033
- Figure 53: Asia Pacific Halal Cosmetics and Personal Care Products Revenue Share (%), by Application 2025 & 2033
- Figure 54: Asia Pacific Halal Cosmetics and Personal Care Products Volume Share (%), by Application 2025 & 2033
- Figure 55: Asia Pacific Halal Cosmetics and Personal Care Products Revenue (billion), by Types 2025 & 2033
- Figure 56: Asia Pacific Halal Cosmetics and Personal Care Products Volume (K), by Types 2025 & 2033
- Figure 57: Asia Pacific Halal Cosmetics and Personal Care Products Revenue Share (%), by Types 2025 & 2033
- Figure 58: Asia Pacific Halal Cosmetics and Personal Care Products Volume Share (%), by Types 2025 & 2033
- Figure 59: Asia Pacific Halal Cosmetics and Personal Care Products Revenue (billion), by Country 2025 & 2033
- Figure 60: Asia Pacific Halal Cosmetics and Personal Care Products Volume (K), by Country 2025 & 2033
- Figure 61: Asia Pacific Halal Cosmetics and Personal Care Products Revenue Share (%), by Country 2025 & 2033
- Figure 62: Asia Pacific Halal Cosmetics and Personal Care Products Volume Share (%), by Country 2025 & 2033
List of Tables
- Table 1: Global Halal Cosmetics and Personal Care Products Revenue billion Forecast, by Application 2020 & 2033
- Table 2: Global Halal Cosmetics and Personal Care Products Volume K Forecast, by Application 2020 & 2033
- Table 3: Global Halal Cosmetics and Personal Care Products Revenue billion Forecast, by Types 2020 & 2033
- Table 4: Global Halal Cosmetics and Personal Care Products Volume K Forecast, by Types 2020 & 2033
- Table 5: Global Halal Cosmetics and Personal Care Products Revenue billion Forecast, by Region 2020 & 2033
- Table 6: Global Halal Cosmetics and Personal Care Products Volume K Forecast, by Region 2020 & 2033
- Table 7: Global Halal Cosmetics and Personal Care Products Revenue billion Forecast, by Application 2020 & 2033
- Table 8: Global Halal Cosmetics and Personal Care Products Volume K Forecast, by Application 2020 & 2033
- Table 9: Global Halal Cosmetics and Personal Care Products Revenue billion Forecast, by Types 2020 & 2033
- Table 10: Global Halal Cosmetics and Personal Care Products Volume K Forecast, by Types 2020 & 2033
- Table 11: Global Halal Cosmetics and Personal Care Products Revenue billion Forecast, by Country 2020 & 2033
- Table 12: Global Halal Cosmetics and Personal Care Products Volume K Forecast, by Country 2020 & 2033
- Table 13: United States Halal Cosmetics and Personal Care Products Revenue (billion) Forecast, by Application 2020 & 2033
- Table 14: United States Halal Cosmetics and Personal Care Products Volume (K) Forecast, by Application 2020 & 2033
- Table 15: Canada Halal Cosmetics and Personal Care Products Revenue (billion) Forecast, by Application 2020 & 2033
- Table 16: Canada Halal Cosmetics and Personal Care Products Volume (K) Forecast, by Application 2020 & 2033
- Table 17: Mexico Halal Cosmetics and Personal Care Products Revenue (billion) Forecast, by Application 2020 & 2033
- Table 18: Mexico Halal Cosmetics and Personal Care Products Volume (K) Forecast, by Application 2020 & 2033
- Table 19: Global Halal Cosmetics and Personal Care Products Revenue billion Forecast, by Application 2020 & 2033
- Table 20: Global Halal Cosmetics and Personal Care Products Volume K Forecast, by Application 2020 & 2033
- Table 21: Global Halal Cosmetics and Personal Care Products Revenue billion Forecast, by Types 2020 & 2033
- Table 22: Global Halal Cosmetics and Personal Care Products Volume K Forecast, by Types 2020 & 2033
- Table 23: Global Halal Cosmetics and Personal Care Products Revenue billion Forecast, by Country 2020 & 2033
- Table 24: Global Halal Cosmetics and Personal Care Products Volume K Forecast, by Country 2020 & 2033
- Table 25: Brazil Halal Cosmetics and Personal Care Products Revenue (billion) Forecast, by Application 2020 & 2033
- Table 26: Brazil Halal Cosmetics and Personal Care Products Volume (K) Forecast, by Application 2020 & 2033
- Table 27: Argentina Halal Cosmetics and Personal Care Products Revenue (billion) Forecast, by Application 2020 & 2033
- Table 28: Argentina Halal Cosmetics and Personal Care Products Volume (K) Forecast, by Application 2020 & 2033
- Table 29: Rest of South America Halal Cosmetics and Personal Care Products Revenue (billion) Forecast, by Application 2020 & 2033
- Table 30: Rest of South America Halal Cosmetics and Personal Care Products Volume (K) Forecast, by Application 2020 & 2033
- Table 31: Global Halal Cosmetics and Personal Care Products Revenue billion Forecast, by Application 2020 & 2033
- Table 32: Global Halal Cosmetics and Personal Care Products Volume K Forecast, by Application 2020 & 2033
- Table 33: Global Halal Cosmetics and Personal Care Products Revenue billion Forecast, by Types 2020 & 2033
- Table 34: Global Halal Cosmetics and Personal Care Products Volume K Forecast, by Types 2020 & 2033
- Table 35: Global Halal Cosmetics and Personal Care Products Revenue billion Forecast, by Country 2020 & 2033
- Table 36: Global Halal Cosmetics and Personal Care Products Volume K Forecast, by Country 2020 & 2033
- Table 37: United Kingdom Halal Cosmetics and Personal Care Products Revenue (billion) Forecast, by Application 2020 & 2033
- Table 38: United Kingdom Halal Cosmetics and Personal Care Products Volume (K) Forecast, by Application 2020 & 2033
- Table 39: Germany Halal Cosmetics and Personal Care Products Revenue (billion) Forecast, by Application 2020 & 2033
- Table 40: Germany Halal Cosmetics and Personal Care Products Volume (K) Forecast, by Application 2020 & 2033
- Table 41: France Halal Cosmetics and Personal Care Products Revenue (billion) Forecast, by Application 2020 & 2033
- Table 42: France Halal Cosmetics and Personal Care Products Volume (K) Forecast, by Application 2020 & 2033
- Table 43: Italy Halal Cosmetics and Personal Care Products Revenue (billion) Forecast, by Application 2020 & 2033
- Table 44: Italy Halal Cosmetics and Personal Care Products Volume (K) Forecast, by Application 2020 & 2033
- Table 45: Spain Halal Cosmetics and Personal Care Products Revenue (billion) Forecast, by Application 2020 & 2033
- Table 46: Spain Halal Cosmetics and Personal Care Products Volume (K) Forecast, by Application 2020 & 2033
- Table 47: Russia Halal Cosmetics and Personal Care Products Revenue (billion) Forecast, by Application 2020 & 2033
- Table 48: Russia Halal Cosmetics and Personal Care Products Volume (K) Forecast, by Application 2020 & 2033
- Table 49: Benelux Halal Cosmetics and Personal Care Products Revenue (billion) Forecast, by Application 2020 & 2033
- Table 50: Benelux Halal Cosmetics and Personal Care Products Volume (K) Forecast, by Application 2020 & 2033
- Table 51: Nordics Halal Cosmetics and Personal Care Products Revenue (billion) Forecast, by Application 2020 & 2033
- Table 52: Nordics Halal Cosmetics and Personal Care Products Volume (K) Forecast, by Application 2020 & 2033
- Table 53: Rest of Europe Halal Cosmetics and Personal Care Products Revenue (billion) Forecast, by Application 2020 & 2033
- Table 54: Rest of Europe Halal Cosmetics and Personal Care Products Volume (K) Forecast, by Application 2020 & 2033
- Table 55: Global Halal Cosmetics and Personal Care Products Revenue billion Forecast, by Application 2020 & 2033
- Table 56: Global Halal Cosmetics and Personal Care Products Volume K Forecast, by Application 2020 & 2033
- Table 57: Global Halal Cosmetics and Personal Care Products Revenue billion Forecast, by Types 2020 & 2033
- Table 58: Global Halal Cosmetics and Personal Care Products Volume K Forecast, by Types 2020 & 2033
- Table 59: Global Halal Cosmetics and Personal Care Products Revenue billion Forecast, by Country 2020 & 2033
- Table 60: Global Halal Cosmetics and Personal Care Products Volume K Forecast, by Country 2020 & 2033
- Table 61: Turkey Halal Cosmetics and Personal Care Products Revenue (billion) Forecast, by Application 2020 & 2033
- Table 62: Turkey Halal Cosmetics and Personal Care Products Volume (K) Forecast, by Application 2020 & 2033
- Table 63: Israel Halal Cosmetics and Personal Care Products Revenue (billion) Forecast, by Application 2020 & 2033
- Table 64: Israel Halal Cosmetics and Personal Care Products Volume (K) Forecast, by Application 2020 & 2033
- Table 65: GCC Halal Cosmetics and Personal Care Products Revenue (billion) Forecast, by Application 2020 & 2033
- Table 66: GCC Halal Cosmetics and Personal Care Products Volume (K) Forecast, by Application 2020 & 2033
- Table 67: North Africa Halal Cosmetics and Personal Care Products Revenue (billion) Forecast, by Application 2020 & 2033
- Table 68: North Africa Halal Cosmetics and Personal Care Products Volume (K) Forecast, by Application 2020 & 2033
- Table 69: South Africa Halal Cosmetics and Personal Care Products Revenue (billion) Forecast, by Application 2020 & 2033
- Table 70: South Africa Halal Cosmetics and Personal Care Products Volume (K) Forecast, by Application 2020 & 2033
- Table 71: Rest of Middle East & Africa Halal Cosmetics and Personal Care Products Revenue (billion) Forecast, by Application 2020 & 2033
- Table 72: Rest of Middle East & Africa Halal Cosmetics and Personal Care Products Volume (K) Forecast, by Application 2020 & 2033
- Table 73: Global Halal Cosmetics and Personal Care Products Revenue billion Forecast, by Application 2020 & 2033
- Table 74: Global Halal Cosmetics and Personal Care Products Volume K Forecast, by Application 2020 & 2033
- Table 75: Global Halal Cosmetics and Personal Care Products Revenue billion Forecast, by Types 2020 & 2033
- Table 76: Global Halal Cosmetics and Personal Care Products Volume K Forecast, by Types 2020 & 2033
- Table 77: Global Halal Cosmetics and Personal Care Products Revenue billion Forecast, by Country 2020 & 2033
- Table 78: Global Halal Cosmetics and Personal Care Products Volume K Forecast, by Country 2020 & 2033
- Table 79: China Halal Cosmetics and Personal Care Products Revenue (billion) Forecast, by Application 2020 & 2033
- Table 80: China Halal Cosmetics and Personal Care Products Volume (K) Forecast, by Application 2020 & 2033
- Table 81: India Halal Cosmetics and Personal Care Products Revenue (billion) Forecast, by Application 2020 & 2033
- Table 82: India Halal Cosmetics and Personal Care Products Volume (K) Forecast, by Application 2020 & 2033
- Table 83: Japan Halal Cosmetics and Personal Care Products Revenue (billion) Forecast, by Application 2020 & 2033
- Table 84: Japan Halal Cosmetics and Personal Care Products Volume (K) Forecast, by Application 2020 & 2033
- Table 85: South Korea Halal Cosmetics and Personal Care Products Revenue (billion) Forecast, by Application 2020 & 2033
- Table 86: South Korea Halal Cosmetics and Personal Care Products Volume (K) Forecast, by Application 2020 & 2033
- Table 87: ASEAN Halal Cosmetics and Personal Care Products Revenue (billion) Forecast, by Application 2020 & 2033
- Table 88: ASEAN Halal Cosmetics and Personal Care Products Volume (K) Forecast, by Application 2020 & 2033
- Table 89: Oceania Halal Cosmetics and Personal Care Products Revenue (billion) Forecast, by Application 2020 & 2033
- Table 90: Oceania Halal Cosmetics and Personal Care Products Volume (K) Forecast, by Application 2020 & 2033
- Table 91: Rest of Asia Pacific Halal Cosmetics and Personal Care Products Revenue (billion) Forecast, by Application 2020 & 2033
- Table 92: Rest of Asia Pacific Halal Cosmetics and Personal Care Products Volume (K) Forecast, by Application 2020 & 2033
Frequently Asked Questions
1. What is the projected Compound Annual Growth Rate (CAGR) of the Halal Cosmetics and Personal Care Products?
The projected CAGR is approximately 7.56%.
2. Which companies are prominent players in the Halal Cosmetics and Personal Care Products?
Key companies in the market include Martha Tilaar Group, INIKA Cosmetics, PT Paragon Technology and Innovation, Ivy Beauty, Colgate-Palmolive, Jetaine, Tanamera Tropical, Wipro Unza Holdings, INGLOT, Muslimah Manufacturing.
3. What are the main segments of the Halal Cosmetics and Personal Care Products?
The market segments include Application, Types.
4. Can you provide details about the market size?
The market size is estimated to be USD 39.1 billion as of 2022.
5. What are some drivers contributing to market growth?
N/A
6. What are the notable trends driving market growth?
N/A
7. Are there any restraints impacting market growth?
N/A
8. Can you provide examples of recent developments in the market?
N/A
9. What pricing options are available for accessing the report?
Pricing options include single-user, multi-user, and enterprise licenses priced at USD 3950.00, USD 5925.00, and USD 7900.00 respectively.
10. Is the market size provided in terms of value or volume?
The market size is provided in terms of value, measured in billion and volume, measured in K.
11. Are there any specific market keywords associated with the report?
Yes, the market keyword associated with the report is "Halal Cosmetics and Personal Care Products," which aids in identifying and referencing the specific market segment covered.
12. How do I determine which pricing option suits my needs best?
The pricing options vary based on user requirements and access needs. Individual users may opt for single-user licenses, while businesses requiring broader access may choose multi-user or enterprise licenses for cost-effective access to the report.
13. Are there any additional resources or data provided in the Halal Cosmetics and Personal Care Products report?
While the report offers comprehensive insights, it's advisable to review the specific contents or supplementary materials provided to ascertain if additional resources or data are available.
14. How can I stay updated on further developments or reports in the Halal Cosmetics and Personal Care Products?
To stay informed about further developments, trends, and reports in the Halal Cosmetics and Personal Care Products, consider subscribing to industry newsletters, following relevant companies and organizations, or regularly checking reputable industry news sources and publications.
Methodology
Step 1 - Identification of Relevant Samples Size from Population Database


Step 2 - Approaches for Defining Global Market Size (Value, Volume* & Price*)

Note*: In applicable scenarios
Step 3 - Data Sources
Primary Research
- Web Analytics
- Survey Reports
- Research Institute
- Latest Research Reports
- Opinion Leaders
Secondary Research
- Annual Reports
- White Paper
- Latest Press Release
- Industry Association
- Paid Database
- Investor Presentations

Step 4 - Data Triangulation
Involves using different sources of information in order to increase the validity of a study
These sources are likely to be stakeholders in a program - participants, other researchers, program staff, other community members, and so on.
Then we put all data in single framework & apply various statistical tools to find out the dynamic on the market.
During the analysis stage, feedback from the stakeholder groups would be compared to determine areas of agreement as well as areas of divergence