

Key Insights
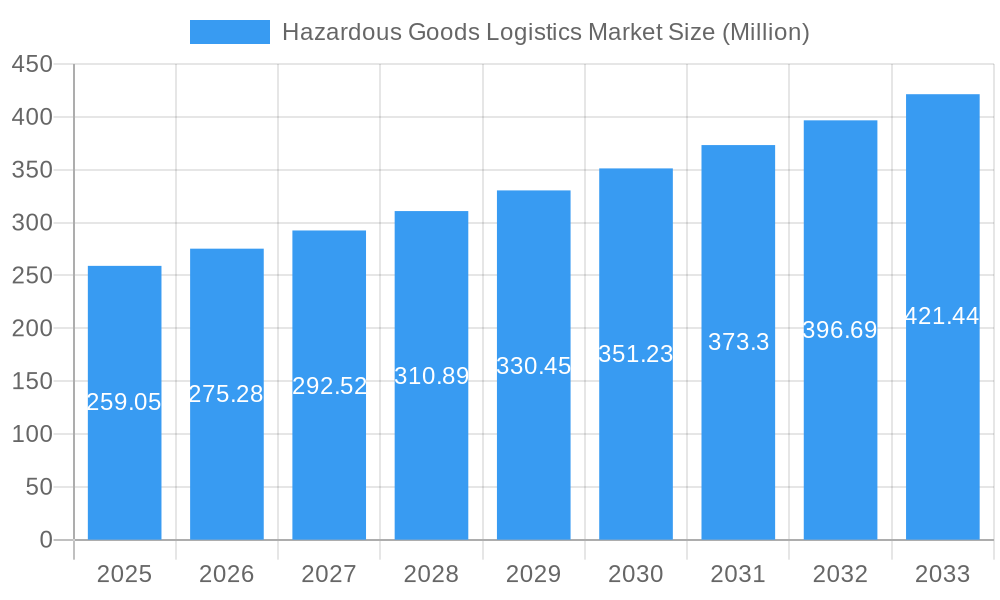
The Hazardous Goods Logistics Market is experiencing robust growth, projected to reach $259.05 million in 2025 and exhibiting a Compound Annual Growth Rate (CAGR) of 6.08% from 2025 to 2033. This expansion is fueled by several key drivers. The increasing global trade of hazardous materials, encompassing chemicals, pharmaceuticals, and radioactive substances, necessitates specialized logistics solutions. Stringent regulatory compliance requirements, demanding secure and efficient transportation and warehousing, further stimulate market growth. Technological advancements, such as real-time tracking and monitoring systems, improve safety and transparency, adding another layer of impetus. The market is segmented by service type (Transportation, Warehousing & Distribution, Value-added Services) and destination (Domestic, International). The rising demand for value-added services, like specialized packaging and labeling, alongside the growth of e-commerce driving increased international shipments, contribute to the market's positive trajectory. Major players like DB Schenker, DHL, and Kuehne + Nagel dominate the landscape, leveraging their extensive networks and expertise. Regional growth varies, with Asia-Pacific expected to lead, driven by rapid industrialization and expanding manufacturing sectors in countries like China and India. However, potential restraints include volatile fuel prices and stringent environmental regulations, presenting challenges to cost management and operational efficiency.
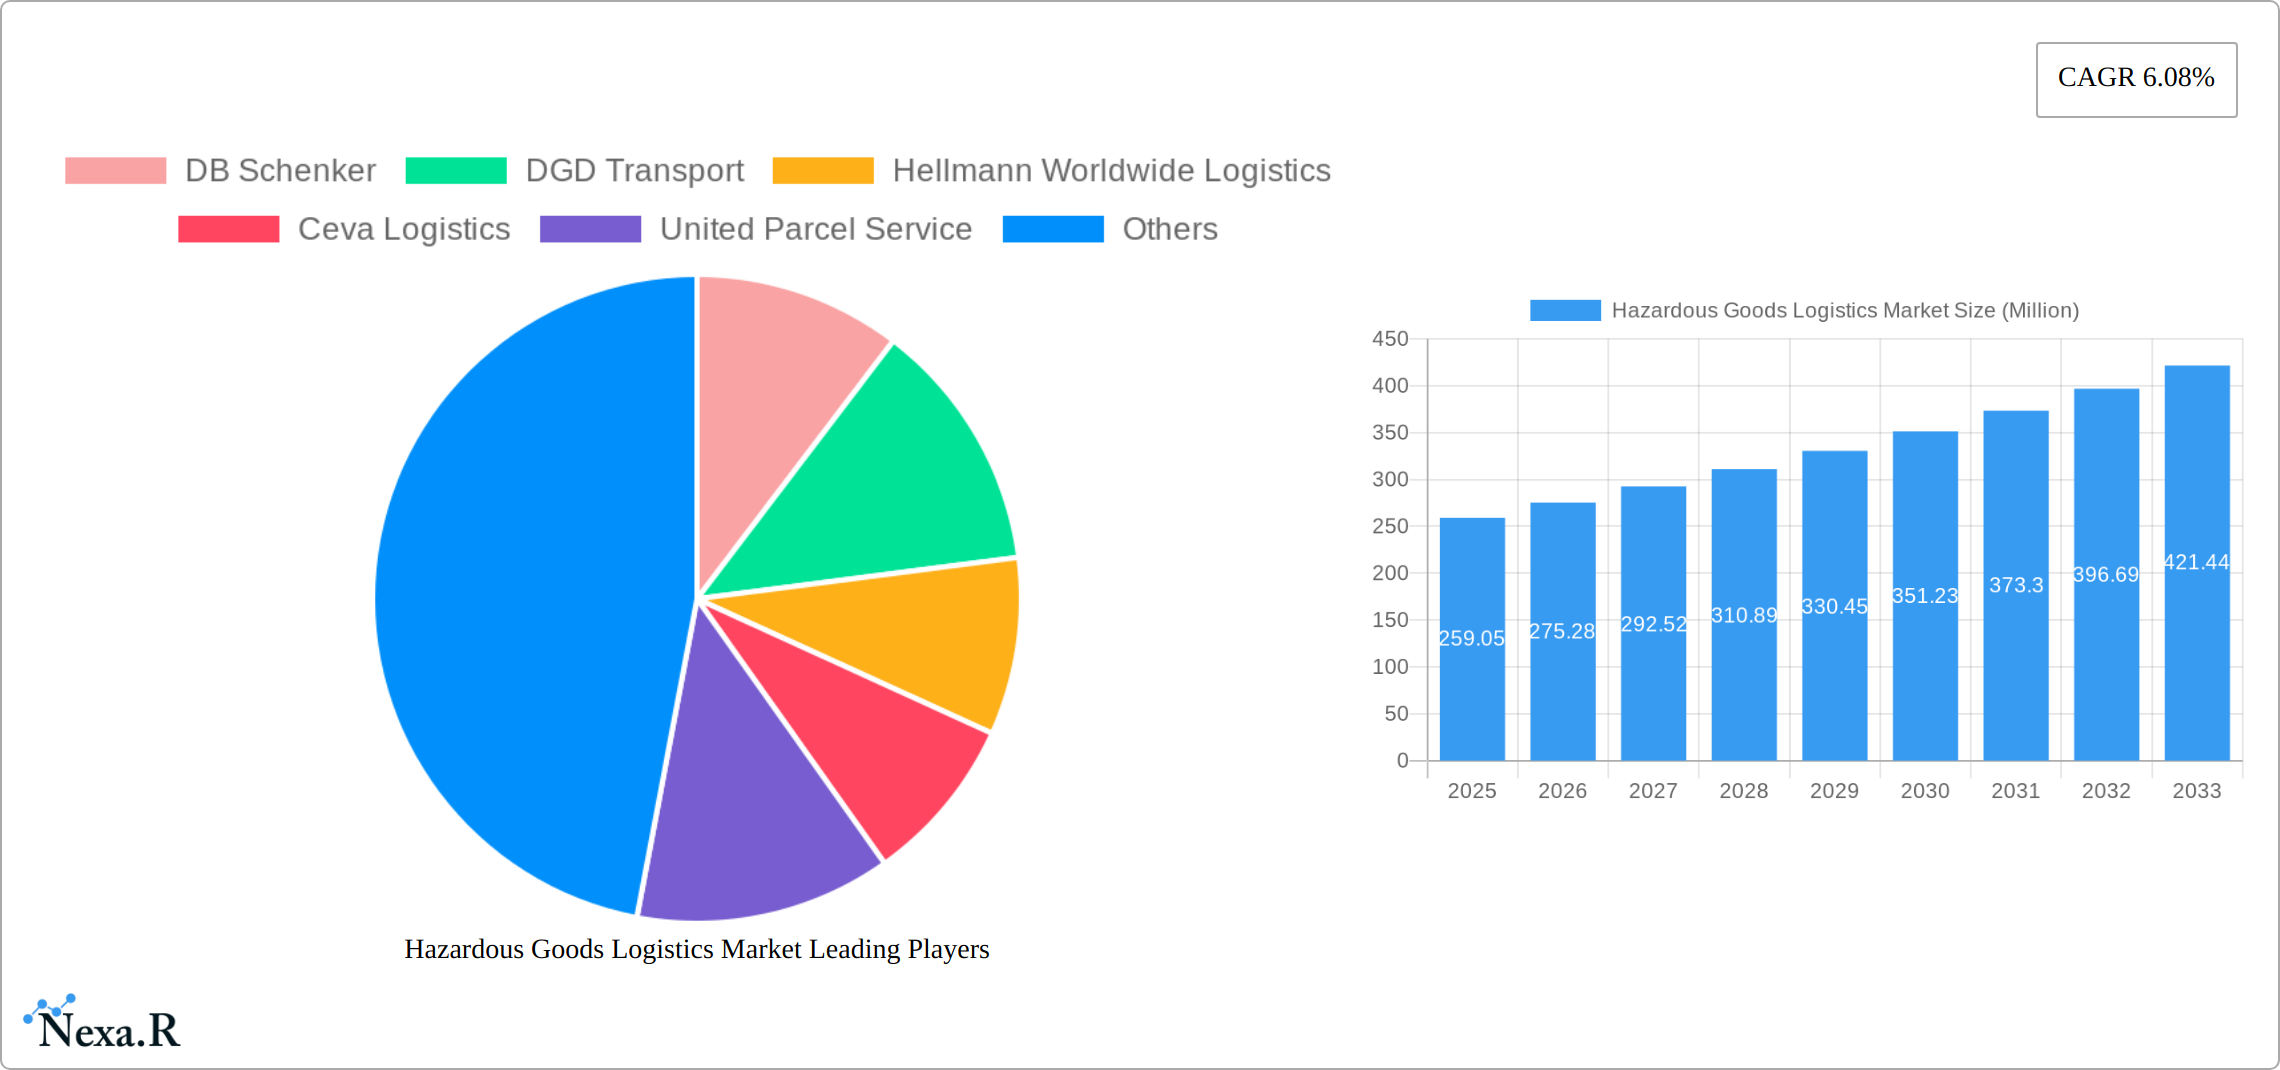
Hazardous Goods Logistics Market Market Size (In Million)
The forecast period (2025-2033) promises continued growth, although the rate may fluctuate based on global economic conditions and geopolitical events. The North American and European markets, while mature, are expected to maintain steady growth, driven by increasing demand for specialized hazardous goods transportation and handling. The Middle East and Africa, as well as Latin America, are expected to show promising growth potential, albeit at a potentially slower rate than Asia-Pacific, due to factors like developing infrastructure and regulatory frameworks. Competitive landscape analysis reveals consolidation among key players, resulting in strategic partnerships and acquisitions to enhance service offerings and expand market reach. Future market trends indicate a growing focus on sustainability and digitalization, with increasing adoption of eco-friendly transportation methods and advanced logistics technologies. This includes investment in IoT-enabled tracking, predictive analytics for risk management and enhanced supply chain visibility.
Hazardous Goods Logistics Market Company Market Share
Hazardous Goods Logistics Market: A Comprehensive Report (2019-2033)
This comprehensive report provides a detailed analysis of the Hazardous Goods Logistics Market, encompassing market dynamics, growth trends, regional analysis, key players, and future outlook. With a study period spanning 2019-2033, a base year of 2025, and a forecast period of 2025-2033, this report offers invaluable insights for industry professionals, investors, and strategists. The parent market is the broader Logistics market, while the child market is specifically focused on the transportation and handling of hazardous materials. The total market size in 2025 is estimated at xx Million.
Hazardous Goods Logistics Market Market Dynamics & Structure
The Hazardous Goods Logistics market exhibits moderate concentration, with leading players commanding significant market share. This market structure is shaped by a complex interplay of factors: stringent regulatory landscapes (e.g., IATA, IMDG Code, and regional variations), continuous advancements in tracking and monitoring technologies (IoT, AI, blockchain), and the ever-present need for enhanced safety protocols and risk mitigation strategies. Market consolidation, fueled by mergers and acquisitions (M&A) activity, is a prominent trend, driving operational efficiency and enabling providers to offer more comprehensive and integrated service portfolios. The competitive landscape is diverse, encompassing both large multinational corporations with extensive global reach and specialized regional players catering to niche markets and specific hazardous material types.
- Market Concentration: Moderately concentrated, with the top 10 players estimated to hold approximately [Insert Percentage]% of the market share in 2025. This concentration is expected to [Increase/Decrease/Remain Stable] in the coming years due to [Explain reasoning, e.g., ongoing M&A activity, entry of new players, etc.].
- Technological Innovation: The adoption of IoT, AI, and blockchain technologies is revolutionizing tracking, monitoring, risk management, and regulatory compliance. However, significant innovation barriers persist, including high upfront investment costs, complex system integration challenges, and the need for skilled personnel to manage and interpret data generated by these advanced systems.
- Regulatory Framework: Stringent international and regional regulations significantly influence market dynamics, impacting operational costs and safety protocols. Compliance is paramount, with non-compliance resulting in substantial penalties and reputational damage. Future regulatory changes and evolving interpretations of existing regulations will continue to shape market strategies.
- Competitive Product Substitutes: Direct substitutes are limited, making service differentiation and operational efficiency key competitive advantages. Companies are focusing on specialized services, enhanced security measures, and optimized supply chain solutions to gain a competitive edge.
- End-User Demographics: The market serves a diverse range of industries, including chemicals, pharmaceuticals, energy, manufacturing, and others. Market growth is intrinsically linked to the expansion and performance of these end-user sectors, as well as evolving hazardous material handling requirements within these industries.
- M&A Trends: A rising number of M&A deals reflects the strategic imperative for scale, geographic expansion, and technological integration. [Insert Number] M&A deals were recorded in 2024, indicating a [Increase/Decrease/Stable] trend compared to previous years. This activity is driven by the need for larger companies to access new technologies, expand their service offerings and geographic reach, and increase their market share.
Hazardous Goods Logistics Market Growth Trends & Insights
The Hazardous Goods Logistics market is experiencing steady growth, driven by increasing global trade, expanding industrial activity, and the rising demand for specialized logistics solutions. Technological advancements, particularly in real-time tracking and predictive analytics, are improving efficiency and safety. Changing consumer preferences towards greater transparency and accountability in supply chains further contribute to market expansion. The CAGR from 2025 to 2033 is projected at xx%. Market penetration within the hazardous materials handling industry is at xx% in 2025, and is expected to increase to xx% by 2033.
Dominant Regions, Countries, or Segments in Hazardous Goods Logistics Market
North America and Europe currently hold dominant positions in the Hazardous Goods Logistics market, driven by robust regulatory frameworks, well-developed infrastructure networks, and a high concentration of hazardous material producers and consumers. However, the Asia-Pacific region is experiencing rapid growth fueled by industrial expansion, increasing cross-border trade, and the rising adoption of hazardous materials in various sectors. Within the market segments, transportation services generally account for the largest revenue share, followed by warehousing and distribution. The international segment often demonstrates faster growth rates than the domestic segment, reflecting the increasing globalization of supply chains and the movement of hazardous goods across borders.
- North America: A mature market characterized by stringent regulations, sophisticated infrastructure, and high demand for specialized logistics solutions tailored to specific hazardous material types.
- Europe: Similar to North America, with a strong emphasis on regulatory compliance and a high concentration of specialized handling facilities and expertise.
- Asia-Pacific: The fastest-growing region, propelled by rapid industrialization, expanding international trade, and a growing need for efficient and safe hazardous goods transportation.
- By Service: Transportation ([Insert Value] Million), Warehousing and Distribution ([Insert Value] Million), Value-added Services ([Insert Value] Million). Transportation maintains the largest market share due to [Explain reason, e.g., high volume of hazardous material shipments].
- By Destination: International ([Insert Value] Million) surpasses Domestic ([Insert Value] Million) in terms of market size and growth rate, reflecting trends in global supply chains and international trade.
Hazardous Goods Logistics Market Product Landscape
The market offers a range of specialized services, including temperature-controlled transportation, secure warehousing, and value-added services such as labeling, packaging, and documentation management. Technological advancements focus on enhancing safety, visibility, and efficiency through real-time tracking, predictive analytics, and automation. Unique selling propositions often center on speed, security, and compliance with industry regulations. The integration of advanced technologies, such as AI and IoT for improved route optimization and risk mitigation, is a key trend.
Key Drivers, Barriers & Challenges in Hazardous Goods Logistics Market
Key Drivers: Stringent safety regulations, increasing global trade, and the need for specialized logistics expertise are driving market growth. Advancements in technology (IoT, AI) enhance tracking and safety, further boosting demand.
Key Challenges & Restraints: High operational costs associated with regulatory compliance and specialized equipment pose a significant challenge. Supply chain disruptions, geopolitical uncertainties, and intense competition from established players can impact market expansion. The cost of liability insurance for hazardous materials is also a significant barrier.
Emerging Opportunities in Hazardous Goods Logistics Market
Untapped markets in developing economies, the rise of e-commerce for hazardous goods (e.g., certain chemicals), and the demand for sustainable and environmentally friendly hazardous goods transportation offer significant opportunities. Technological advancements, such as drone delivery for time-sensitive hazardous materials, represent a potential game-changer.
Growth Accelerators in the Hazardous Goods Logistics Market Industry
Several key factors are driving growth within the Hazardous Goods Logistics market. These include technological innovation, strategic partnerships between logistics providers and technology companies to integrate advanced solutions, and expansion into emerging markets with growing demand for hazardous material handling. Government initiatives aimed at improving safety standards and streamlining logistics processes are also contributing to market expansion by creating a more favorable regulatory environment and stimulating investment in infrastructure improvements.
Key Players Shaping the Hazardous Goods Logistics Market Market
Notable Milestones in Hazardous Goods Logistics Market Sector
- 2022-Q4: Introduction of AI-powered route optimization software by XPO Logistics, significantly improving efficiency and reducing transportation times.
- 2023-Q1: Acquisition of a regional hazardous goods logistics company by DSV, expanding their geographic reach and service portfolio.
- 2024-Q3: Implementation of new blockchain-based tracking technology by DB Schenker, enhancing transparency, security, and traceability throughout the supply chain. (Further milestones can be added here)
- [Year]-Q[Quarter]: [Add another significant milestone, e.g., new regulation implementation, major investment announcement, etc.]
In-Depth Hazardous Goods Logistics Market Market Outlook
The Hazardous Goods Logistics market is projected to experience continued growth, fueled by technological advancements, increasing globalization, and the rising demand for secure and efficient transportation and handling of hazardous materials. Strategic partnerships, substantial investments in innovative technologies (e.g., real-time tracking, predictive analytics, automated warehousing), and expansion into untapped markets will be crucial for companies aiming to achieve sustainable growth and capitalize on future opportunities. The long-term outlook remains positive, with the market expansion trajectory expected to [Explain expected trajectory, e.g., continue at a steady pace, accelerate, or moderate depending on various factors].
Hazardous Goods Logistics Market Segmentation
-
1. Service
- 1.1. Transportation
- 1.2. Warehousing and Distribution
- 1.3. Value-added Services
-
2. Destination
- 2.1. Domestic
- 2.2. International
Hazardous Goods Logistics Market Segmentation By Geography
- 1. Asia Pacific
- 2. North America
- 3. Europe
- 4. Latin America
- 5. Middle East and Africa
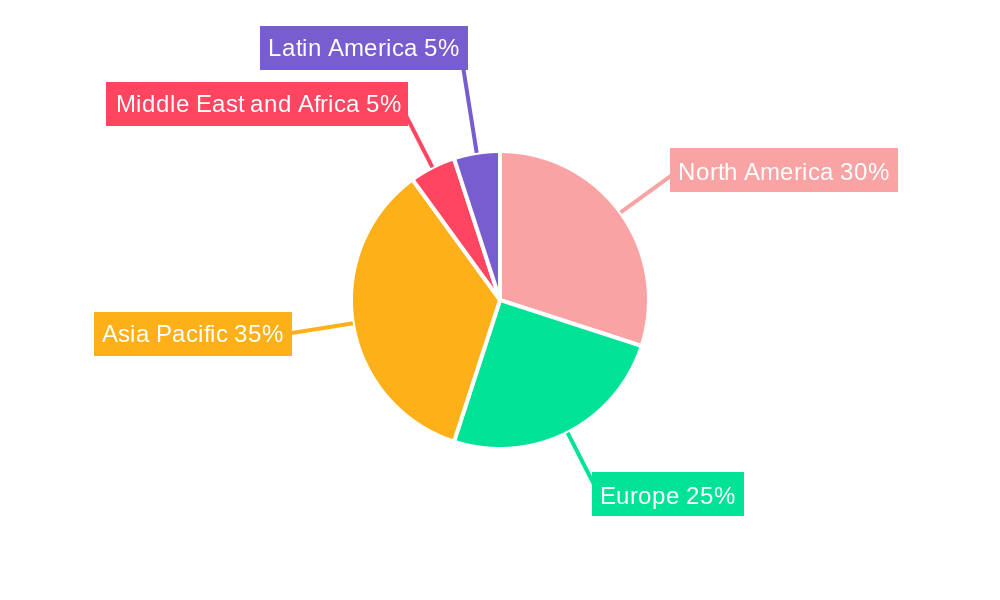
Hazardous Goods Logistics Market Regional Market Share
Geographic Coverage of Hazardous Goods Logistics Market
Hazardous Goods Logistics Market REPORT HIGHLIGHTS
| Aspects | Details |
|---|---|
| Study Period | 2020-2034 |
| Base Year | 2025 |
| Estimated Year | 2026 |
| Forecast Period | 2026-2034 |
| Historical Period | 2020-2025 |
| Growth Rate | CAGR of 6.08% from 2020-2034 |
| Segmentation |
|
Table of Contents
- 1. Introduction
- 1.1. Research Scope
- 1.2. Market Segmentation
- 1.3. Research Objective
- 1.4. Definitions and Assumptions
- 2. Executive Summary
- 2.1. Market Snapshot
- 3. Market Dynamics
- 3.1. Market Drivers
- 3.2. Market Restrains
- 3.3. Market Trends
- 3.4. Market Opportunities
- 4. Market Factor Analysis
- 4.1. Porters Five Forces
- 4.1.1. Bargaining Power of Suppliers
- 4.1.2. Bargaining Power of Buyers
- 4.1.3. Threat of New Entrants
- 4.1.4. Threat of Substitutes
- 4.1.5. Competitive Rivalry
- 4.2. PESTEL analysis
- 4.3. BCG Analysis
- 4.3.1. Stars (High Growth, High Market Share)
- 4.3.2. Cash Cows (Low Growth, High Market Share)
- 4.3.3. Question Mark (High Growth, Low Market Share)
- 4.3.4. Dogs (Low Growth, Low Market Share)
- 4.4. Ansoff Matrix Analysis
- 4.5. Supply Chain Analysis
- 4.6. Regulatory Landscape
- 4.7. Current Market Potential and Opportunity Assessment (TAM–SAM–SOM Framework)
- 4.8. NRP Analyst Note
- 4.1. Porters Five Forces
- 5. Market Analysis, Insights and Forecast 2021-2033
- 5.1. Market Analysis, Insights and Forecast - by Service
- 5.1.1. Transportation
- 5.1.2. Warehousing and Distribution
- 5.1.3. Value-added Services
- 5.2. Market Analysis, Insights and Forecast - by Destination
- 5.2.1. Domestic
- 5.2.2. International
- 5.3. Market Analysis, Insights and Forecast - by Region
- 5.3.1. Asia Pacific
- 5.3.2. North America
- 5.3.3. Europe
- 5.3.4. Latin America
- 5.3.5. Middle East and Africa
- 5.1. Market Analysis, Insights and Forecast - by Service
- 6. Global Hazardous Goods Logistics Market Analysis, Insights and Forecast, 2021-2033
- 6.1. Market Analysis, Insights and Forecast - by Service
- 6.1.1. Transportation
- 6.1.2. Warehousing and Distribution
- 6.1.3. Value-added Services
- 6.2. Market Analysis, Insights and Forecast - by Destination
- 6.2.1. Domestic
- 6.2.2. International
- 6.1. Market Analysis, Insights and Forecast - by Service
- 7. Asia Pacific Hazardous Goods Logistics Market Analysis, Insights and Forecast, 2020-2032
- 7.1. Market Analysis, Insights and Forecast - by Service
- 7.1.1. Transportation
- 7.1.2. Warehousing and Distribution
- 7.1.3. Value-added Services
- 7.2. Market Analysis, Insights and Forecast - by Destination
- 7.2.1. Domestic
- 7.2.2. International
- 7.1. Market Analysis, Insights and Forecast - by Service
- 8. North America Hazardous Goods Logistics Market Analysis, Insights and Forecast, 2020-2032
- 8.1. Market Analysis, Insights and Forecast - by Service
- 8.1.1. Transportation
- 8.1.2. Warehousing and Distribution
- 8.1.3. Value-added Services
- 8.2. Market Analysis, Insights and Forecast - by Destination
- 8.2.1. Domestic
- 8.2.2. International
- 8.1. Market Analysis, Insights and Forecast - by Service
- 9. Europe Hazardous Goods Logistics Market Analysis, Insights and Forecast, 2020-2032
- 9.1. Market Analysis, Insights and Forecast - by Service
- 9.1.1. Transportation
- 9.1.2. Warehousing and Distribution
- 9.1.3. Value-added Services
- 9.2. Market Analysis, Insights and Forecast - by Destination
- 9.2.1. Domestic
- 9.2.2. International
- 9.1. Market Analysis, Insights and Forecast - by Service
- 10. Latin America Hazardous Goods Logistics Market Analysis, Insights and Forecast, 2020-2032
- 10.1. Market Analysis, Insights and Forecast - by Service
- 10.1.1. Transportation
- 10.1.2. Warehousing and Distribution
- 10.1.3. Value-added Services
- 10.2. Market Analysis, Insights and Forecast - by Destination
- 10.2.1. Domestic
- 10.2.2. International
- 10.1. Market Analysis, Insights and Forecast - by Service
- 11. Middle East and Africa Hazardous Goods Logistics Market Analysis, Insights and Forecast, 2020-2032
- 11.1. Market Analysis, Insights and Forecast - by Service
- 11.1.1. Transportation
- 11.1.2. Warehousing and Distribution
- 11.1.3. Value-added Services
- 11.2. Market Analysis, Insights and Forecast - by Destination
- 11.2.1. Domestic
- 11.2.2. International
- 11.1. Market Analysis, Insights and Forecast - by Service
- 12. Competitive Analysis
- 12.1. Company Profiles
- 12.1.1 DB Schenker
- 12.1.1.1. Company Overview
- 12.1.1.2. Products
- 12.1.1.3. Company Financials
- 12.1.1.4. SWOT Analysis
- 12.1.2 DGD Transport
- 12.1.2.1. Company Overview
- 12.1.2.2. Products
- 12.1.2.3. Company Financials
- 12.1.2.4. SWOT Analysis
- 12.1.3 Hellmann Worldwide Logistics
- 12.1.3.1. Company Overview
- 12.1.3.2. Products
- 12.1.3.3. Company Financials
- 12.1.3.4. SWOT Analysis
- 12.1.4 Ceva Logistics
- 12.1.4.1. Company Overview
- 12.1.4.2. Products
- 12.1.4.3. Company Financials
- 12.1.4.4. SWOT Analysis
- 12.1.5 United Parcel Service
- 12.1.5.1. Company Overview
- 12.1.5.2. Products
- 12.1.5.3. Company Financials
- 12.1.5.4. SWOT Analysis
- 12.1.6 YRC Worldwide Inc
- 12.1.6.1. Company Overview
- 12.1.6.2. Products
- 12.1.6.3. Company Financials
- 12.1.6.4. SWOT Analysis
- 12.1.7 GEODIS
- 12.1.7.1. Company Overview
- 12.1.7.2. Products
- 12.1.7.3. Company Financials
- 12.1.7.4. SWOT Analysis
- 12.1.8 XPO Logistics
- 12.1.8.1. Company Overview
- 12.1.8.2. Products
- 12.1.8.3. Company Financials
- 12.1.8.4. SWOT Analysis
- 12.1.9 Agility Logistics
- 12.1.9.1. Company Overview
- 12.1.9.2. Products
- 12.1.9.3. Company Financials
- 12.1.9.4. SWOT Analysis
- 12.1.10 Kuehne + Nagel
- 12.1.10.1. Company Overview
- 12.1.10.2. Products
- 12.1.10.3. Company Financials
- 12.1.10.4. SWOT Analysis
- 12.1.11 Deutsche Post DHL Group
- 12.1.11.1. Company Overview
- 12.1.11.2. Products
- 12.1.11.3. Company Financials
- 12.1.11.4. SWOT Analysis
- 12.1.12 Bollore Logistics
- 12.1.12.1. Company Overview
- 12.1.12.2. Products
- 12.1.12.3. Company Financials
- 12.1.12.4. SWOT Analysis
- 12.1.13 DSV
- 12.1.13.1. Company Overview
- 12.1.13.2. Products
- 12.1.13.3. Company Financials
- 12.1.13.4. SWOT Analysis
- 12.1.14 Rhenus Logistics*List Not Exhaustive 7 3 7 3 Other Companies (Key Information/Overview
- 12.1.14.1. Company Overview
- 12.1.14.2. Products
- 12.1.14.3. Company Financials
- 12.1.14.4. SWOT Analysis
- 12.1.15 Toll Group
- 12.1.15.1. Company Overview
- 12.1.15.2. Products
- 12.1.15.3. Company Financials
- 12.1.15.4. SWOT Analysis
- 12.1.1 DB Schenker
- 12.2. Market Entropy
- 12.2.1 Company's Key Areas Served
- 12.2.2 Recent Developments
- 12.3. Company Market Share Analysis 2025
- 12.3.1 Top 5 Companies Market Share Analysis
- 12.3.2 Top 3 Companies Market Share Analysis
- 12.4. List of Potential Customers
- 13. Research Methodology
List of Figures
- Figure 1: Global Hazardous Goods Logistics Market Revenue Breakdown (Million, %) by Region 2025 & 2033
- Figure 2: Asia Pacific Hazardous Goods Logistics Market Revenue (Million), by Service 2025 & 2033
- Figure 3: Asia Pacific Hazardous Goods Logistics Market Revenue Share (%), by Service 2025 & 2033
- Figure 4: Asia Pacific Hazardous Goods Logistics Market Revenue (Million), by Destination 2025 & 2033
- Figure 5: Asia Pacific Hazardous Goods Logistics Market Revenue Share (%), by Destination 2025 & 2033
- Figure 6: Asia Pacific Hazardous Goods Logistics Market Revenue (Million), by Country 2025 & 2033
- Figure 7: Asia Pacific Hazardous Goods Logistics Market Revenue Share (%), by Country 2025 & 2033
- Figure 8: North America Hazardous Goods Logistics Market Revenue (Million), by Service 2025 & 2033
- Figure 9: North America Hazardous Goods Logistics Market Revenue Share (%), by Service 2025 & 2033
- Figure 10: North America Hazardous Goods Logistics Market Revenue (Million), by Destination 2025 & 2033
- Figure 11: North America Hazardous Goods Logistics Market Revenue Share (%), by Destination 2025 & 2033
- Figure 12: North America Hazardous Goods Logistics Market Revenue (Million), by Country 2025 & 2033
- Figure 13: North America Hazardous Goods Logistics Market Revenue Share (%), by Country 2025 & 2033
- Figure 14: Europe Hazardous Goods Logistics Market Revenue (Million), by Service 2025 & 2033
- Figure 15: Europe Hazardous Goods Logistics Market Revenue Share (%), by Service 2025 & 2033
- Figure 16: Europe Hazardous Goods Logistics Market Revenue (Million), by Destination 2025 & 2033
- Figure 17: Europe Hazardous Goods Logistics Market Revenue Share (%), by Destination 2025 & 2033
- Figure 18: Europe Hazardous Goods Logistics Market Revenue (Million), by Country 2025 & 2033
- Figure 19: Europe Hazardous Goods Logistics Market Revenue Share (%), by Country 2025 & 2033
- Figure 20: Latin America Hazardous Goods Logistics Market Revenue (Million), by Service 2025 & 2033
- Figure 21: Latin America Hazardous Goods Logistics Market Revenue Share (%), by Service 2025 & 2033
- Figure 22: Latin America Hazardous Goods Logistics Market Revenue (Million), by Destination 2025 & 2033
- Figure 23: Latin America Hazardous Goods Logistics Market Revenue Share (%), by Destination 2025 & 2033
- Figure 24: Latin America Hazardous Goods Logistics Market Revenue (Million), by Country 2025 & 2033
- Figure 25: Latin America Hazardous Goods Logistics Market Revenue Share (%), by Country 2025 & 2033
- Figure 26: Middle East and Africa Hazardous Goods Logistics Market Revenue (Million), by Service 2025 & 2033
- Figure 27: Middle East and Africa Hazardous Goods Logistics Market Revenue Share (%), by Service 2025 & 2033
- Figure 28: Middle East and Africa Hazardous Goods Logistics Market Revenue (Million), by Destination 2025 & 2033
- Figure 29: Middle East and Africa Hazardous Goods Logistics Market Revenue Share (%), by Destination 2025 & 2033
- Figure 30: Middle East and Africa Hazardous Goods Logistics Market Revenue (Million), by Country 2025 & 2033
- Figure 31: Middle East and Africa Hazardous Goods Logistics Market Revenue Share (%), by Country 2025 & 2033
List of Tables
- Table 1: Global Hazardous Goods Logistics Market Revenue Million Forecast, by Service 2020 & 2033
- Table 2: Global Hazardous Goods Logistics Market Revenue Million Forecast, by Destination 2020 & 2033
- Table 3: Global Hazardous Goods Logistics Market Revenue Million Forecast, by Region 2020 & 2033
- Table 4: Global Hazardous Goods Logistics Market Revenue Million Forecast, by Service 2020 & 2033
- Table 5: Global Hazardous Goods Logistics Market Revenue Million Forecast, by Destination 2020 & 2033
- Table 6: Global Hazardous Goods Logistics Market Revenue Million Forecast, by Country 2020 & 2033
- Table 7: Global Hazardous Goods Logistics Market Revenue Million Forecast, by Service 2020 & 2033
- Table 8: Global Hazardous Goods Logistics Market Revenue Million Forecast, by Destination 2020 & 2033
- Table 9: Global Hazardous Goods Logistics Market Revenue Million Forecast, by Country 2020 & 2033
- Table 10: Global Hazardous Goods Logistics Market Revenue Million Forecast, by Service 2020 & 2033
- Table 11: Global Hazardous Goods Logistics Market Revenue Million Forecast, by Destination 2020 & 2033
- Table 12: Global Hazardous Goods Logistics Market Revenue Million Forecast, by Country 2020 & 2033
- Table 13: Global Hazardous Goods Logistics Market Revenue Million Forecast, by Service 2020 & 2033
- Table 14: Global Hazardous Goods Logistics Market Revenue Million Forecast, by Destination 2020 & 2033
- Table 15: Global Hazardous Goods Logistics Market Revenue Million Forecast, by Country 2020 & 2033
- Table 16: Global Hazardous Goods Logistics Market Revenue Million Forecast, by Service 2020 & 2033
- Table 17: Global Hazardous Goods Logistics Market Revenue Million Forecast, by Destination 2020 & 2033
- Table 18: Global Hazardous Goods Logistics Market Revenue Million Forecast, by Country 2020 & 2033
Frequently Asked Questions
1. What is the projected Compound Annual Growth Rate (CAGR) of the Hazardous Goods Logistics Market?
The projected CAGR is approximately 6.08%.
2. Which companies are prominent players in the Hazardous Goods Logistics Market?
Key companies in the market include DB Schenker, DGD Transport, Hellmann Worldwide Logistics, Ceva Logistics, United Parcel Service, YRC Worldwide Inc, GEODIS, XPO Logistics, Agility Logistics, Kuehne + Nagel, Deutsche Post DHL Group, Bollore Logistics, DSV, Rhenus Logistics*List Not Exhaustive 7 3 7 3 Other Companies (Key Information/Overview, Toll Group.
3. What are the main segments of the Hazardous Goods Logistics Market?
The market segments include Service, Destination.
4. Can you provide details about the market size?
The market size is estimated to be USD 259.05 Million as of 2022.
5. What are some drivers contributing to market growth?
4.; Growth In E-commerce is driving the market4.; Growing in Cross Border Activities is driving the market.
6. What are the notable trends driving market growth?
Increase in shipment of flammable liquids driving the market.
7. Are there any restraints impacting market growth?
4.; Shortage of Skilled labor.
8. Can you provide examples of recent developments in the market?
N/A
9. What pricing options are available for accessing the report?
Pricing options include single-user, multi-user, and enterprise licenses priced at USD 4750, USD 5250, and USD 8750 respectively.
10. Is the market size provided in terms of value or volume?
The market size is provided in terms of value, measured in Million.
11. Are there any specific market keywords associated with the report?
Yes, the market keyword associated with the report is "Hazardous Goods Logistics Market," which aids in identifying and referencing the specific market segment covered.
12. How do I determine which pricing option suits my needs best?
The pricing options vary based on user requirements and access needs. Individual users may opt for single-user licenses, while businesses requiring broader access may choose multi-user or enterprise licenses for cost-effective access to the report.
13. Are there any additional resources or data provided in the Hazardous Goods Logistics Market report?
While the report offers comprehensive insights, it's advisable to review the specific contents or supplementary materials provided to ascertain if additional resources or data are available.
14. How can I stay updated on further developments or reports in the Hazardous Goods Logistics Market?
To stay informed about further developments, trends, and reports in the Hazardous Goods Logistics Market, consider subscribing to industry newsletters, following relevant companies and organizations, or regularly checking reputable industry news sources and publications.
Methodology
Step 1 - Identification of Relevant Samples Size from Population Database


Step 2 - Approaches for Defining Global Market Size (Value, Volume* & Price*)

Note*: In applicable scenarios
Step 3 - Data Sources
Primary Research
- Web Analytics
- Survey Reports
- Research Institute
- Latest Research Reports
- Opinion Leaders
Secondary Research
- Annual Reports
- White Paper
- Latest Press Release
- Industry Association
- Paid Database
- Investor Presentations

Step 4 - Data Triangulation
Involves using different sources of information in order to increase the validity of a study
These sources are likely to be stakeholders in a program - participants, other researchers, program staff, other community members, and so on.
Then we put all data in single framework & apply various statistical tools to find out the dynamic on the market.
During the analysis stage, feedback from the stakeholder groups would be compared to determine areas of agreement as well as areas of divergence