

Key Insights
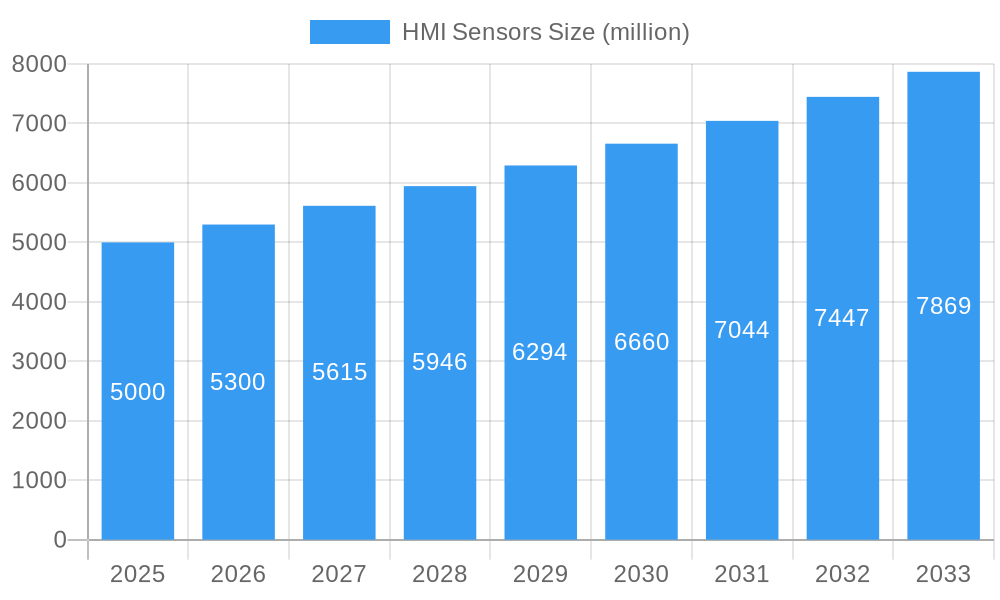
The HMI (Human-Machine Interface) sensor market is experiencing robust growth, driven by the increasing demand for advanced and intuitive user interfaces across various sectors. The market's expansion is fueled by several key factors, including the proliferation of smart devices, the rise of automation in industries like automotive and manufacturing, and the growing adoption of touch-screen technologies. The integration of sophisticated sensors into HMIs enhances user experience, improves safety, and enables more efficient control systems. We estimate the 2025 market size to be approximately $5 billion, based on observable trends in related markets and considering the CAGR (Compound Annual Growth Rate) of similar technologies. This substantial market is further segmented by sensor type (capacitive, resistive, optical, etc.), application (automotive, industrial, consumer electronics), and geography. Major players like Texas Instruments, Microchip, and Honeywell are actively involved, driving innovation and competition. While challenges exist, such as the need for miniaturization and cost reduction in certain applications, the overall market outlook remains positive, projecting continued growth through 2033.
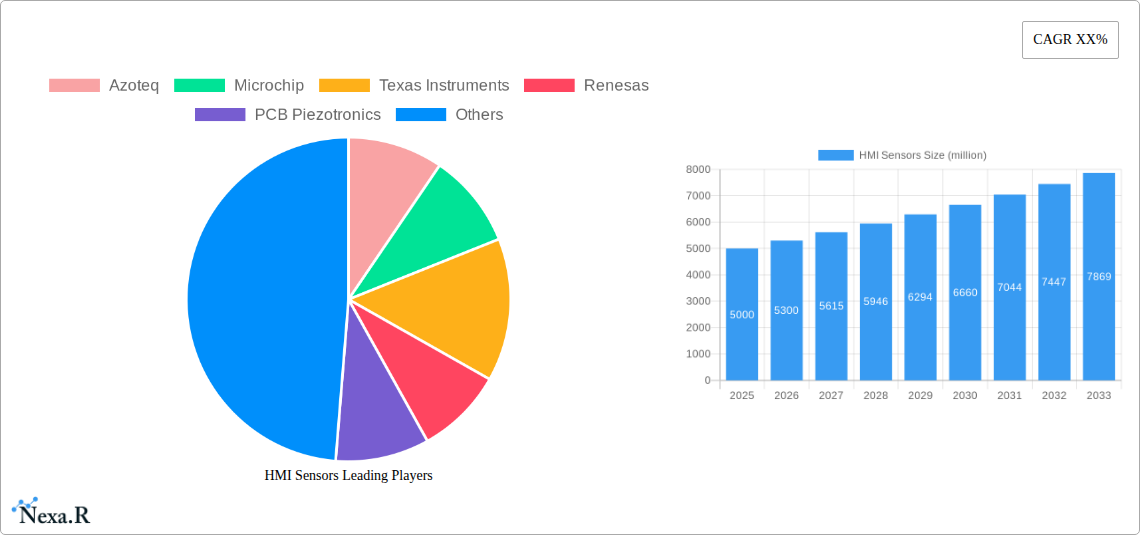
HMI Sensors Market Size (In Billion)
The forecast period (2025-2033) anticipates a continued expansion, driven by technological advancements in sensor technology, including improved accuracy, sensitivity, and power efficiency. The automotive sector is expected to remain a significant driver of growth, with the increasing adoption of advanced driver-assistance systems (ADAS) and in-car infotainment systems. Furthermore, the integration of HMI sensors in industrial automation and robotics will create significant demand. The competitive landscape is characterized by both established players and emerging companies, fostering innovation and diverse product offerings. Despite potential restraints like supply chain disruptions and fluctuating raw material prices, the long-term outlook for the HMI sensor market remains optimistic, with substantial growth potential across various applications and geographic regions.
HMI Sensors Company Market Share
HMI Sensors Market Report: 2019-2033
This comprehensive report provides a detailed analysis of the HMI (Human-Machine Interface) Sensors market, encompassing market dynamics, growth trends, regional dominance, product landscape, key players, and future outlook. The study period covers 2019-2033, with 2025 as the base and estimated year. The forecast period spans 2025-2033, and the historical period encompasses 2019-2024. The report analyzes the parent market of Sensors and the child market of HMI Sensors. Expect detailed quantitative and qualitative analysis, including CAGR, market penetration rates, and M&A deal volumes (in million units where applicable).
HMI Sensors Market Dynamics & Structure
This section analyzes the competitive landscape of the HMI Sensors market, exploring market concentration, technological innovation drivers, regulatory frameworks, competitive substitutes, end-user demographics, and M&A trends. The report delves into the impact of these factors on market growth and evolution.
- Market Concentration: The market is moderately concentrated, with the top 5 players holding approximately xx% market share in 2025. This is expected to slightly decrease to xx% by 2033 due to the entry of new players and increased competition.
- Technological Innovation: Advancements in sensor technology, such as miniaturization, improved accuracy, and increased integration capabilities, are major drivers of market growth. The development of AI-powered sensors and IoT integration are also significant factors.
- Regulatory Frameworks: Government regulations regarding safety and performance standards for HMI sensors, particularly in industries like automotive and healthcare, influence market dynamics. Compliance costs and certifications can impact market entry and growth.
- Competitive Product Substitutes: While HMI sensors are often irreplaceable in many applications, competing technologies like optical sensors and capacitive sensors exist, impacting the overall market share. The report analyzes the extent and influence of such competition.
- End-User Demographics: The primary end-users are the automotive, industrial automation, consumer electronics, healthcare, and aerospace industries. The report details segment-wise market share and growth projections for each sector.
- M&A Trends: The HMI sensor market has witnessed xx M&A deals in the period 2019-2024, with a projected increase to xx deals by 2033. This reflects the industry's consolidation and companies’ pursuit of technological advancements and market expansion. Strategic acquisitions and partnerships are driving innovation and market expansion.
HMI Sensors Growth Trends & Insights
This section provides a detailed analysis of the HMI Sensors market's evolution, examining market size, adoption rates, technological disruptions, and shifts in consumer behavior. The analysis uses a combination of quantitative and qualitative data to provide a comprehensive overview of growth trends.
The HMI sensor market is projected to grow at a CAGR of xx% during the forecast period (2025-2033), driven by increasing demand from diverse sectors. Market penetration is expected to increase from xx% in 2025 to xx% by 2033, primarily due to the increasing adoption of advanced HMI systems across various industries and the rising demand for improved user experience. This growth is fueled by factors like technological advancements, including the integration of AI and machine learning in HMI systems; increasing demand for user-friendly interfaces in diverse applications, such as automobiles, consumer electronics, and industrial equipment; and rising investments in automation and digitalization initiatives by businesses across various sectors. Emerging technologies, like the Internet of Things (IoT) and Industry 4.0, are also accelerating the adoption of HMI sensors. Consumer preference for advanced features and seamless user experiences is also significantly impacting market growth. Specific regional factors such as rising disposable incomes and government initiatives promoting technological advancements in specific geographical locations further contribute to the observed growth trajectory.
Dominant Regions, Countries, or Segments in HMI Sensors
This section identifies the leading regions, countries, or segments driving HMI Sensors market growth. The report pinpoints key factors contributing to their dominance, including market share and growth potential.
North America is expected to dominate the HMI Sensors market during the forecast period, driven by strong demand from the automotive and industrial automation sectors, technological advancements, and robust government support for technological innovation. Strong R&D investment and the presence of major players in this region contribute significantly to market growth. A substantial share of this region's growth can be attributed to the automotive sector's ongoing focus on advanced driver-assistance systems (ADAS) and increased automation in manufacturing processes.
Asia Pacific is another rapidly growing region, fueled by significant investments in infrastructure development, particularly in countries like China and India, rapid industrialization, and the expansion of the consumer electronics market. Growing consumer spending on technologically advanced electronic devices is a prominent driver of this growth.
Europe displays steady growth driven by increasing adoption of HMI sensors in automotive and industrial applications. Stringent regulatory requirements contribute to innovation and adoption, yet economic uncertainty can occasionally pose a challenge to growth.
Key drivers across these regions include increased investment in automation, rising consumer electronics demand, growth in smart manufacturing initiatives, supportive government policies, and rising demand for advanced HMI systems across multiple end-use applications.
HMI Sensors Product Landscape
The HMI sensors market offers a diverse range of products, including pressure sensors, proximity sensors, force sensors, and temperature sensors. Recent innovations include smaller form factors, increased accuracy, improved durability, and enhanced integration with other systems. These advancements are driven by the demand for more efficient and reliable HMI solutions across various sectors. Unique selling propositions include increased sensitivity, lower power consumption, and robust designs to meet the demands of varied operating conditions. Technological advancements, such as the integration of advanced signal processing and machine learning algorithms, further improve the performance and efficiency of HMI sensors.
Key Drivers, Barriers & Challenges in HMI Sensors
Key Drivers: The increasing demand for advanced HMI systems across various sectors, driven by the growing need for improved user interfaces and the integration of automation technologies, is a primary driver. Technological advancements such as miniaturization, improved accuracy, and enhanced functionality are pushing market expansion. Government regulations promoting safety and efficiency in various industries also play a significant role.
Challenges & Restraints: High initial investment costs for advanced HMI systems can hinder adoption, especially for small and medium-sized enterprises (SMEs). Supply chain disruptions and the increasing complexity of HMI sensor technology can impact manufacturing and availability. Moreover, the increasing competition among sensor manufacturers and potential price pressures can reduce profit margins. Stricter regulatory compliance requirements can also create significant challenges for manufacturers. The average cost of implementing an HMI system is projected to be around xx million USD in 2025, potentially impacting adoption in budget-constrained sectors.
Emerging Opportunities in HMI Sensors
Emerging opportunities lie in the increasing adoption of HMI sensors in the Internet of Things (IoT) and smart manufacturing. The growing demand for personalized user experiences and the integration of advanced sensor technologies in wearable devices and healthcare applications also present significant growth potential. Untapped markets in developing countries and the increasing use of HMI sensors in the automotive industry, specifically in autonomous driving systems, provide exciting avenues for market expansion.
Growth Accelerators in the HMI Sensors Industry
Technological breakthroughs, including the development of advanced sensor materials and improved signal processing techniques, are key growth drivers. Strategic partnerships and collaborations between sensor manufacturers and system integrators are accelerating the development and deployment of innovative HMI solutions. The expansion into new and emerging markets, coupled with supportive government policies promoting technological advancements, contributes significantly to industry growth.
Key Players Shaping the HMI Sensors Market
- Azoteq
- Microchip
- Texas Instruments
- Renesas
- PCB Piezotronics
- Honeywell
- Meggitt Sensing Systems
- Bruel and Kjaer
- Kistler Group
- TE Connectivity
- Dytran Instruments
- Ceramtec GmbH
- APC International
- RION
- Kyowa Electronic Instruments
- Piezo Systems
- Abbott
- Medtronic
- F. Hoffman-La Roche
- Siemens
- LifeScan
- LifeSensors
Notable Milestones in HMI Sensors Sector
- 2020: Introduction of AI-powered HMI sensor technology by xx company.
- 2021: Acquisition of xx sensor company by xx corporation.
- 2022: Launch of a new generation of miniature pressure sensors by xx company.
- 2023: Significant increase in M&A activity within the HMI sensor industry.
- 2024: Approval of new safety standards impacting HMI sensor designs.
- 2025: Release of improved high-accuracy capacitive sensor technology by several companies
In-Depth HMI Sensors Market Outlook
The HMI Sensors market is poised for significant growth driven by increasing automation across industries, the integration of advanced sensor technologies into IoT devices and wearable technologies, and the expansion into new applications. The rising adoption of AI and machine learning in HMI systems will propel further growth. Strategic investments in R&D, partnerships with system integrators, and expansion into emerging markets are crucial for capturing the substantial market potential. Long-term growth is expected to be driven by continued innovation, market diversification, and the integration of HMI sensors into an increasingly interconnected digital world.
HMI Sensors Segmentation
-
1. Application
- 1.1. Industrial & Manufacturing
- 1.2. Automotive
- 1.3. Medical Device
- 1.4. Consumer Electronics
- 1.5. Others
-
2. Types
- 2.1. Mechanical Sensors
- 2.2. Biosensors
HMI Sensors Segmentation By Geography
-
1. North America
- 1.1. United States
- 1.2. Canada
- 1.3. Mexico
-
2. South America
- 2.1. Brazil
- 2.2. Argentina
- 2.3. Rest of South America
-
3. Europe
- 3.1. United Kingdom
- 3.2. Germany
- 3.3. France
- 3.4. Italy
- 3.5. Spain
- 3.6. Russia
- 3.7. Benelux
- 3.8. Nordics
- 3.9. Rest of Europe
-
4. Middle East & Africa
- 4.1. Turkey
- 4.2. Israel
- 4.3. GCC
- 4.4. North Africa
- 4.5. South Africa
- 4.6. Rest of Middle East & Africa
-
5. Asia Pacific
- 5.1. China
- 5.2. India
- 5.3. Japan
- 5.4. South Korea
- 5.5. ASEAN
- 5.6. Oceania
- 5.7. Rest of Asia Pacific
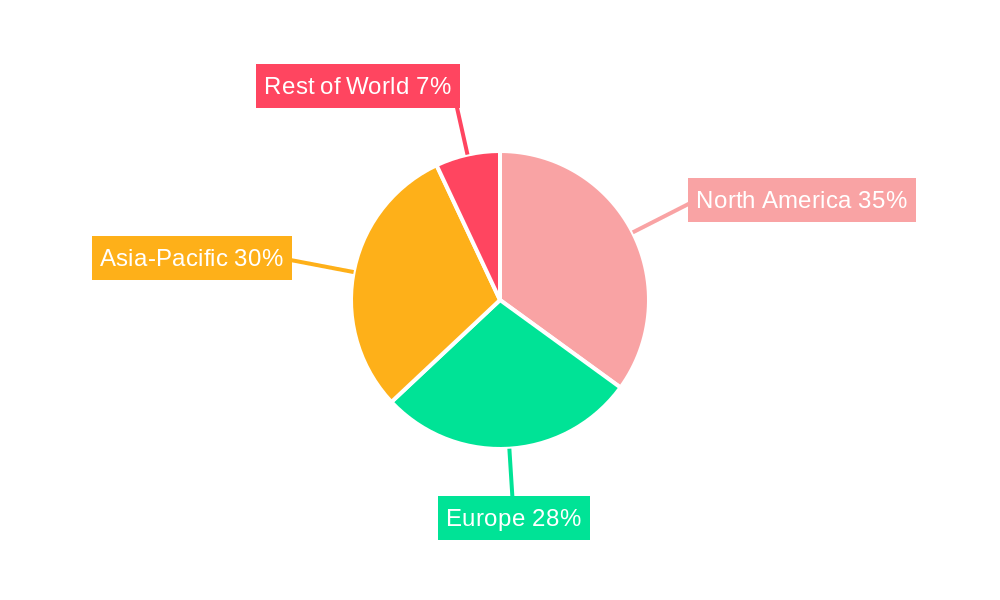
HMI Sensors Regional Market Share
Geographic Coverage of HMI Sensors
HMI Sensors REPORT HIGHLIGHTS
| Aspects | Details |
|---|---|
| Study Period | 2020-2034 |
| Base Year | 2025 |
| Estimated Year | 2026 |
| Forecast Period | 2026-2034 |
| Historical Period | 2020-2025 |
| Growth Rate | CAGR of XX% from 2020-2034 |
| Segmentation |
|
Table of Contents
- 1. Introduction
- 1.1. Research Scope
- 1.2. Market Segmentation
- 1.3. Research Methodology
- 1.4. Definitions and Assumptions
- 2. Executive Summary
- 2.1. Introduction
- 3. Market Dynamics
- 3.1. Introduction
- 3.2. Market Drivers
- 3.3. Market Restrains
- 3.4. Market Trends
- 4. Market Factor Analysis
- 4.1. Porters Five Forces
- 4.2. Supply/Value Chain
- 4.3. PESTEL analysis
- 4.4. Market Entropy
- 4.5. Patent/Trademark Analysis
- 5. Global HMI Sensors Analysis, Insights and Forecast, 2020-2032
- 5.1. Market Analysis, Insights and Forecast - by Application
- 5.1.1. Industrial & Manufacturing
- 5.1.2. Automotive
- 5.1.3. Medical Device
- 5.1.4. Consumer Electronics
- 5.1.5. Others
- 5.2. Market Analysis, Insights and Forecast - by Types
- 5.2.1. Mechanical Sensors
- 5.2.2. Biosensors
- 5.3. Market Analysis, Insights and Forecast - by Region
- 5.3.1. North America
- 5.3.2. South America
- 5.3.3. Europe
- 5.3.4. Middle East & Africa
- 5.3.5. Asia Pacific
- 5.1. Market Analysis, Insights and Forecast - by Application
- 6. North America HMI Sensors Analysis, Insights and Forecast, 2020-2032
- 6.1. Market Analysis, Insights and Forecast - by Application
- 6.1.1. Industrial & Manufacturing
- 6.1.2. Automotive
- 6.1.3. Medical Device
- 6.1.4. Consumer Electronics
- 6.1.5. Others
- 6.2. Market Analysis, Insights and Forecast - by Types
- 6.2.1. Mechanical Sensors
- 6.2.2. Biosensors
- 6.1. Market Analysis, Insights and Forecast - by Application
- 7. South America HMI Sensors Analysis, Insights and Forecast, 2020-2032
- 7.1. Market Analysis, Insights and Forecast - by Application
- 7.1.1. Industrial & Manufacturing
- 7.1.2. Automotive
- 7.1.3. Medical Device
- 7.1.4. Consumer Electronics
- 7.1.5. Others
- 7.2. Market Analysis, Insights and Forecast - by Types
- 7.2.1. Mechanical Sensors
- 7.2.2. Biosensors
- 7.1. Market Analysis, Insights and Forecast - by Application
- 8. Europe HMI Sensors Analysis, Insights and Forecast, 2020-2032
- 8.1. Market Analysis, Insights and Forecast - by Application
- 8.1.1. Industrial & Manufacturing
- 8.1.2. Automotive
- 8.1.3. Medical Device
- 8.1.4. Consumer Electronics
- 8.1.5. Others
- 8.2. Market Analysis, Insights and Forecast - by Types
- 8.2.1. Mechanical Sensors
- 8.2.2. Biosensors
- 8.1. Market Analysis, Insights and Forecast - by Application
- 9. Middle East & Africa HMI Sensors Analysis, Insights and Forecast, 2020-2032
- 9.1. Market Analysis, Insights and Forecast - by Application
- 9.1.1. Industrial & Manufacturing
- 9.1.2. Automotive
- 9.1.3. Medical Device
- 9.1.4. Consumer Electronics
- 9.1.5. Others
- 9.2. Market Analysis, Insights and Forecast - by Types
- 9.2.1. Mechanical Sensors
- 9.2.2. Biosensors
- 9.1. Market Analysis, Insights and Forecast - by Application
- 10. Asia Pacific HMI Sensors Analysis, Insights and Forecast, 2020-2032
- 10.1. Market Analysis, Insights and Forecast - by Application
- 10.1.1. Industrial & Manufacturing
- 10.1.2. Automotive
- 10.1.3. Medical Device
- 10.1.4. Consumer Electronics
- 10.1.5. Others
- 10.2. Market Analysis, Insights and Forecast - by Types
- 10.2.1. Mechanical Sensors
- 10.2.2. Biosensors
- 10.1. Market Analysis, Insights and Forecast - by Application
- 11. Competitive Analysis
- 11.1. Global Market Share Analysis 2025
- 11.2. Company Profiles
- 11.2.1 Azoteq
- 11.2.1.1. Overview
- 11.2.1.2. Products
- 11.2.1.3. SWOT Analysis
- 11.2.1.4. Recent Developments
- 11.2.1.5. Financials (Based on Availability)
- 11.2.2 Microchip
- 11.2.2.1. Overview
- 11.2.2.2. Products
- 11.2.2.3. SWOT Analysis
- 11.2.2.4. Recent Developments
- 11.2.2.5. Financials (Based on Availability)
- 11.2.3 Texas Instruments
- 11.2.3.1. Overview
- 11.2.3.2. Products
- 11.2.3.3. SWOT Analysis
- 11.2.3.4. Recent Developments
- 11.2.3.5. Financials (Based on Availability)
- 11.2.4 Renesas
- 11.2.4.1. Overview
- 11.2.4.2. Products
- 11.2.4.3. SWOT Analysis
- 11.2.4.4. Recent Developments
- 11.2.4.5. Financials (Based on Availability)
- 11.2.5 PCB Piezotronics
- 11.2.5.1. Overview
- 11.2.5.2. Products
- 11.2.5.3. SWOT Analysis
- 11.2.5.4. Recent Developments
- 11.2.5.5. Financials (Based on Availability)
- 11.2.6 Honeywell
- 11.2.6.1. Overview
- 11.2.6.2. Products
- 11.2.6.3. SWOT Analysis
- 11.2.6.4. Recent Developments
- 11.2.6.5. Financials (Based on Availability)
- 11.2.7 Meggitt Sensing Systems
- 11.2.7.1. Overview
- 11.2.7.2. Products
- 11.2.7.3. SWOT Analysis
- 11.2.7.4. Recent Developments
- 11.2.7.5. Financials (Based on Availability)
- 11.2.8 Bruel and Kjaer
- 11.2.8.1. Overview
- 11.2.8.2. Products
- 11.2.8.3. SWOT Analysis
- 11.2.8.4. Recent Developments
- 11.2.8.5. Financials (Based on Availability)
- 11.2.9 Kistler Group
- 11.2.9.1. Overview
- 11.2.9.2. Products
- 11.2.9.3. SWOT Analysis
- 11.2.9.4. Recent Developments
- 11.2.9.5. Financials (Based on Availability)
- 11.2.10 TE Connectivity
- 11.2.10.1. Overview
- 11.2.10.2. Products
- 11.2.10.3. SWOT Analysis
- 11.2.10.4. Recent Developments
- 11.2.10.5. Financials (Based on Availability)
- 11.2.11 Dytran Instruments
- 11.2.11.1. Overview
- 11.2.11.2. Products
- 11.2.11.3. SWOT Analysis
- 11.2.11.4. Recent Developments
- 11.2.11.5. Financials (Based on Availability)
- 11.2.12 Ceramtec GmbH
- 11.2.12.1. Overview
- 11.2.12.2. Products
- 11.2.12.3. SWOT Analysis
- 11.2.12.4. Recent Developments
- 11.2.12.5. Financials (Based on Availability)
- 11.2.13 APC International
- 11.2.13.1. Overview
- 11.2.13.2. Products
- 11.2.13.3. SWOT Analysis
- 11.2.13.4. Recent Developments
- 11.2.13.5. Financials (Based on Availability)
- 11.2.14 RION
- 11.2.14.1. Overview
- 11.2.14.2. Products
- 11.2.14.3. SWOT Analysis
- 11.2.14.4. Recent Developments
- 11.2.14.5. Financials (Based on Availability)
- 11.2.15 Kyowa Electronic Instruments
- 11.2.15.1. Overview
- 11.2.15.2. Products
- 11.2.15.3. SWOT Analysis
- 11.2.15.4. Recent Developments
- 11.2.15.5. Financials (Based on Availability)
- 11.2.16 Piezo Systems
- 11.2.16.1. Overview
- 11.2.16.2. Products
- 11.2.16.3. SWOT Analysis
- 11.2.16.4. Recent Developments
- 11.2.16.5. Financials (Based on Availability)
- 11.2.17 Abbott
- 11.2.17.1. Overview
- 11.2.17.2. Products
- 11.2.17.3. SWOT Analysis
- 11.2.17.4. Recent Developments
- 11.2.17.5. Financials (Based on Availability)
- 11.2.18 Medtronic
- 11.2.18.1. Overview
- 11.2.18.2. Products
- 11.2.18.3. SWOT Analysis
- 11.2.18.4. Recent Developments
- 11.2.18.5. Financials (Based on Availability)
- 11.2.19 F. Hoffman-La Roche
- 11.2.19.1. Overview
- 11.2.19.2. Products
- 11.2.19.3. SWOT Analysis
- 11.2.19.4. Recent Developments
- 11.2.19.5. Financials (Based on Availability)
- 11.2.20 Siemens
- 11.2.20.1. Overview
- 11.2.20.2. Products
- 11.2.20.3. SWOT Analysis
- 11.2.20.4. Recent Developments
- 11.2.20.5. Financials (Based on Availability)
- 11.2.21 LifeScan
- 11.2.21.1. Overview
- 11.2.21.2. Products
- 11.2.21.3. SWOT Analysis
- 11.2.21.4. Recent Developments
- 11.2.21.5. Financials (Based on Availability)
- 11.2.22 LifeSensors
- 11.2.22.1. Overview
- 11.2.22.2. Products
- 11.2.22.3. SWOT Analysis
- 11.2.22.4. Recent Developments
- 11.2.22.5. Financials (Based on Availability)
- 11.2.1 Azoteq
List of Figures
- Figure 1: Global HMI Sensors Revenue Breakdown (million, %) by Region 2025 & 2033
- Figure 2: North America HMI Sensors Revenue (million), by Application 2025 & 2033
- Figure 3: North America HMI Sensors Revenue Share (%), by Application 2025 & 2033
- Figure 4: North America HMI Sensors Revenue (million), by Types 2025 & 2033
- Figure 5: North America HMI Sensors Revenue Share (%), by Types 2025 & 2033
- Figure 6: North America HMI Sensors Revenue (million), by Country 2025 & 2033
- Figure 7: North America HMI Sensors Revenue Share (%), by Country 2025 & 2033
- Figure 8: South America HMI Sensors Revenue (million), by Application 2025 & 2033
- Figure 9: South America HMI Sensors Revenue Share (%), by Application 2025 & 2033
- Figure 10: South America HMI Sensors Revenue (million), by Types 2025 & 2033
- Figure 11: South America HMI Sensors Revenue Share (%), by Types 2025 & 2033
- Figure 12: South America HMI Sensors Revenue (million), by Country 2025 & 2033
- Figure 13: South America HMI Sensors Revenue Share (%), by Country 2025 & 2033
- Figure 14: Europe HMI Sensors Revenue (million), by Application 2025 & 2033
- Figure 15: Europe HMI Sensors Revenue Share (%), by Application 2025 & 2033
- Figure 16: Europe HMI Sensors Revenue (million), by Types 2025 & 2033
- Figure 17: Europe HMI Sensors Revenue Share (%), by Types 2025 & 2033
- Figure 18: Europe HMI Sensors Revenue (million), by Country 2025 & 2033
- Figure 19: Europe HMI Sensors Revenue Share (%), by Country 2025 & 2033
- Figure 20: Middle East & Africa HMI Sensors Revenue (million), by Application 2025 & 2033
- Figure 21: Middle East & Africa HMI Sensors Revenue Share (%), by Application 2025 & 2033
- Figure 22: Middle East & Africa HMI Sensors Revenue (million), by Types 2025 & 2033
- Figure 23: Middle East & Africa HMI Sensors Revenue Share (%), by Types 2025 & 2033
- Figure 24: Middle East & Africa HMI Sensors Revenue (million), by Country 2025 & 2033
- Figure 25: Middle East & Africa HMI Sensors Revenue Share (%), by Country 2025 & 2033
- Figure 26: Asia Pacific HMI Sensors Revenue (million), by Application 2025 & 2033
- Figure 27: Asia Pacific HMI Sensors Revenue Share (%), by Application 2025 & 2033
- Figure 28: Asia Pacific HMI Sensors Revenue (million), by Types 2025 & 2033
- Figure 29: Asia Pacific HMI Sensors Revenue Share (%), by Types 2025 & 2033
- Figure 30: Asia Pacific HMI Sensors Revenue (million), by Country 2025 & 2033
- Figure 31: Asia Pacific HMI Sensors Revenue Share (%), by Country 2025 & 2033
List of Tables
- Table 1: Global HMI Sensors Revenue million Forecast, by Application 2020 & 2033
- Table 2: Global HMI Sensors Revenue million Forecast, by Types 2020 & 2033
- Table 3: Global HMI Sensors Revenue million Forecast, by Region 2020 & 2033
- Table 4: Global HMI Sensors Revenue million Forecast, by Application 2020 & 2033
- Table 5: Global HMI Sensors Revenue million Forecast, by Types 2020 & 2033
- Table 6: Global HMI Sensors Revenue million Forecast, by Country 2020 & 2033
- Table 7: United States HMI Sensors Revenue (million) Forecast, by Application 2020 & 2033
- Table 8: Canada HMI Sensors Revenue (million) Forecast, by Application 2020 & 2033
- Table 9: Mexico HMI Sensors Revenue (million) Forecast, by Application 2020 & 2033
- Table 10: Global HMI Sensors Revenue million Forecast, by Application 2020 & 2033
- Table 11: Global HMI Sensors Revenue million Forecast, by Types 2020 & 2033
- Table 12: Global HMI Sensors Revenue million Forecast, by Country 2020 & 2033
- Table 13: Brazil HMI Sensors Revenue (million) Forecast, by Application 2020 & 2033
- Table 14: Argentina HMI Sensors Revenue (million) Forecast, by Application 2020 & 2033
- Table 15: Rest of South America HMI Sensors Revenue (million) Forecast, by Application 2020 & 2033
- Table 16: Global HMI Sensors Revenue million Forecast, by Application 2020 & 2033
- Table 17: Global HMI Sensors Revenue million Forecast, by Types 2020 & 2033
- Table 18: Global HMI Sensors Revenue million Forecast, by Country 2020 & 2033
- Table 19: United Kingdom HMI Sensors Revenue (million) Forecast, by Application 2020 & 2033
- Table 20: Germany HMI Sensors Revenue (million) Forecast, by Application 2020 & 2033
- Table 21: France HMI Sensors Revenue (million) Forecast, by Application 2020 & 2033
- Table 22: Italy HMI Sensors Revenue (million) Forecast, by Application 2020 & 2033
- Table 23: Spain HMI Sensors Revenue (million) Forecast, by Application 2020 & 2033
- Table 24: Russia HMI Sensors Revenue (million) Forecast, by Application 2020 & 2033
- Table 25: Benelux HMI Sensors Revenue (million) Forecast, by Application 2020 & 2033
- Table 26: Nordics HMI Sensors Revenue (million) Forecast, by Application 2020 & 2033
- Table 27: Rest of Europe HMI Sensors Revenue (million) Forecast, by Application 2020 & 2033
- Table 28: Global HMI Sensors Revenue million Forecast, by Application 2020 & 2033
- Table 29: Global HMI Sensors Revenue million Forecast, by Types 2020 & 2033
- Table 30: Global HMI Sensors Revenue million Forecast, by Country 2020 & 2033
- Table 31: Turkey HMI Sensors Revenue (million) Forecast, by Application 2020 & 2033
- Table 32: Israel HMI Sensors Revenue (million) Forecast, by Application 2020 & 2033
- Table 33: GCC HMI Sensors Revenue (million) Forecast, by Application 2020 & 2033
- Table 34: North Africa HMI Sensors Revenue (million) Forecast, by Application 2020 & 2033
- Table 35: South Africa HMI Sensors Revenue (million) Forecast, by Application 2020 & 2033
- Table 36: Rest of Middle East & Africa HMI Sensors Revenue (million) Forecast, by Application 2020 & 2033
- Table 37: Global HMI Sensors Revenue million Forecast, by Application 2020 & 2033
- Table 38: Global HMI Sensors Revenue million Forecast, by Types 2020 & 2033
- Table 39: Global HMI Sensors Revenue million Forecast, by Country 2020 & 2033
- Table 40: China HMI Sensors Revenue (million) Forecast, by Application 2020 & 2033
- Table 41: India HMI Sensors Revenue (million) Forecast, by Application 2020 & 2033
- Table 42: Japan HMI Sensors Revenue (million) Forecast, by Application 2020 & 2033
- Table 43: South Korea HMI Sensors Revenue (million) Forecast, by Application 2020 & 2033
- Table 44: ASEAN HMI Sensors Revenue (million) Forecast, by Application 2020 & 2033
- Table 45: Oceania HMI Sensors Revenue (million) Forecast, by Application 2020 & 2033
- Table 46: Rest of Asia Pacific HMI Sensors Revenue (million) Forecast, by Application 2020 & 2033
Frequently Asked Questions
1. What is the projected Compound Annual Growth Rate (CAGR) of the HMI Sensors?
The projected CAGR is approximately XX%.
2. Which companies are prominent players in the HMI Sensors?
Key companies in the market include Azoteq, Microchip, Texas Instruments, Renesas, PCB Piezotronics, Honeywell, Meggitt Sensing Systems, Bruel and Kjaer, Kistler Group, TE Connectivity, Dytran Instruments, Ceramtec GmbH, APC International, RION, Kyowa Electronic Instruments, Piezo Systems, Abbott, Medtronic, F. Hoffman-La Roche, Siemens, LifeScan, LifeSensors.
3. What are the main segments of the HMI Sensors?
The market segments include Application, Types.
4. Can you provide details about the market size?
The market size is estimated to be USD XXX million as of 2022.
5. What are some drivers contributing to market growth?
N/A
6. What are the notable trends driving market growth?
N/A
7. Are there any restraints impacting market growth?
N/A
8. Can you provide examples of recent developments in the market?
N/A
9. What pricing options are available for accessing the report?
Pricing options include single-user, multi-user, and enterprise licenses priced at USD 2900.00, USD 4350.00, and USD 5800.00 respectively.
10. Is the market size provided in terms of value or volume?
The market size is provided in terms of value, measured in million.
11. Are there any specific market keywords associated with the report?
Yes, the market keyword associated with the report is "HMI Sensors," which aids in identifying and referencing the specific market segment covered.
12. How do I determine which pricing option suits my needs best?
The pricing options vary based on user requirements and access needs. Individual users may opt for single-user licenses, while businesses requiring broader access may choose multi-user or enterprise licenses for cost-effective access to the report.
13. Are there any additional resources or data provided in the HMI Sensors report?
While the report offers comprehensive insights, it's advisable to review the specific contents or supplementary materials provided to ascertain if additional resources or data are available.
14. How can I stay updated on further developments or reports in the HMI Sensors?
To stay informed about further developments, trends, and reports in the HMI Sensors, consider subscribing to industry newsletters, following relevant companies and organizations, or regularly checking reputable industry news sources and publications.
Methodology
Step 1 - Identification of Relevant Samples Size from Population Database


Step 2 - Approaches for Defining Global Market Size (Value, Volume* & Price*)

Note*: In applicable scenarios
Step 3 - Data Sources
Primary Research
- Web Analytics
- Survey Reports
- Research Institute
- Latest Research Reports
- Opinion Leaders
Secondary Research
- Annual Reports
- White Paper
- Latest Press Release
- Industry Association
- Paid Database
- Investor Presentations

Step 4 - Data Triangulation
Involves using different sources of information in order to increase the validity of a study
These sources are likely to be stakeholders in a program - participants, other researchers, program staff, other community members, and so on.
Then we put all data in single framework & apply various statistical tools to find out the dynamic on the market.
During the analysis stage, feedback from the stakeholder groups would be compared to determine areas of agreement as well as areas of divergence