

Key Insights
The global hockey equipment market, including sticks, balls, footwear, and protective gear, is poised for substantial expansion. Projections indicate a Compound Annual Growth Rate (CAGR) of 7.5% from 2025 to 2033. This growth is propelled by escalating participation rates across amateur and professional levels, especially in burgeoning markets such as the Asia-Pacific and South America. Enhanced media coverage and lucrative sponsorship deals are elevating the sport's profile, consequently driving demand for specialized equipment. Innovations in stick technology, materials science (e.g., advanced composites for reduced weight and increased durability), and protective gear are augmenting performance and player safety, attracting both novice and seasoned athletes. The convenience offered by online retail channels further facilitates access to a diverse product range, contributing to market proliferation. Challenges include the premium pricing of certain equipment, potentially limiting adoption in lower-income regions, alongside seasonal demand fluctuations and potential supply chain volatilities. The market is segmented by product categories—hockey sticks and balls, field hockey shoes, protective gear, and accessories—and by distribution channels, encompassing offline and online retail. Leading entities like Ritual Hockey, Adidas AG, and Brabo Hockey are actively engaged in market competition through continuous product development and targeted marketing. While North America currently dominates, significant growth is anticipated from the Asia-Pacific region, fueled by rising player numbers and infrastructure development.
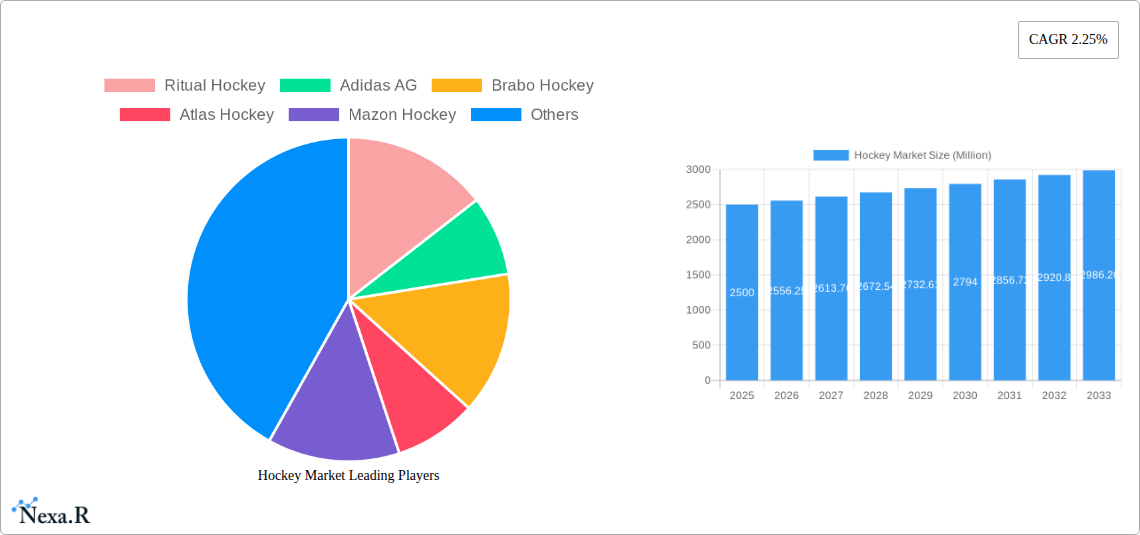
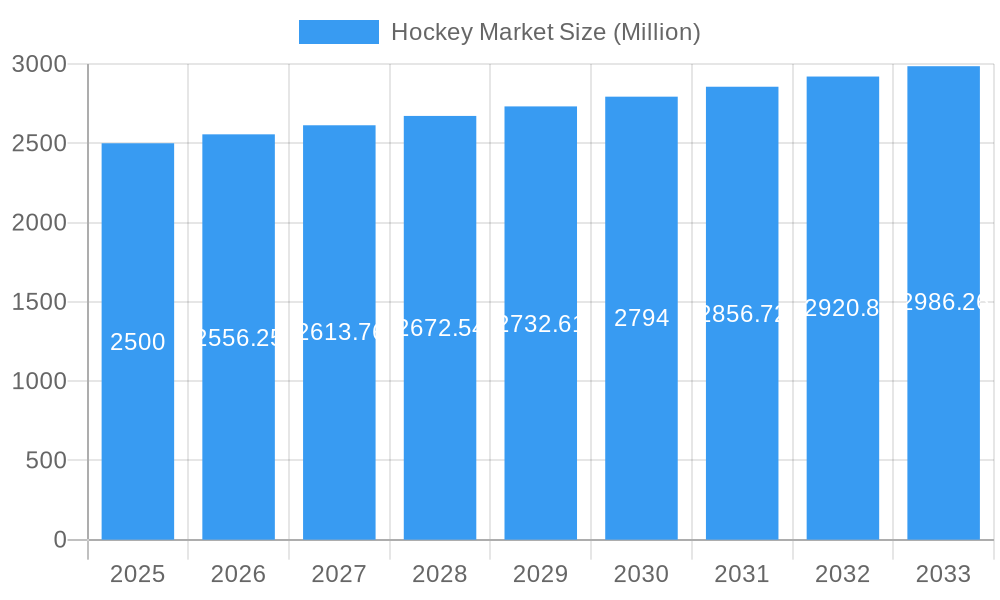
Hockey Market Market Size (In Billion)
The competitive arena features a blend of established brands and agile newcomers. Dominant players capitalize on their brand equity and extensive distribution networks, while emerging companies prioritize innovation and specialized market segments to establish a foothold. Future market trajectory will be shaped by ongoing innovation, strategic collaborations, and geographical expansion. A growing consumer consciousness towards sustainability and ethical sourcing is fostering demand for eco-friendly materials. Effective marketing campaigns that highlight equipment benefits and the holistic health and social advantages of hockey will be instrumental in future market acceleration. The market's robust growth trajectory, combined with continuous innovation and expansion into new territories, indicates sustained success in the foreseeable future.
Hockey Market Company Market Share
Hockey Market: A Comprehensive Market Report (2019-2033)
This comprehensive report provides an in-depth analysis of the Hockey Market, encompassing its dynamics, growth trends, key players, and future outlook. We delve into the parent market of sporting goods and the child market of field hockey equipment, providing a granular understanding of this dynamic sector. The study period covers 2019-2033, with 2025 as the base and estimated year. The forecast period extends from 2025 to 2033, utilizing data from the historical period (2019-2024). The market size is valued in million units.
Hockey Market Dynamics & Structure
The global hockey market exhibits a moderately concentrated structure, with key players such as Ritual Hockey, Adidas AG, and Grays of Cambridge holding significant market share. Technological innovations, particularly in stick design and protective gear, are major drivers, alongside evolving player preferences and increasing participation rates. Regulatory frameworks, while generally less stringent than in other sports, still impact material safety and product standards. Competitive substitutes, such as alternative sports and recreational activities, pose a moderate challenge. The market is segmented by product type (Hockey Sticks and Balls, Field Hockey Shoes, Protective Gear and Accessories) and distribution channel (Offline Retail Stores, Online Retail Stores). M&A activity is relatively low, with xx deals recorded between 2019 and 2024, indicating a stable but not highly consolidated landscape.
- Market Concentration: Moderately concentrated, with top 5 players holding approximately xx% market share in 2024.
- Innovation Drivers: Lightweight materials, ergonomic designs, and advanced performance technologies.
- Regulatory Framework: Primarily focuses on safety standards for protective gear.
- Competitive Substitutes: Other team sports, individual recreational activities.
- End-User Demographics: Growing participation among youth and adults, particularly in developed regions.
- M&A Trends: Relatively low M&A activity, with xx deals recorded between 2019 and 2024.
Hockey Market Growth Trends & Insights
The hockey market is experiencing steady growth, driven by rising participation rates, particularly in youth leagues and recreational settings. The market size, estimated at xx million units in 2025, is projected to reach xx million units by 2033, exhibiting a CAGR of xx% during the forecast period. Technological advancements in equipment, creating higher performance and durability, further stimulate demand. Consumer behavior is shifting towards online purchasing and a preference for customized equipment. Increased media exposure and professional league growth contribute to market expansion.
Dominant Regions, Countries, or Segments in Hockey Market
North America and Europe currently dominate the global hockey market, accounting for xx% and xx% of the total market value in 2024, respectively. Within product types, Hockey Sticks and Balls hold the largest market share, followed by Protective Gear and Accessories. Offline retail stores remain the dominant distribution channel, although online sales are exhibiting significant growth. The growth in these regions is fueled by strong sporting cultures, established leagues, and well-developed retail infrastructure. Emerging markets in Asia and South America present significant untapped potential for future growth.
- Key Drivers (North America): Strong youth leagues, established professional leagues, high disposable income.
- Key Drivers (Europe): Established hockey culture, high participation rates, robust retail networks.
- Product Type Dominance: Hockey Sticks and Balls (xx% market share in 2024), followed by Protective Gear and Accessories (xx%).
- Distribution Channel Dominance: Offline Retail Stores (xx% market share in 2024), with online growing rapidly.
Hockey Market Product Landscape
The hockey market is characterized by ongoing innovation in stick design, focusing on improved weight distribution, aerodynamics, and enhanced shot power. Protective gear is constantly evolving, incorporating lighter, more flexible, and impact-resistant materials. Key features include advanced composite materials, customizable fit options, and enhanced performance metrics like ball speed and shot accuracy. Companies are increasingly focusing on unique selling propositions such as proprietary materials, personalized customization, and technological advancements to improve overall playing experience.
Key Drivers, Barriers & Challenges in Hockey Market
Key Drivers: Increasing participation rates in youth and adult leagues, technological advancements leading to improved equipment, and rising disposable incomes in key markets. Government support for sports infrastructure in some regions also contributes to market growth.
Challenges & Restraints: High initial investment in equipment can be a barrier for new players, while intense competition among manufacturers puts pressure on margins. Supply chain disruptions and fluctuating material costs pose operational challenges. The impact of these challenges is estimated to reduce the market growth by approximately xx% during the forecast period.
Emerging Opportunities in Hockey Market
Growing interest in recreational hockey is creating new opportunities, particularly in personalized equipment and customized training programs. The expansion of e-commerce and online retail channels presents further opportunities for market penetration. Furthermore, developing markets in Asia and South America offer significant potential for future growth. Innovative product designs that target specific player needs represent a key area of opportunity.
Growth Accelerators in the Hockey Market Industry
Strategic partnerships, such as the one between Ritual Hockey and Clubhouse Hockey, are crucial for market expansion. Technological breakthroughs in materials science and manufacturing processes are paving the way for lighter, stronger, and more durable equipment. The growth of e-commerce platforms enables wider access and potentially lower distribution costs.
Key Players Shaping the Hockey Market Market
- Ritual Hockey
- Adidas AG
- Brabo Hockey
- Atlas Hockey
- Mazon Hockey
- Dita Hockey
- Grays of Cambridge (International) Ltd
- Osaka World
- Gryphon Hockey Ltd
- STX
- OBO
- Princess Sportsgear
Notable Milestones in Hockey Market Sector
- June 2021: USA Field Hockey launched its online equipment store, improving accessibility to the sport.
- May 2021: Ritual Hockey partnered with Clubhouse Hockey to expand market reach.
- June 2020: Ritual Hockey introduced the Plus + head shape hockey stick, increasing surface area by 20%.
In-Depth Hockey Market Market Outlook
The hockey market is poised for continued growth, driven by technological innovation, strategic partnerships, and expanding participation rates. The focus on lightweight, high-performance equipment and increased accessibility will stimulate demand. Strategic investments in market expansion, particularly in emerging economies, will be key to unlocking long-term growth potential. The market's positive outlook underscores the attractive opportunities for existing and new players alike.
Hockey Market Segmentation
-
1. Product Type
- 1.1. Hockey Sticks and Balls
- 1.2. Field Hockey Shoes
-
1.3. Protective Gear and Accessories
- 1.3.1. Pads
- 1.3.2. Helmets
- 1.3.3. Other Protective Gears and Accessories
-
2. Distribution Channel
- 2.1. Offline Retail Stores
- 2.2. Online Retail Stores
Hockey Market Segmentation By Geography
-
1. North America
- 1.1. United States
- 1.2. Canada
- 1.3. Mexico
- 1.4. Rest of North America
-
2. Europe
- 2.1. Spain
- 2.2. United Kingdom
- 2.3. Germany
- 2.4. France
- 2.5. Italy
- 2.6. Russia
- 2.7. Rest of Europe
-
3. Asia Pacific
- 3.1. China
- 3.2. Japan
- 3.3. India
- 3.4. Australia
- 3.5. Rest of Asia Pacific
-
4. South America
- 4.1. Brazil
- 4.2. Argentina
- 4.3. Rest of South America
-
5. Middle East and Africa
- 5.1. South Africa
- 5.2. United Arab Emirates
- 5.3. Rest of Middle East and Africa
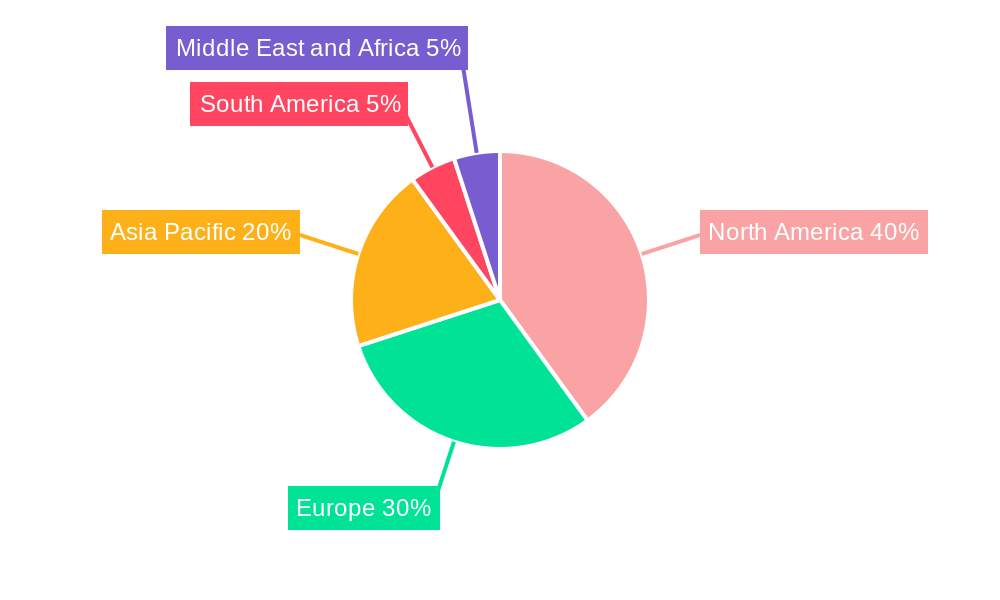
Hockey Market Regional Market Share
Geographic Coverage of Hockey Market
Hockey Market REPORT HIGHLIGHTS
| Aspects | Details |
|---|---|
| Study Period | 2020-2034 |
| Base Year | 2025 |
| Estimated Year | 2026 |
| Forecast Period | 2026-2034 |
| Historical Period | 2020-2025 |
| Growth Rate | CAGR of 7.5% from 2020-2034 |
| Segmentation |
|
Table of Contents
- 1. Introduction
- 1.1. Research Scope
- 1.2. Market Segmentation
- 1.3. Research Objective
- 1.4. Definitions and Assumptions
- 2. Executive Summary
- 2.1. Market Snapshot
- 3. Market Dynamics
- 3.1. Market Drivers
- 3.2. Market Restrains
- 3.3. Market Trends
- 3.4. Market Opportunities
- 4. Market Factor Analysis
- 4.1. Porters Five Forces
- 4.1.1. Bargaining Power of Suppliers
- 4.1.2. Bargaining Power of Buyers
- 4.1.3. Threat of New Entrants
- 4.1.4. Threat of Substitutes
- 4.1.5. Competitive Rivalry
- 4.2. PESTEL analysis
- 4.3. BCG Analysis
- 4.3.1. Stars (High Growth, High Market Share)
- 4.3.2. Cash Cows (Low Growth, High Market Share)
- 4.3.3. Question Mark (High Growth, Low Market Share)
- 4.3.4. Dogs (Low Growth, Low Market Share)
- 4.4. Ansoff Matrix Analysis
- 4.5. Supply Chain Analysis
- 4.6. Regulatory Landscape
- 4.7. Current Market Potential and Opportunity Assessment (TAM–SAM–SOM Framework)
- 4.8. NRP Analyst Note
- 4.1. Porters Five Forces
- 5. Market Analysis, Insights and Forecast 2021-2033
- 5.1. Market Analysis, Insights and Forecast - by Product Type
- 5.1.1. Hockey Sticks and Balls
- 5.1.2. Field Hockey Shoes
- 5.1.3. Protective Gear and Accessories
- 5.1.3.1. Pads
- 5.1.3.2. Helmets
- 5.1.3.3. Other Protective Gears and Accessories
- 5.2. Market Analysis, Insights and Forecast - by Distribution Channel
- 5.2.1. Offline Retail Stores
- 5.2.2. Online Retail Stores
- 5.3. Market Analysis, Insights and Forecast - by Region
- 5.3.1. North America
- 5.3.2. Europe
- 5.3.3. Asia Pacific
- 5.3.4. South America
- 5.3.5. Middle East and Africa
- 5.1. Market Analysis, Insights and Forecast - by Product Type
- 6. Global Hockey Market Analysis, Insights and Forecast, 2021-2033
- 6.1. Market Analysis, Insights and Forecast - by Product Type
- 6.1.1. Hockey Sticks and Balls
- 6.1.2. Field Hockey Shoes
- 6.1.3. Protective Gear and Accessories
- 6.1.3.1. Pads
- 6.1.3.2. Helmets
- 6.1.3.3. Other Protective Gears and Accessories
- 6.2. Market Analysis, Insights and Forecast - by Distribution Channel
- 6.2.1. Offline Retail Stores
- 6.2.2. Online Retail Stores
- 6.1. Market Analysis, Insights and Forecast - by Product Type
- 7. North America Hockey Market Analysis, Insights and Forecast, 2020-2032
- 7.1. Market Analysis, Insights and Forecast - by Product Type
- 7.1.1. Hockey Sticks and Balls
- 7.1.2. Field Hockey Shoes
- 7.1.3. Protective Gear and Accessories
- 7.1.3.1. Pads
- 7.1.3.2. Helmets
- 7.1.3.3. Other Protective Gears and Accessories
- 7.2. Market Analysis, Insights and Forecast - by Distribution Channel
- 7.2.1. Offline Retail Stores
- 7.2.2. Online Retail Stores
- 7.1. Market Analysis, Insights and Forecast - by Product Type
- 8. Europe Hockey Market Analysis, Insights and Forecast, 2020-2032
- 8.1. Market Analysis, Insights and Forecast - by Product Type
- 8.1.1. Hockey Sticks and Balls
- 8.1.2. Field Hockey Shoes
- 8.1.3. Protective Gear and Accessories
- 8.1.3.1. Pads
- 8.1.3.2. Helmets
- 8.1.3.3. Other Protective Gears and Accessories
- 8.2. Market Analysis, Insights and Forecast - by Distribution Channel
- 8.2.1. Offline Retail Stores
- 8.2.2. Online Retail Stores
- 8.1. Market Analysis, Insights and Forecast - by Product Type
- 9. Asia Pacific Hockey Market Analysis, Insights and Forecast, 2020-2032
- 9.1. Market Analysis, Insights and Forecast - by Product Type
- 9.1.1. Hockey Sticks and Balls
- 9.1.2. Field Hockey Shoes
- 9.1.3. Protective Gear and Accessories
- 9.1.3.1. Pads
- 9.1.3.2. Helmets
- 9.1.3.3. Other Protective Gears and Accessories
- 9.2. Market Analysis, Insights and Forecast - by Distribution Channel
- 9.2.1. Offline Retail Stores
- 9.2.2. Online Retail Stores
- 9.1. Market Analysis, Insights and Forecast - by Product Type
- 10. South America Hockey Market Analysis, Insights and Forecast, 2020-2032
- 10.1. Market Analysis, Insights and Forecast - by Product Type
- 10.1.1. Hockey Sticks and Balls
- 10.1.2. Field Hockey Shoes
- 10.1.3. Protective Gear and Accessories
- 10.1.3.1. Pads
- 10.1.3.2. Helmets
- 10.1.3.3. Other Protective Gears and Accessories
- 10.2. Market Analysis, Insights and Forecast - by Distribution Channel
- 10.2.1. Offline Retail Stores
- 10.2.2. Online Retail Stores
- 10.1. Market Analysis, Insights and Forecast - by Product Type
- 11. Middle East and Africa Hockey Market Analysis, Insights and Forecast, 2020-2032
- 11.1. Market Analysis, Insights and Forecast - by Product Type
- 11.1.1. Hockey Sticks and Balls
- 11.1.2. Field Hockey Shoes
- 11.1.3. Protective Gear and Accessories
- 11.1.3.1. Pads
- 11.1.3.2. Helmets
- 11.1.3.3. Other Protective Gears and Accessories
- 11.2. Market Analysis, Insights and Forecast - by Distribution Channel
- 11.2.1. Offline Retail Stores
- 11.2.2. Online Retail Stores
- 11.1. Market Analysis, Insights and Forecast - by Product Type
- 12. Competitive Analysis
- 12.1. Company Profiles
- 12.1.1 Ritual Hockey
- 12.1.1.1. Company Overview
- 12.1.1.2. Products
- 12.1.1.3. Company Financials
- 12.1.1.4. SWOT Analysis
- 12.1.2 Adidas AG
- 12.1.2.1. Company Overview
- 12.1.2.2. Products
- 12.1.2.3. Company Financials
- 12.1.2.4. SWOT Analysis
- 12.1.3 Brabo Hockey
- 12.1.3.1. Company Overview
- 12.1.3.2. Products
- 12.1.3.3. Company Financials
- 12.1.3.4. SWOT Analysis
- 12.1.4 Atlas Hockey
- 12.1.4.1. Company Overview
- 12.1.4.2. Products
- 12.1.4.3. Company Financials
- 12.1.4.4. SWOT Analysis
- 12.1.5 Mazon Hockey
- 12.1.5.1. Company Overview
- 12.1.5.2. Products
- 12.1.5.3. Company Financials
- 12.1.5.4. SWOT Analysis
- 12.1.6 Dita Hockey
- 12.1.6.1. Company Overview
- 12.1.6.2. Products
- 12.1.6.3. Company Financials
- 12.1.6.4. SWOT Analysis
- 12.1.7 Grays of Cambridge (International) Ltd
- 12.1.7.1. Company Overview
- 12.1.7.2. Products
- 12.1.7.3. Company Financials
- 12.1.7.4. SWOT Analysis
- 12.1.8 Osaka World
- 12.1.8.1. Company Overview
- 12.1.8.2. Products
- 12.1.8.3. Company Financials
- 12.1.8.4. SWOT Analysis
- 12.1.9 Gryphon Hockey Ltd
- 12.1.9.1. Company Overview
- 12.1.9.2. Products
- 12.1.9.3. Company Financials
- 12.1.9.4. SWOT Analysis
- 12.1.10 STX*List Not Exhaustive
- 12.1.10.1. Company Overview
- 12.1.10.2. Products
- 12.1.10.3. Company Financials
- 12.1.10.4. SWOT Analysis
- 12.1.11 OBO
- 12.1.11.1. Company Overview
- 12.1.11.2. Products
- 12.1.11.3. Company Financials
- 12.1.11.4. SWOT Analysis
- 12.1.12 Princess Sportsgear
- 12.1.12.1. Company Overview
- 12.1.12.2. Products
- 12.1.12.3. Company Financials
- 12.1.12.4. SWOT Analysis
- 12.1.1 Ritual Hockey
- 12.2. Market Entropy
- 12.2.1 Company's Key Areas Served
- 12.2.2 Recent Developments
- 12.3. Company Market Share Analysis 2025
- 12.3.1 Top 5 Companies Market Share Analysis
- 12.3.2 Top 3 Companies Market Share Analysis
- 12.4. List of Potential Customers
- 13. Research Methodology
List of Figures
- Figure 1: Global Hockey Market Revenue Breakdown (billion, %) by Region 2025 & 2033
- Figure 2: North America Hockey Market Revenue (billion), by Product Type 2025 & 2033
- Figure 3: North America Hockey Market Revenue Share (%), by Product Type 2025 & 2033
- Figure 4: North America Hockey Market Revenue (billion), by Distribution Channel 2025 & 2033
- Figure 5: North America Hockey Market Revenue Share (%), by Distribution Channel 2025 & 2033
- Figure 6: North America Hockey Market Revenue (billion), by Country 2025 & 2033
- Figure 7: North America Hockey Market Revenue Share (%), by Country 2025 & 2033
- Figure 8: Europe Hockey Market Revenue (billion), by Product Type 2025 & 2033
- Figure 9: Europe Hockey Market Revenue Share (%), by Product Type 2025 & 2033
- Figure 10: Europe Hockey Market Revenue (billion), by Distribution Channel 2025 & 2033
- Figure 11: Europe Hockey Market Revenue Share (%), by Distribution Channel 2025 & 2033
- Figure 12: Europe Hockey Market Revenue (billion), by Country 2025 & 2033
- Figure 13: Europe Hockey Market Revenue Share (%), by Country 2025 & 2033
- Figure 14: Asia Pacific Hockey Market Revenue (billion), by Product Type 2025 & 2033
- Figure 15: Asia Pacific Hockey Market Revenue Share (%), by Product Type 2025 & 2033
- Figure 16: Asia Pacific Hockey Market Revenue (billion), by Distribution Channel 2025 & 2033
- Figure 17: Asia Pacific Hockey Market Revenue Share (%), by Distribution Channel 2025 & 2033
- Figure 18: Asia Pacific Hockey Market Revenue (billion), by Country 2025 & 2033
- Figure 19: Asia Pacific Hockey Market Revenue Share (%), by Country 2025 & 2033
- Figure 20: South America Hockey Market Revenue (billion), by Product Type 2025 & 2033
- Figure 21: South America Hockey Market Revenue Share (%), by Product Type 2025 & 2033
- Figure 22: South America Hockey Market Revenue (billion), by Distribution Channel 2025 & 2033
- Figure 23: South America Hockey Market Revenue Share (%), by Distribution Channel 2025 & 2033
- Figure 24: South America Hockey Market Revenue (billion), by Country 2025 & 2033
- Figure 25: South America Hockey Market Revenue Share (%), by Country 2025 & 2033
- Figure 26: Middle East and Africa Hockey Market Revenue (billion), by Product Type 2025 & 2033
- Figure 27: Middle East and Africa Hockey Market Revenue Share (%), by Product Type 2025 & 2033
- Figure 28: Middle East and Africa Hockey Market Revenue (billion), by Distribution Channel 2025 & 2033
- Figure 29: Middle East and Africa Hockey Market Revenue Share (%), by Distribution Channel 2025 & 2033
- Figure 30: Middle East and Africa Hockey Market Revenue (billion), by Country 2025 & 2033
- Figure 31: Middle East and Africa Hockey Market Revenue Share (%), by Country 2025 & 2033
List of Tables
- Table 1: Global Hockey Market Revenue billion Forecast, by Product Type 2020 & 2033
- Table 2: Global Hockey Market Revenue billion Forecast, by Distribution Channel 2020 & 2033
- Table 3: Global Hockey Market Revenue billion Forecast, by Region 2020 & 2033
- Table 4: Global Hockey Market Revenue billion Forecast, by Product Type 2020 & 2033
- Table 5: Global Hockey Market Revenue billion Forecast, by Distribution Channel 2020 & 2033
- Table 6: Global Hockey Market Revenue billion Forecast, by Country 2020 & 2033
- Table 7: United States Hockey Market Revenue (billion) Forecast, by Application 2020 & 2033
- Table 8: Canada Hockey Market Revenue (billion) Forecast, by Application 2020 & 2033
- Table 9: Mexico Hockey Market Revenue (billion) Forecast, by Application 2020 & 2033
- Table 10: Rest of North America Hockey Market Revenue (billion) Forecast, by Application 2020 & 2033
- Table 11: Global Hockey Market Revenue billion Forecast, by Product Type 2020 & 2033
- Table 12: Global Hockey Market Revenue billion Forecast, by Distribution Channel 2020 & 2033
- Table 13: Global Hockey Market Revenue billion Forecast, by Country 2020 & 2033
- Table 14: Spain Hockey Market Revenue (billion) Forecast, by Application 2020 & 2033
- Table 15: United Kingdom Hockey Market Revenue (billion) Forecast, by Application 2020 & 2033
- Table 16: Germany Hockey Market Revenue (billion) Forecast, by Application 2020 & 2033
- Table 17: France Hockey Market Revenue (billion) Forecast, by Application 2020 & 2033
- Table 18: Italy Hockey Market Revenue (billion) Forecast, by Application 2020 & 2033
- Table 19: Russia Hockey Market Revenue (billion) Forecast, by Application 2020 & 2033
- Table 20: Rest of Europe Hockey Market Revenue (billion) Forecast, by Application 2020 & 2033
- Table 21: Global Hockey Market Revenue billion Forecast, by Product Type 2020 & 2033
- Table 22: Global Hockey Market Revenue billion Forecast, by Distribution Channel 2020 & 2033
- Table 23: Global Hockey Market Revenue billion Forecast, by Country 2020 & 2033
- Table 24: China Hockey Market Revenue (billion) Forecast, by Application 2020 & 2033
- Table 25: Japan Hockey Market Revenue (billion) Forecast, by Application 2020 & 2033
- Table 26: India Hockey Market Revenue (billion) Forecast, by Application 2020 & 2033
- Table 27: Australia Hockey Market Revenue (billion) Forecast, by Application 2020 & 2033
- Table 28: Rest of Asia Pacific Hockey Market Revenue (billion) Forecast, by Application 2020 & 2033
- Table 29: Global Hockey Market Revenue billion Forecast, by Product Type 2020 & 2033
- Table 30: Global Hockey Market Revenue billion Forecast, by Distribution Channel 2020 & 2033
- Table 31: Global Hockey Market Revenue billion Forecast, by Country 2020 & 2033
- Table 32: Brazil Hockey Market Revenue (billion) Forecast, by Application 2020 & 2033
- Table 33: Argentina Hockey Market Revenue (billion) Forecast, by Application 2020 & 2033
- Table 34: Rest of South America Hockey Market Revenue (billion) Forecast, by Application 2020 & 2033
- Table 35: Global Hockey Market Revenue billion Forecast, by Product Type 2020 & 2033
- Table 36: Global Hockey Market Revenue billion Forecast, by Distribution Channel 2020 & 2033
- Table 37: Global Hockey Market Revenue billion Forecast, by Country 2020 & 2033
- Table 38: South Africa Hockey Market Revenue (billion) Forecast, by Application 2020 & 2033
- Table 39: United Arab Emirates Hockey Market Revenue (billion) Forecast, by Application 2020 & 2033
- Table 40: Rest of Middle East and Africa Hockey Market Revenue (billion) Forecast, by Application 2020 & 2033
Frequently Asked Questions
1. What is the projected Compound Annual Growth Rate (CAGR) of the Hockey Market?
The projected CAGR is approximately 7.5%.
2. Which companies are prominent players in the Hockey Market?
Key companies in the market include Ritual Hockey, Adidas AG, Brabo Hockey, Atlas Hockey, Mazon Hockey, Dita Hockey, Grays of Cambridge (International) Ltd, Osaka World, Gryphon Hockey Ltd, STX*List Not Exhaustive, OBO, Princess Sportsgear.
3. What are the main segments of the Hockey Market?
The market segments include Product Type, Distribution Channel.
4. Can you provide details about the market size?
The market size is estimated to be USD 9.5 billion as of 2022.
5. What are some drivers contributing to market growth?
Increase in Sports Participation; Trend of Athleisure.
6. What are the notable trends driving market growth?
Rising Interest and Participation Rate in Field Hockey.
7. Are there any restraints impacting market growth?
Availability of Fake and Counterfeit Products.
8. Can you provide examples of recent developments in the market?
June 2021: USA Field Hockey officially launched the USA Field Hockey Equipment store, an online store that provides entry-level and modified equipment packages to make field hockey more accessible and affordable.
9. What pricing options are available for accessing the report?
Pricing options include single-user, multi-user, and enterprise licenses priced at USD 4750, USD 5250, and USD 8750 respectively.
10. Is the market size provided in terms of value or volume?
The market size is provided in terms of value, measured in billion.
11. Are there any specific market keywords associated with the report?
Yes, the market keyword associated with the report is "Hockey Market," which aids in identifying and referencing the specific market segment covered.
12. How do I determine which pricing option suits my needs best?
The pricing options vary based on user requirements and access needs. Individual users may opt for single-user licenses, while businesses requiring broader access may choose multi-user or enterprise licenses for cost-effective access to the report.
13. Are there any additional resources or data provided in the Hockey Market report?
While the report offers comprehensive insights, it's advisable to review the specific contents or supplementary materials provided to ascertain if additional resources or data are available.
14. How can I stay updated on further developments or reports in the Hockey Market?
To stay informed about further developments, trends, and reports in the Hockey Market, consider subscribing to industry newsletters, following relevant companies and organizations, or regularly checking reputable industry news sources and publications.
Methodology
Step 1 - Identification of Relevant Samples Size from Population Database


Step 2 - Approaches for Defining Global Market Size (Value, Volume* & Price*)

Note*: In applicable scenarios
Step 3 - Data Sources
Primary Research
- Web Analytics
- Survey Reports
- Research Institute
- Latest Research Reports
- Opinion Leaders
Secondary Research
- Annual Reports
- White Paper
- Latest Press Release
- Industry Association
- Paid Database
- Investor Presentations

Step 4 - Data Triangulation
Involves using different sources of information in order to increase the validity of a study
These sources are likely to be stakeholders in a program - participants, other researchers, program staff, other community members, and so on.
Then we put all data in single framework & apply various statistical tools to find out the dynamic on the market.
During the analysis stage, feedback from the stakeholder groups would be compared to determine areas of agreement as well as areas of divergence