

Key Insights
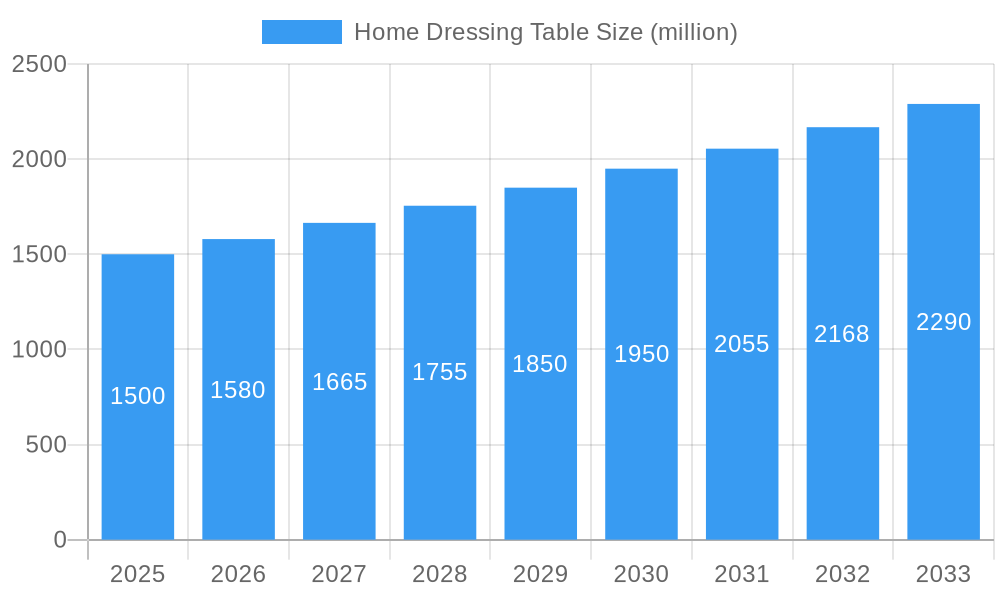
The global home dressing table market is experiencing robust growth, estimated to reach approximately $1,500 million by 2025, with a projected Compound Annual Growth Rate (CAGR) of 5.5% through 2033. This expansion is primarily fueled by increasing disposable incomes, a growing emphasis on home décor and personal grooming, and the rising popularity of smart and multi-functional furniture. The demand for contemporary and classic styles is particularly strong, catering to diverse aesthetic preferences in residential spaces. Furthermore, the integration of smart features, such as integrated lighting and digital displays, is emerging as a significant trend, appealing to younger, tech-savvy consumers. Online retail channels are playing an increasingly crucial role in market penetration, offering wider accessibility and convenience to a global customer base.
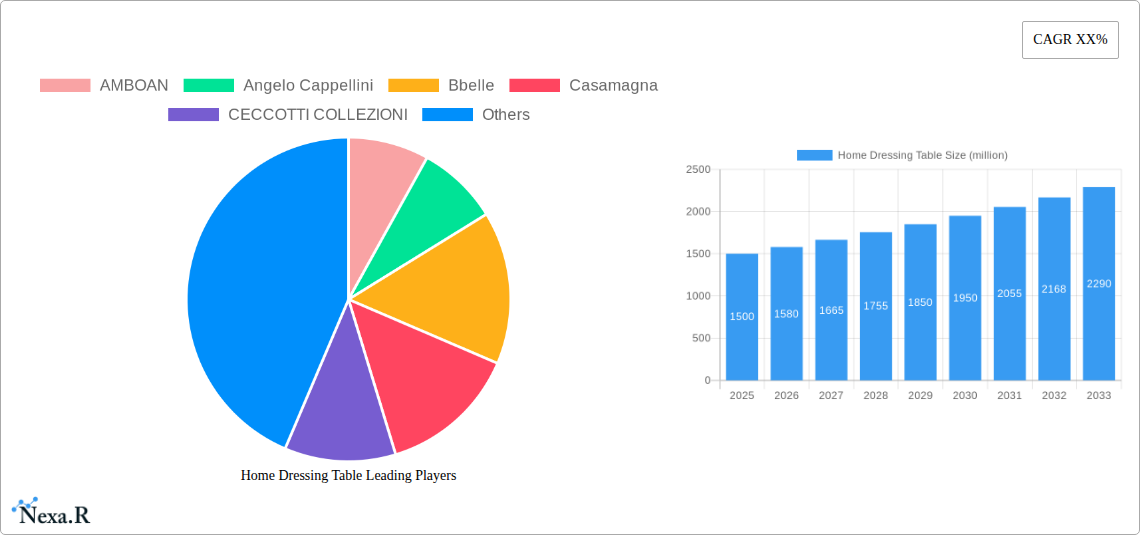
Home Dressing Table Market Size (In Billion)
However, the market also faces certain restraints, including fluctuating raw material prices, which can impact manufacturing costs and, consequently, retail prices. The proliferation of counterfeit products in some regions also poses a challenge to established brands and market integrity. Despite these hurdles, the market is poised for continued advancement, driven by innovation in design, materials, and functionality. Key market players are focusing on sustainable practices and customization options to capture a larger market share. Geographically, North America and Europe are expected to remain dominant markets due to high living standards and established interior design cultures, while the Asia Pacific region presents substantial growth potential owing to its rapidly expanding middle class and increasing urbanization.
Home Dressing Table Company Market Share
Home Dressing Table Market Report: Dynamics, Trends, and Future Outlook (2019–2033)
This comprehensive report delves into the global Home Dressing Table market, providing an in-depth analysis of its structure, growth trajectories, regional dominance, product innovations, and key influencing factors. With a study period spanning from 2019 to 2033, the report offers critical insights for industry professionals, manufacturers, and investors, focusing on market concentration, technological drivers, regulatory landscapes, and competitive dynamics. We dissect the market into parent and child segments, covering applications from Home to Commercial and types including Contemporary, Classic, and Traditional dressing tables, with a base year of 2025 and a forecast period from 2025–2033.
Home Dressing Table Market Dynamics & Structure
The Home Dressing Table market exhibits a moderately fragmented structure, characterized by the presence of both established luxury furniture manufacturers and emerging players specializing in niche designs. Technological innovation plays a crucial role, driven by advancements in material science, smart furniture integration (e.g., integrated lighting and connectivity), and sustainable manufacturing processes. Regulatory frameworks primarily revolve around product safety standards, material sourcing certifications, and import/export regulations, which can vary significantly across different regions. Competitive product substitutes include multi-functional vanity units, integrated wardrobe solutions, and even repurposed furniture items. End-user demographics are diverse, ranging from young adults seeking stylish additions to their living spaces to established homeowners prioritizing functionality and luxury. Mergers and acquisitions (M&A) trends, while not as pronounced as in some other furniture segments, are observed as larger players seek to expand their product portfolios and geographical reach. For instance, a notable M&A deal in 2022 saw a premium contemporary furniture brand acquire a specialist in classic dressing table designs, consolidating market share in both segments. Innovation barriers often stem from high tooling costs for intricate designs and the challenges of scaling artisanal production while maintaining exclusivity.
- Market Concentration: Moderately fragmented with a mix of global and regional players.
- Technological Innovation Drivers: Smart features, sustainable materials, ergonomic design.
- Regulatory Frameworks: Product safety, material compliance, international trade laws.
- Competitive Product Substitutes: Multi-functional vanities, integrated storage, repurposed furniture.
- End-User Demographics: Millennials, Gen Z, affluent homeowners, interior designers.
- M&A Trends: Strategic acquisitions to broaden product offerings and market access.
- Innovation Barriers: High production costs for custom designs, scalability challenges.
Home Dressing Table Growth Trends & Insights
The global Home Dressing Table market is projected for robust growth, driven by increasing disposable incomes, evolving lifestyle preferences, and a growing emphasis on home décor and personal grooming. The market size is expected to expand at a Compound Annual Growth Rate (CAGR) of approximately 5.8% during the forecast period. Adoption rates for dressing tables are steadily rising, particularly in developing economies where urbanization and a rising middle class are fueling demand for specialized furniture. Technological disruptions, such as the integration of smart mirrors with adjustable lighting and digital displays, are creating new product categories and enhancing user experience. Consumer behavior shifts are evident, with a greater appreciation for personalized and aesthetically pleasing spaces. The rise of e-commerce platforms has also democratized access to a wider range of dressing table designs, from budget-friendly options to high-end luxury pieces, thereby impacting market penetration rates across different consumer segments. The historical period from 2019 to 2024 saw steady, albeit slower, growth influenced by global economic conditions and shifting interior design trends. The base year of 2025 marks a significant inflection point, with anticipated accelerated growth fueled by post-pandemic home improvement initiatives and a resurgence in discretionary spending.
- Market Size Evolution: Projected to reach over $7.5 billion by 2033.
- CAGR: Estimated at 5.8% from 2025–2033.
- Adoption Rates: Increasing, especially in emerging markets.
- Technological Disruptions: Smart mirrors, integrated lighting, sustainable materials.
- Consumer Behavior Shifts: Demand for personalized, aesthetically pleasing, and functional furniture.
- Market Penetration: Widening due to e-commerce accessibility and diverse product offerings.
- Historical Growth (2019-2024): Steady growth, influenced by economic factors.
- Base Year Impact (2025): Anticipated acceleration driven by home improvement trends.
Dominant Regions, Countries, or Segments in Home Dressing Table
North America and Europe currently represent the dominant regions in the Home Dressing Table market, driven by established economies, high disposable incomes, and a strong consumer appreciation for interior design and luxury furnishings. Within these regions, countries like the United States, Germany, France, and the United Kingdom lead in terms of market share and consumption of premium dressing tables. The Home application segment overwhelmingly dominates the market, accounting for approximately 85% of the total market revenue. This is intrinsically linked to the growing trend of creating dedicated personal spaces within residential properties. Among the types, the Contemporary segment is experiencing the fastest growth, appealing to a younger demographic and those seeking modern, minimalist aesthetics. However, the Classic and Traditional segments retain significant market share, particularly in established luxury markets and among older demographics who value timeless elegance and craftsmanship. Economic policies that support homeownership and interior design spending, coupled with robust retail infrastructure, contribute to the dominance of these regions. The increasing influence of interior design influencers and home renovation shows further amplifies demand. Growth potential in Asia-Pacific, particularly in China and India, is substantial due to rapid urbanization, a burgeoning middle class, and increasing awareness of global design trends.
- Dominant Regions: North America, Europe.
- Leading Countries: USA, Germany, France, UK.
- Dominant Application Segment: Home (approx. 85% market share).
- Fastest Growing Type Segment: Contemporary.
- Significant Market Share Segments: Classic, Traditional.
- Key Drivers in Dominant Regions: High disposable income, appreciation for interior design, established retail infrastructure.
- Emerging Growth Regions: Asia-Pacific (China, India).
- Growth Potential Factors: Urbanization, rising middle class, global design awareness.
Home Dressing Table Product Landscape
The product landscape of Home Dressing Tables is characterized by a blend of traditional craftsmanship and modern innovation. Manufacturers are increasingly focusing on premium materials such as solid woods, marble, and high-quality veneers, coupled with sophisticated finishes. Product innovations include integrated LED lighting systems, touch-sensitive controls, built-in charging ports for electronic devices, and smart storage solutions that optimize space utilization. The application extends beyond mere functionality to becoming a statement piece within a bedroom or dressing area. Performance metrics are evaluated based on durability, ergonomic design, aesthetic appeal, and the seamless integration of technology. Unique selling propositions often lie in artisanal detailing, customizable options, and the incorporation of sustainable sourcing and manufacturing practices. For example, Gallotti&Radice is known for its contemporary designs featuring glass and metal, while CECCOTTI COLLEZIONI excels in classic, opulent designs.
Key Drivers, Barriers & Challenges in Home Dressing Table
Key Drivers:
- Rising Disposable Incomes: Increased consumer spending capacity on home furnishings and luxury items.
- Growing Emphasis on Home Aesthetics: The trend of creating aesthetically pleasing and personalized living spaces.
- Technological Integration: Demand for smart features like integrated lighting and connectivity.
- Evolving Lifestyle Preferences: Desire for dedicated personal grooming spaces and self-care rituals.
- E-commerce Proliferation: Wider accessibility to diverse designs and brands globally.
Barriers & Challenges:
- High Production Costs: Especially for intricate designs and premium materials, impacting affordability for some consumer segments.
- Supply Chain Disruptions: Volatility in raw material availability and logistics can affect production timelines and costs.
- Intense Competition: A crowded market with both established luxury brands and agile online retailers.
- Economic Slowdowns: Global economic uncertainties can reduce discretionary spending on non-essential items like premium furniture.
- Sustainability Pressures: Increasing consumer demand for eco-friendly materials and manufacturing processes, requiring significant investment.
Emerging Opportunities in Home Dressing Table
Emerging opportunities in the Home Dressing Table market lie in the development of highly customizable and modular dressing table solutions that cater to increasingly diverse spatial requirements and personal styles. The integration of advanced smart home technologies, such as voice-activated lighting and personalized digital mirrors with skincare analysis features, presents a significant untapped market. Furthermore, the expansion of direct-to-consumer (DTC) models and the creation of online configurators that allow customers to design their own dressing tables offer immense potential. Focus on sustainable and ethically sourced materials will also drive growth as environmentally conscious consumers become more influential. The commercial application segment, particularly within luxury hotels and high-end salons, is also an area ripe for innovation and tailored product offerings.
Growth Accelerators in the Home Dressing Table Industry
Several catalysts are driving long-term growth in the Home Dressing Table industry. Technological breakthroughs in smart furniture, including the miniaturization of components and energy-efficient lighting, are enabling more sophisticated and appealing product designs. Strategic partnerships between furniture manufacturers and technology companies are fostering innovation and creating unique value propositions. Market expansion strategies, such as targeting emerging economies with growing middle classes and investing in online sales channels, are crucial for sustained growth. The increasing demand for bespoke and artisanal furniture, driven by a desire for uniqueness and quality, also acts as a significant growth accelerator.
Key Players Shaping the Home Dressing Table Market
- AMBOAN
- Angelo Cappellini
- Bbelle
- Casamagna
- CECCOTTI COLLEZIONI
- COLOMBO STILE
- Corte Zari
- DANIELA LUCATO complementi d'arredo
- Francesco Pasi
- GALIMBERTI NINO
- Gallotti&Radice
- GC di Colombo Giancarlo
- Giorgio Armani Casa
- Heavens
- Jetclass
- LouisXV
- Mantellassi 1926
- Modenese Interiors Luxury Furniture
- Oppein
- Porada
- Presotto
- SALDA ARREDAMENTI
- Soher
- SPINI
- Villa Nova Italia
- VIMERCATI MEDA LUXURY CLASSIC FURNITURE
- William Yeoward
- Ziinlife
Notable Milestones in Home Dressing Table Sector
- 2019: Increased adoption of smart lighting and integrated charging ports in high-end dressing tables.
- 2020: Surge in online sales and customization options due to the global pandemic, driving innovation in virtual showrooms.
- 2021: Growing consumer demand for sustainable materials and eco-friendly manufacturing processes.
- 2022: Introduction of modular dressing table designs to accommodate smaller living spaces.
- 2023: Advancements in mirror technology, including anti-fogging and integrated displays for beauty tutorials.
- 2024: Expansion of the commercial segment with customized dressing tables for boutique hotels and spas.
In-Depth Home Dressing Table Market Outlook
The future outlook for the Home Dressing Table market is exceptionally positive, driven by sustained economic recovery, evolving consumer lifestyles, and continuous innovation. Growth accelerators like technological advancements in smart furniture and the increasing importance of personalized home spaces will continue to fuel market expansion. Strategic market expansion into emerging economies, coupled with a stronger online presence and DTC strategies, will unlock new revenue streams. The ongoing trend of investing in home comfort and self-care rituals ensures a consistent demand for aesthetically pleasing and functional dressing tables. Opportunities for product differentiation through unique designs, premium materials, and eco-conscious manufacturing will define market leaders. The synergy between luxury furniture brands and technology innovators will shape the next generation of dressing tables, creating a dynamic and growth-oriented market.
Home Dressing Table Segmentation
-
1. Application
- 1.1. Home
- 1.2. Commercial
-
2. Types
- 2.1. Contemporary
- 2.2. Classic
- 2.3. Traditional
Home Dressing Table Segmentation By Geography
-
1. North America
- 1.1. United States
- 1.2. Canada
- 1.3. Mexico
-
2. South America
- 2.1. Brazil
- 2.2. Argentina
- 2.3. Rest of South America
-
3. Europe
- 3.1. United Kingdom
- 3.2. Germany
- 3.3. France
- 3.4. Italy
- 3.5. Spain
- 3.6. Russia
- 3.7. Benelux
- 3.8. Nordics
- 3.9. Rest of Europe
-
4. Middle East & Africa
- 4.1. Turkey
- 4.2. Israel
- 4.3. GCC
- 4.4. North Africa
- 4.5. South Africa
- 4.6. Rest of Middle East & Africa
-
5. Asia Pacific
- 5.1. China
- 5.2. India
- 5.3. Japan
- 5.4. South Korea
- 5.5. ASEAN
- 5.6. Oceania
- 5.7. Rest of Asia Pacific
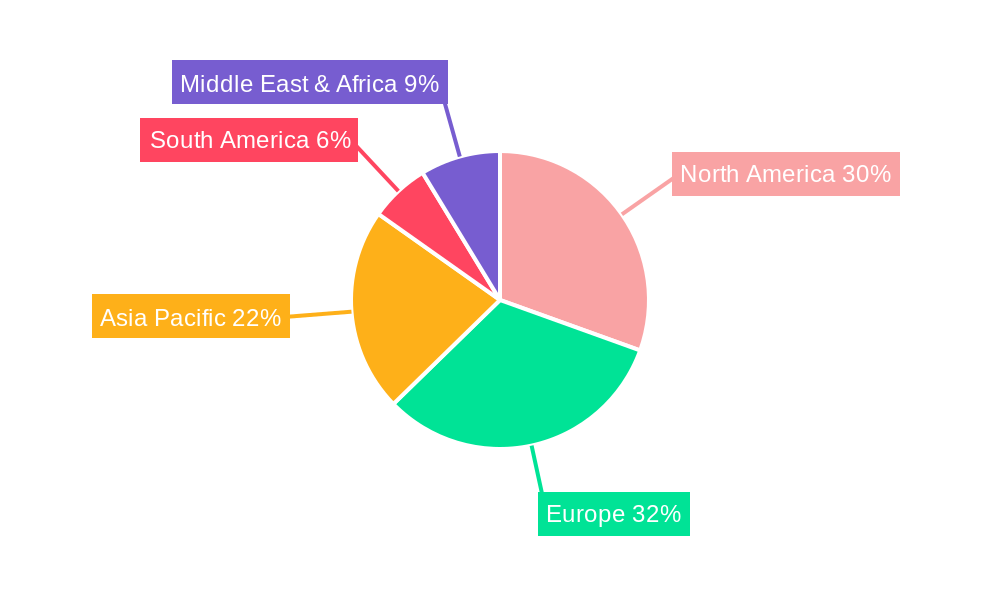
Home Dressing Table Regional Market Share
Geographic Coverage of Home Dressing Table
Home Dressing Table REPORT HIGHLIGHTS
| Aspects | Details |
|---|---|
| Study Period | 2020-2034 |
| Base Year | 2025 |
| Estimated Year | 2026 |
| Forecast Period | 2026-2034 |
| Historical Period | 2020-2025 |
| Growth Rate | CAGR of XX% from 2020-2034 |
| Segmentation |
|
Table of Contents
- 1. Introduction
- 1.1. Research Scope
- 1.2. Market Segmentation
- 1.3. Research Methodology
- 1.4. Definitions and Assumptions
- 2. Executive Summary
- 2.1. Introduction
- 3. Market Dynamics
- 3.1. Introduction
- 3.2. Market Drivers
- 3.3. Market Restrains
- 3.4. Market Trends
- 4. Market Factor Analysis
- 4.1. Porters Five Forces
- 4.2. Supply/Value Chain
- 4.3. PESTEL analysis
- 4.4. Market Entropy
- 4.5. Patent/Trademark Analysis
- 5. Global Home Dressing Table Analysis, Insights and Forecast, 2020-2032
- 5.1. Market Analysis, Insights and Forecast - by Application
- 5.1.1. Home
- 5.1.2. Commercial
- 5.2. Market Analysis, Insights and Forecast - by Types
- 5.2.1. Contemporary
- 5.2.2. Classic
- 5.2.3. Traditional
- 5.3. Market Analysis, Insights and Forecast - by Region
- 5.3.1. North America
- 5.3.2. South America
- 5.3.3. Europe
- 5.3.4. Middle East & Africa
- 5.3.5. Asia Pacific
- 5.1. Market Analysis, Insights and Forecast - by Application
- 6. North America Home Dressing Table Analysis, Insights and Forecast, 2020-2032
- 6.1. Market Analysis, Insights and Forecast - by Application
- 6.1.1. Home
- 6.1.2. Commercial
- 6.2. Market Analysis, Insights and Forecast - by Types
- 6.2.1. Contemporary
- 6.2.2. Classic
- 6.2.3. Traditional
- 6.1. Market Analysis, Insights and Forecast - by Application
- 7. South America Home Dressing Table Analysis, Insights and Forecast, 2020-2032
- 7.1. Market Analysis, Insights and Forecast - by Application
- 7.1.1. Home
- 7.1.2. Commercial
- 7.2. Market Analysis, Insights and Forecast - by Types
- 7.2.1. Contemporary
- 7.2.2. Classic
- 7.2.3. Traditional
- 7.1. Market Analysis, Insights and Forecast - by Application
- 8. Europe Home Dressing Table Analysis, Insights and Forecast, 2020-2032
- 8.1. Market Analysis, Insights and Forecast - by Application
- 8.1.1. Home
- 8.1.2. Commercial
- 8.2. Market Analysis, Insights and Forecast - by Types
- 8.2.1. Contemporary
- 8.2.2. Classic
- 8.2.3. Traditional
- 8.1. Market Analysis, Insights and Forecast - by Application
- 9. Middle East & Africa Home Dressing Table Analysis, Insights and Forecast, 2020-2032
- 9.1. Market Analysis, Insights and Forecast - by Application
- 9.1.1. Home
- 9.1.2. Commercial
- 9.2. Market Analysis, Insights and Forecast - by Types
- 9.2.1. Contemporary
- 9.2.2. Classic
- 9.2.3. Traditional
- 9.1. Market Analysis, Insights and Forecast - by Application
- 10. Asia Pacific Home Dressing Table Analysis, Insights and Forecast, 2020-2032
- 10.1. Market Analysis, Insights and Forecast - by Application
- 10.1.1. Home
- 10.1.2. Commercial
- 10.2. Market Analysis, Insights and Forecast - by Types
- 10.2.1. Contemporary
- 10.2.2. Classic
- 10.2.3. Traditional
- 10.1. Market Analysis, Insights and Forecast - by Application
- 11. Competitive Analysis
- 11.1. Global Market Share Analysis 2025
- 11.2. Company Profiles
- 11.2.1 AMBOAN
- 11.2.1.1. Overview
- 11.2.1.2. Products
- 11.2.1.3. SWOT Analysis
- 11.2.1.4. Recent Developments
- 11.2.1.5. Financials (Based on Availability)
- 11.2.2 Angelo Cappellini
- 11.2.2.1. Overview
- 11.2.2.2. Products
- 11.2.2.3. SWOT Analysis
- 11.2.2.4. Recent Developments
- 11.2.2.5. Financials (Based on Availability)
- 11.2.3 Bbelle
- 11.2.3.1. Overview
- 11.2.3.2. Products
- 11.2.3.3. SWOT Analysis
- 11.2.3.4. Recent Developments
- 11.2.3.5. Financials (Based on Availability)
- 11.2.4 Casamagna
- 11.2.4.1. Overview
- 11.2.4.2. Products
- 11.2.4.3. SWOT Analysis
- 11.2.4.4. Recent Developments
- 11.2.4.5. Financials (Based on Availability)
- 11.2.5 CECCOTTI COLLEZIONI
- 11.2.5.1. Overview
- 11.2.5.2. Products
- 11.2.5.3. SWOT Analysis
- 11.2.5.4. Recent Developments
- 11.2.5.5. Financials (Based on Availability)
- 11.2.6 COLOMBO STILE
- 11.2.6.1. Overview
- 11.2.6.2. Products
- 11.2.6.3. SWOT Analysis
- 11.2.6.4. Recent Developments
- 11.2.6.5. Financials (Based on Availability)
- 11.2.7 Corte Zari
- 11.2.7.1. Overview
- 11.2.7.2. Products
- 11.2.7.3. SWOT Analysis
- 11.2.7.4. Recent Developments
- 11.2.7.5. Financials (Based on Availability)
- 11.2.8 DANIELA LUCATO complementi d'arredo
- 11.2.8.1. Overview
- 11.2.8.2. Products
- 11.2.8.3. SWOT Analysis
- 11.2.8.4. Recent Developments
- 11.2.8.5. Financials (Based on Availability)
- 11.2.9 Francesco Pasi
- 11.2.9.1. Overview
- 11.2.9.2. Products
- 11.2.9.3. SWOT Analysis
- 11.2.9.4. Recent Developments
- 11.2.9.5. Financials (Based on Availability)
- 11.2.10 GALIMBERTI NINO
- 11.2.10.1. Overview
- 11.2.10.2. Products
- 11.2.10.3. SWOT Analysis
- 11.2.10.4. Recent Developments
- 11.2.10.5. Financials (Based on Availability)
- 11.2.11 Gallotti&Radice
- 11.2.11.1. Overview
- 11.2.11.2. Products
- 11.2.11.3. SWOT Analysis
- 11.2.11.4. Recent Developments
- 11.2.11.5. Financials (Based on Availability)
- 11.2.12 GC di Colombo Giancarlo
- 11.2.12.1. Overview
- 11.2.12.2. Products
- 11.2.12.3. SWOT Analysis
- 11.2.12.4. Recent Developments
- 11.2.12.5. Financials (Based on Availability)
- 11.2.13 Giorgio Armani Casa
- 11.2.13.1. Overview
- 11.2.13.2. Products
- 11.2.13.3. SWOT Analysis
- 11.2.13.4. Recent Developments
- 11.2.13.5. Financials (Based on Availability)
- 11.2.14 Heavens
- 11.2.14.1. Overview
- 11.2.14.2. Products
- 11.2.14.3. SWOT Analysis
- 11.2.14.4. Recent Developments
- 11.2.14.5. Financials (Based on Availability)
- 11.2.15 Jetclass
- 11.2.15.1. Overview
- 11.2.15.2. Products
- 11.2.15.3. SWOT Analysis
- 11.2.15.4. Recent Developments
- 11.2.15.5. Financials (Based on Availability)
- 11.2.16 LouisXV
- 11.2.16.1. Overview
- 11.2.16.2. Products
- 11.2.16.3. SWOT Analysis
- 11.2.16.4. Recent Developments
- 11.2.16.5. Financials (Based on Availability)
- 11.2.17 Mantellassi 1926
- 11.2.17.1. Overview
- 11.2.17.2. Products
- 11.2.17.3. SWOT Analysis
- 11.2.17.4. Recent Developments
- 11.2.17.5. Financials (Based on Availability)
- 11.2.18 Modenese Interiors Luxury Furniture
- 11.2.18.1. Overview
- 11.2.18.2. Products
- 11.2.18.3. SWOT Analysis
- 11.2.18.4. Recent Developments
- 11.2.18.5. Financials (Based on Availability)
- 11.2.19 Oppein
- 11.2.19.1. Overview
- 11.2.19.2. Products
- 11.2.19.3. SWOT Analysis
- 11.2.19.4. Recent Developments
- 11.2.19.5. Financials (Based on Availability)
- 11.2.20 Porada
- 11.2.20.1. Overview
- 11.2.20.2. Products
- 11.2.20.3. SWOT Analysis
- 11.2.20.4. Recent Developments
- 11.2.20.5. Financials (Based on Availability)
- 11.2.21 Presotto
- 11.2.21.1. Overview
- 11.2.21.2. Products
- 11.2.21.3. SWOT Analysis
- 11.2.21.4. Recent Developments
- 11.2.21.5. Financials (Based on Availability)
- 11.2.22 SALDA ARREDAMENTI
- 11.2.22.1. Overview
- 11.2.22.2. Products
- 11.2.22.3. SWOT Analysis
- 11.2.22.4. Recent Developments
- 11.2.22.5. Financials (Based on Availability)
- 11.2.23 Soher
- 11.2.23.1. Overview
- 11.2.23.2. Products
- 11.2.23.3. SWOT Analysis
- 11.2.23.4. Recent Developments
- 11.2.23.5. Financials (Based on Availability)
- 11.2.24 SPINI
- 11.2.24.1. Overview
- 11.2.24.2. Products
- 11.2.24.3. SWOT Analysis
- 11.2.24.4. Recent Developments
- 11.2.24.5. Financials (Based on Availability)
- 11.2.25 Villa Nova Italia
- 11.2.25.1. Overview
- 11.2.25.2. Products
- 11.2.25.3. SWOT Analysis
- 11.2.25.4. Recent Developments
- 11.2.25.5. Financials (Based on Availability)
- 11.2.26 VIMERCATI MEDA LUXURY CLASSIC FURNITURE
- 11.2.26.1. Overview
- 11.2.26.2. Products
- 11.2.26.3. SWOT Analysis
- 11.2.26.4. Recent Developments
- 11.2.26.5. Financials (Based on Availability)
- 11.2.27 William Yeoward
- 11.2.27.1. Overview
- 11.2.27.2. Products
- 11.2.27.3. SWOT Analysis
- 11.2.27.4. Recent Developments
- 11.2.27.5. Financials (Based on Availability)
- 11.2.28 Ziinlife
- 11.2.28.1. Overview
- 11.2.28.2. Products
- 11.2.28.3. SWOT Analysis
- 11.2.28.4. Recent Developments
- 11.2.28.5. Financials (Based on Availability)
- 11.2.1 AMBOAN
List of Figures
- Figure 1: Global Home Dressing Table Revenue Breakdown (million, %) by Region 2025 & 2033
- Figure 2: Global Home Dressing Table Volume Breakdown (K, %) by Region 2025 & 2033
- Figure 3: North America Home Dressing Table Revenue (million), by Application 2025 & 2033
- Figure 4: North America Home Dressing Table Volume (K), by Application 2025 & 2033
- Figure 5: North America Home Dressing Table Revenue Share (%), by Application 2025 & 2033
- Figure 6: North America Home Dressing Table Volume Share (%), by Application 2025 & 2033
- Figure 7: North America Home Dressing Table Revenue (million), by Types 2025 & 2033
- Figure 8: North America Home Dressing Table Volume (K), by Types 2025 & 2033
- Figure 9: North America Home Dressing Table Revenue Share (%), by Types 2025 & 2033
- Figure 10: North America Home Dressing Table Volume Share (%), by Types 2025 & 2033
- Figure 11: North America Home Dressing Table Revenue (million), by Country 2025 & 2033
- Figure 12: North America Home Dressing Table Volume (K), by Country 2025 & 2033
- Figure 13: North America Home Dressing Table Revenue Share (%), by Country 2025 & 2033
- Figure 14: North America Home Dressing Table Volume Share (%), by Country 2025 & 2033
- Figure 15: South America Home Dressing Table Revenue (million), by Application 2025 & 2033
- Figure 16: South America Home Dressing Table Volume (K), by Application 2025 & 2033
- Figure 17: South America Home Dressing Table Revenue Share (%), by Application 2025 & 2033
- Figure 18: South America Home Dressing Table Volume Share (%), by Application 2025 & 2033
- Figure 19: South America Home Dressing Table Revenue (million), by Types 2025 & 2033
- Figure 20: South America Home Dressing Table Volume (K), by Types 2025 & 2033
- Figure 21: South America Home Dressing Table Revenue Share (%), by Types 2025 & 2033
- Figure 22: South America Home Dressing Table Volume Share (%), by Types 2025 & 2033
- Figure 23: South America Home Dressing Table Revenue (million), by Country 2025 & 2033
- Figure 24: South America Home Dressing Table Volume (K), by Country 2025 & 2033
- Figure 25: South America Home Dressing Table Revenue Share (%), by Country 2025 & 2033
- Figure 26: South America Home Dressing Table Volume Share (%), by Country 2025 & 2033
- Figure 27: Europe Home Dressing Table Revenue (million), by Application 2025 & 2033
- Figure 28: Europe Home Dressing Table Volume (K), by Application 2025 & 2033
- Figure 29: Europe Home Dressing Table Revenue Share (%), by Application 2025 & 2033
- Figure 30: Europe Home Dressing Table Volume Share (%), by Application 2025 & 2033
- Figure 31: Europe Home Dressing Table Revenue (million), by Types 2025 & 2033
- Figure 32: Europe Home Dressing Table Volume (K), by Types 2025 & 2033
- Figure 33: Europe Home Dressing Table Revenue Share (%), by Types 2025 & 2033
- Figure 34: Europe Home Dressing Table Volume Share (%), by Types 2025 & 2033
- Figure 35: Europe Home Dressing Table Revenue (million), by Country 2025 & 2033
- Figure 36: Europe Home Dressing Table Volume (K), by Country 2025 & 2033
- Figure 37: Europe Home Dressing Table Revenue Share (%), by Country 2025 & 2033
- Figure 38: Europe Home Dressing Table Volume Share (%), by Country 2025 & 2033
- Figure 39: Middle East & Africa Home Dressing Table Revenue (million), by Application 2025 & 2033
- Figure 40: Middle East & Africa Home Dressing Table Volume (K), by Application 2025 & 2033
- Figure 41: Middle East & Africa Home Dressing Table Revenue Share (%), by Application 2025 & 2033
- Figure 42: Middle East & Africa Home Dressing Table Volume Share (%), by Application 2025 & 2033
- Figure 43: Middle East & Africa Home Dressing Table Revenue (million), by Types 2025 & 2033
- Figure 44: Middle East & Africa Home Dressing Table Volume (K), by Types 2025 & 2033
- Figure 45: Middle East & Africa Home Dressing Table Revenue Share (%), by Types 2025 & 2033
- Figure 46: Middle East & Africa Home Dressing Table Volume Share (%), by Types 2025 & 2033
- Figure 47: Middle East & Africa Home Dressing Table Revenue (million), by Country 2025 & 2033
- Figure 48: Middle East & Africa Home Dressing Table Volume (K), by Country 2025 & 2033
- Figure 49: Middle East & Africa Home Dressing Table Revenue Share (%), by Country 2025 & 2033
- Figure 50: Middle East & Africa Home Dressing Table Volume Share (%), by Country 2025 & 2033
- Figure 51: Asia Pacific Home Dressing Table Revenue (million), by Application 2025 & 2033
- Figure 52: Asia Pacific Home Dressing Table Volume (K), by Application 2025 & 2033
- Figure 53: Asia Pacific Home Dressing Table Revenue Share (%), by Application 2025 & 2033
- Figure 54: Asia Pacific Home Dressing Table Volume Share (%), by Application 2025 & 2033
- Figure 55: Asia Pacific Home Dressing Table Revenue (million), by Types 2025 & 2033
- Figure 56: Asia Pacific Home Dressing Table Volume (K), by Types 2025 & 2033
- Figure 57: Asia Pacific Home Dressing Table Revenue Share (%), by Types 2025 & 2033
- Figure 58: Asia Pacific Home Dressing Table Volume Share (%), by Types 2025 & 2033
- Figure 59: Asia Pacific Home Dressing Table Revenue (million), by Country 2025 & 2033
- Figure 60: Asia Pacific Home Dressing Table Volume (K), by Country 2025 & 2033
- Figure 61: Asia Pacific Home Dressing Table Revenue Share (%), by Country 2025 & 2033
- Figure 62: Asia Pacific Home Dressing Table Volume Share (%), by Country 2025 & 2033
List of Tables
- Table 1: Global Home Dressing Table Revenue million Forecast, by Application 2020 & 2033
- Table 2: Global Home Dressing Table Volume K Forecast, by Application 2020 & 2033
- Table 3: Global Home Dressing Table Revenue million Forecast, by Types 2020 & 2033
- Table 4: Global Home Dressing Table Volume K Forecast, by Types 2020 & 2033
- Table 5: Global Home Dressing Table Revenue million Forecast, by Region 2020 & 2033
- Table 6: Global Home Dressing Table Volume K Forecast, by Region 2020 & 2033
- Table 7: Global Home Dressing Table Revenue million Forecast, by Application 2020 & 2033
- Table 8: Global Home Dressing Table Volume K Forecast, by Application 2020 & 2033
- Table 9: Global Home Dressing Table Revenue million Forecast, by Types 2020 & 2033
- Table 10: Global Home Dressing Table Volume K Forecast, by Types 2020 & 2033
- Table 11: Global Home Dressing Table Revenue million Forecast, by Country 2020 & 2033
- Table 12: Global Home Dressing Table Volume K Forecast, by Country 2020 & 2033
- Table 13: United States Home Dressing Table Revenue (million) Forecast, by Application 2020 & 2033
- Table 14: United States Home Dressing Table Volume (K) Forecast, by Application 2020 & 2033
- Table 15: Canada Home Dressing Table Revenue (million) Forecast, by Application 2020 & 2033
- Table 16: Canada Home Dressing Table Volume (K) Forecast, by Application 2020 & 2033
- Table 17: Mexico Home Dressing Table Revenue (million) Forecast, by Application 2020 & 2033
- Table 18: Mexico Home Dressing Table Volume (K) Forecast, by Application 2020 & 2033
- Table 19: Global Home Dressing Table Revenue million Forecast, by Application 2020 & 2033
- Table 20: Global Home Dressing Table Volume K Forecast, by Application 2020 & 2033
- Table 21: Global Home Dressing Table Revenue million Forecast, by Types 2020 & 2033
- Table 22: Global Home Dressing Table Volume K Forecast, by Types 2020 & 2033
- Table 23: Global Home Dressing Table Revenue million Forecast, by Country 2020 & 2033
- Table 24: Global Home Dressing Table Volume K Forecast, by Country 2020 & 2033
- Table 25: Brazil Home Dressing Table Revenue (million) Forecast, by Application 2020 & 2033
- Table 26: Brazil Home Dressing Table Volume (K) Forecast, by Application 2020 & 2033
- Table 27: Argentina Home Dressing Table Revenue (million) Forecast, by Application 2020 & 2033
- Table 28: Argentina Home Dressing Table Volume (K) Forecast, by Application 2020 & 2033
- Table 29: Rest of South America Home Dressing Table Revenue (million) Forecast, by Application 2020 & 2033
- Table 30: Rest of South America Home Dressing Table Volume (K) Forecast, by Application 2020 & 2033
- Table 31: Global Home Dressing Table Revenue million Forecast, by Application 2020 & 2033
- Table 32: Global Home Dressing Table Volume K Forecast, by Application 2020 & 2033
- Table 33: Global Home Dressing Table Revenue million Forecast, by Types 2020 & 2033
- Table 34: Global Home Dressing Table Volume K Forecast, by Types 2020 & 2033
- Table 35: Global Home Dressing Table Revenue million Forecast, by Country 2020 & 2033
- Table 36: Global Home Dressing Table Volume K Forecast, by Country 2020 & 2033
- Table 37: United Kingdom Home Dressing Table Revenue (million) Forecast, by Application 2020 & 2033
- Table 38: United Kingdom Home Dressing Table Volume (K) Forecast, by Application 2020 & 2033
- Table 39: Germany Home Dressing Table Revenue (million) Forecast, by Application 2020 & 2033
- Table 40: Germany Home Dressing Table Volume (K) Forecast, by Application 2020 & 2033
- Table 41: France Home Dressing Table Revenue (million) Forecast, by Application 2020 & 2033
- Table 42: France Home Dressing Table Volume (K) Forecast, by Application 2020 & 2033
- Table 43: Italy Home Dressing Table Revenue (million) Forecast, by Application 2020 & 2033
- Table 44: Italy Home Dressing Table Volume (K) Forecast, by Application 2020 & 2033
- Table 45: Spain Home Dressing Table Revenue (million) Forecast, by Application 2020 & 2033
- Table 46: Spain Home Dressing Table Volume (K) Forecast, by Application 2020 & 2033
- Table 47: Russia Home Dressing Table Revenue (million) Forecast, by Application 2020 & 2033
- Table 48: Russia Home Dressing Table Volume (K) Forecast, by Application 2020 & 2033
- Table 49: Benelux Home Dressing Table Revenue (million) Forecast, by Application 2020 & 2033
- Table 50: Benelux Home Dressing Table Volume (K) Forecast, by Application 2020 & 2033
- Table 51: Nordics Home Dressing Table Revenue (million) Forecast, by Application 2020 & 2033
- Table 52: Nordics Home Dressing Table Volume (K) Forecast, by Application 2020 & 2033
- Table 53: Rest of Europe Home Dressing Table Revenue (million) Forecast, by Application 2020 & 2033
- Table 54: Rest of Europe Home Dressing Table Volume (K) Forecast, by Application 2020 & 2033
- Table 55: Global Home Dressing Table Revenue million Forecast, by Application 2020 & 2033
- Table 56: Global Home Dressing Table Volume K Forecast, by Application 2020 & 2033
- Table 57: Global Home Dressing Table Revenue million Forecast, by Types 2020 & 2033
- Table 58: Global Home Dressing Table Volume K Forecast, by Types 2020 & 2033
- Table 59: Global Home Dressing Table Revenue million Forecast, by Country 2020 & 2033
- Table 60: Global Home Dressing Table Volume K Forecast, by Country 2020 & 2033
- Table 61: Turkey Home Dressing Table Revenue (million) Forecast, by Application 2020 & 2033
- Table 62: Turkey Home Dressing Table Volume (K) Forecast, by Application 2020 & 2033
- Table 63: Israel Home Dressing Table Revenue (million) Forecast, by Application 2020 & 2033
- Table 64: Israel Home Dressing Table Volume (K) Forecast, by Application 2020 & 2033
- Table 65: GCC Home Dressing Table Revenue (million) Forecast, by Application 2020 & 2033
- Table 66: GCC Home Dressing Table Volume (K) Forecast, by Application 2020 & 2033
- Table 67: North Africa Home Dressing Table Revenue (million) Forecast, by Application 2020 & 2033
- Table 68: North Africa Home Dressing Table Volume (K) Forecast, by Application 2020 & 2033
- Table 69: South Africa Home Dressing Table Revenue (million) Forecast, by Application 2020 & 2033
- Table 70: South Africa Home Dressing Table Volume (K) Forecast, by Application 2020 & 2033
- Table 71: Rest of Middle East & Africa Home Dressing Table Revenue (million) Forecast, by Application 2020 & 2033
- Table 72: Rest of Middle East & Africa Home Dressing Table Volume (K) Forecast, by Application 2020 & 2033
- Table 73: Global Home Dressing Table Revenue million Forecast, by Application 2020 & 2033
- Table 74: Global Home Dressing Table Volume K Forecast, by Application 2020 & 2033
- Table 75: Global Home Dressing Table Revenue million Forecast, by Types 2020 & 2033
- Table 76: Global Home Dressing Table Volume K Forecast, by Types 2020 & 2033
- Table 77: Global Home Dressing Table Revenue million Forecast, by Country 2020 & 2033
- Table 78: Global Home Dressing Table Volume K Forecast, by Country 2020 & 2033
- Table 79: China Home Dressing Table Revenue (million) Forecast, by Application 2020 & 2033
- Table 80: China Home Dressing Table Volume (K) Forecast, by Application 2020 & 2033
- Table 81: India Home Dressing Table Revenue (million) Forecast, by Application 2020 & 2033
- Table 82: India Home Dressing Table Volume (K) Forecast, by Application 2020 & 2033
- Table 83: Japan Home Dressing Table Revenue (million) Forecast, by Application 2020 & 2033
- Table 84: Japan Home Dressing Table Volume (K) Forecast, by Application 2020 & 2033
- Table 85: South Korea Home Dressing Table Revenue (million) Forecast, by Application 2020 & 2033
- Table 86: South Korea Home Dressing Table Volume (K) Forecast, by Application 2020 & 2033
- Table 87: ASEAN Home Dressing Table Revenue (million) Forecast, by Application 2020 & 2033
- Table 88: ASEAN Home Dressing Table Volume (K) Forecast, by Application 2020 & 2033
- Table 89: Oceania Home Dressing Table Revenue (million) Forecast, by Application 2020 & 2033
- Table 90: Oceania Home Dressing Table Volume (K) Forecast, by Application 2020 & 2033
- Table 91: Rest of Asia Pacific Home Dressing Table Revenue (million) Forecast, by Application 2020 & 2033
- Table 92: Rest of Asia Pacific Home Dressing Table Volume (K) Forecast, by Application 2020 & 2033
Frequently Asked Questions
1. What is the projected Compound Annual Growth Rate (CAGR) of the Home Dressing Table?
The projected CAGR is approximately XX%.
2. Which companies are prominent players in the Home Dressing Table?
Key companies in the market include AMBOAN, Angelo Cappellini, Bbelle, Casamagna, CECCOTTI COLLEZIONI, COLOMBO STILE, Corte Zari, DANIELA LUCATO complementi d'arredo, Francesco Pasi, GALIMBERTI NINO, Gallotti&Radice, GC di Colombo Giancarlo, Giorgio Armani Casa, Heavens, Jetclass, LouisXV, Mantellassi 1926, Modenese Interiors Luxury Furniture, Oppein, Porada, Presotto, SALDA ARREDAMENTI, Soher, SPINI, Villa Nova Italia, VIMERCATI MEDA LUXURY CLASSIC FURNITURE, William Yeoward, Ziinlife.
3. What are the main segments of the Home Dressing Table?
The market segments include Application, Types.
4. Can you provide details about the market size?
The market size is estimated to be USD XXX million as of 2022.
5. What are some drivers contributing to market growth?
N/A
6. What are the notable trends driving market growth?
N/A
7. Are there any restraints impacting market growth?
N/A
8. Can you provide examples of recent developments in the market?
N/A
9. What pricing options are available for accessing the report?
Pricing options include single-user, multi-user, and enterprise licenses priced at USD 3350.00, USD 5025.00, and USD 6700.00 respectively.
10. Is the market size provided in terms of value or volume?
The market size is provided in terms of value, measured in million and volume, measured in K.
11. Are there any specific market keywords associated with the report?
Yes, the market keyword associated with the report is "Home Dressing Table," which aids in identifying and referencing the specific market segment covered.
12. How do I determine which pricing option suits my needs best?
The pricing options vary based on user requirements and access needs. Individual users may opt for single-user licenses, while businesses requiring broader access may choose multi-user or enterprise licenses for cost-effective access to the report.
13. Are there any additional resources or data provided in the Home Dressing Table report?
While the report offers comprehensive insights, it's advisable to review the specific contents or supplementary materials provided to ascertain if additional resources or data are available.
14. How can I stay updated on further developments or reports in the Home Dressing Table?
To stay informed about further developments, trends, and reports in the Home Dressing Table, consider subscribing to industry newsletters, following relevant companies and organizations, or regularly checking reputable industry news sources and publications.
Methodology
Step 1 - Identification of Relevant Samples Size from Population Database


Step 2 - Approaches for Defining Global Market Size (Value, Volume* & Price*)

Note*: In applicable scenarios
Step 3 - Data Sources
Primary Research
- Web Analytics
- Survey Reports
- Research Institute
- Latest Research Reports
- Opinion Leaders
Secondary Research
- Annual Reports
- White Paper
- Latest Press Release
- Industry Association
- Paid Database
- Investor Presentations

Step 4 - Data Triangulation
Involves using different sources of information in order to increase the validity of a study
These sources are likely to be stakeholders in a program - participants, other researchers, program staff, other community members, and so on.
Then we put all data in single framework & apply various statistical tools to find out the dynamic on the market.
During the analysis stage, feedback from the stakeholder groups would be compared to determine areas of agreement as well as areas of divergence