

Key Insights
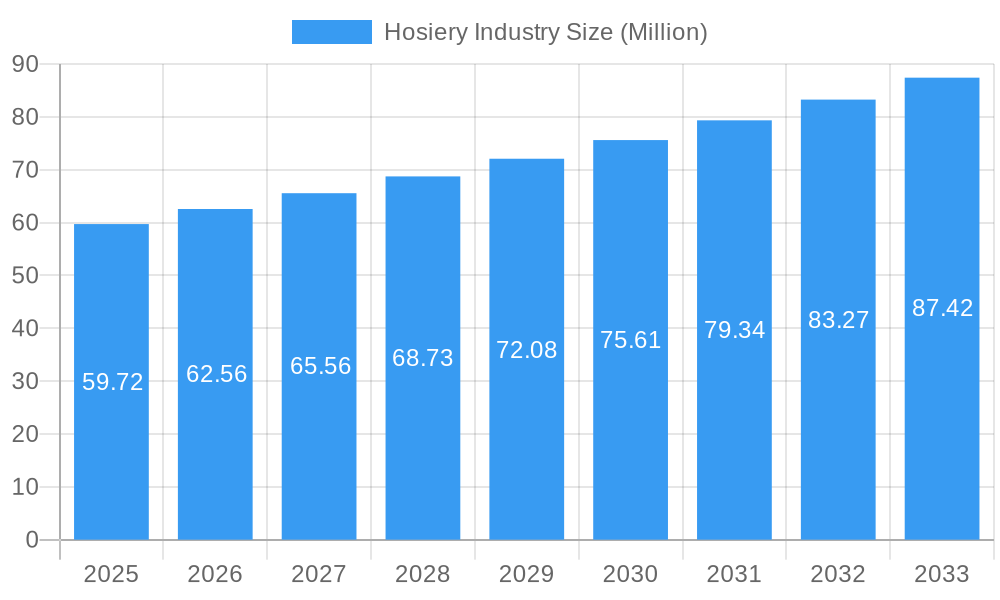
The global hosiery market, valued at $59.72 million in 2025, is projected to experience robust growth, exhibiting a Compound Annual Growth Rate (CAGR) of 4.86% from 2025 to 2033. This expansion is driven by several key factors. The rising popularity of athleisure wear and comfortable, functional apparel fuels demand for versatile hosiery products like athletic socks and shapewear. E-commerce growth provides convenient access to a wider selection of hosiery products, benefiting both established brands and emerging players. Furthermore, increasing fashion consciousness and the desire for personalized style contribute to the market's growth, as consumers seek out diverse colors, patterns, and materials. However, the market faces challenges such as fluctuating raw material prices and increased competition from lower-cost producers in certain regions.
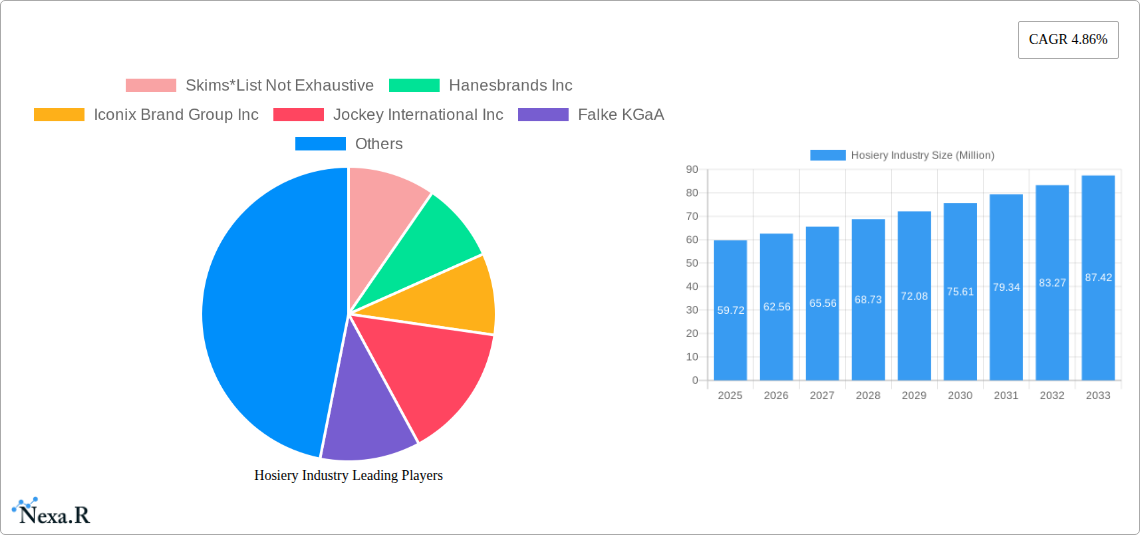
Hosiery Industry Market Size (In Million)
Market segmentation reveals significant opportunities. The women's segment currently dominates, although the men's segment is experiencing growth due to increasing acceptance of men's hosiery in various styles beyond traditional dress socks. Product-wise, body stockings and shapewear are experiencing high demand, reflecting the growing focus on body positivity and enhancing personal style. Online retail stores are witnessing significant traction as a distribution channel, outpacing traditional retail formats like supermarkets and specialty stores. Geographically, North America and Europe currently hold significant market share, but the Asia-Pacific region presents high growth potential due to rising disposable incomes and a burgeoning middle class. The presence of established players like Hanesbrands and emerging brands such as Skims highlights the dynamic competitive landscape, with both legacy brands and innovative startups vying for market share. Successful strategies will focus on innovation in materials, design, and distribution to cater to evolving consumer preferences.
Hosiery Industry Company Market Share
Hosiery Industry Market Report: 2019-2033
This comprehensive report provides an in-depth analysis of the global hosiery industry, encompassing market size, growth trends, competitive landscape, and future outlook. The study period covers 2019-2033, with 2025 as the base and estimated year. The report segments the market by product type (body stockings, socks, knee highs, hold-ups, other product types), end-user (men, women), and distribution channel (supermarkets/hypermarkets, specialty stores, online retail stores, other distribution channels), offering a granular understanding of this dynamic sector. The report's value is presented in Million units.
Hosiery Industry Market Dynamics & Structure
The global hosiery market is a dynamic landscape characterized by a moderately concentrated structure, where established leaders share the stage with a vibrant ecosystem of specialized and niche players. This blend of scale and agility fuels innovation and caters to diverse consumer needs. Advancements in material science are at the forefront, with a significant push towards sustainable fabrics such as recycled elastane and polyamide, aligning with growing environmental consciousness. Manufacturing processes are continuously refined for greater efficiency and reduced environmental impact. Furthermore, product design is evolving to incorporate enhanced comfort and specialized functionality, exemplified by performance-oriented items like pressure-free running socks. A robust regulatory environment, emphasizing material safety and accurate labeling, provides a framework for responsible market operations. While competition from alternative legwear and everyday footwear remains a factor, the industry is actively responding through differentiation and innovation. Shifting end-user demographics, particularly the increasing influence of younger consumers who prioritize sustainability and ethical sourcing, are profoundly shaping demand patterns. Mergers and acquisitions (M&A) remain a strategic tool for players seeking to broaden their product portfolios or strengthen their distribution networks. Between 2019 and 2024, approximately XX M&A deals were recorded, with an average deal value of XX million units, signaling targeted consolidation and strategic expansion within the sector.
- Market Concentration: Moderately concentrated, with the top 5 players accounting for approximately XX% of the market share (2024).
- Technological Innovation: A strong emphasis on sustainable materials, superior comfort, and pioneering designs that enhance performance and wearability.
- Regulatory Framework: Stringent regulations govern material safety and product labeling, ensuring consumer trust and product integrity.
- Competitive Substitutes: The market contends with competition from alternative legwear solutions and a broad range of footwear options.
- End-User Demographics: A pronounced and growing demand for hosiery products that are both sustainable and ethically produced, driven by conscious consumerism.
- M&A Trends: Moderate M&A activity, predominantly focused on strategic objectives such as expanding product assortments and optimizing distribution channels.
Hosiery Industry Growth Trends & Insights
The global hosiery market demonstrated robust growth, achieving a Compound Annual Growth Rate (CAGR) of XX% during the historical period of 2019-2024, culminating in a market size of XX million units in 2024. This upward trajectory was fueled by several key drivers, including increased disposable income leading to higher consumer spending on apparel, the burgeoning popularity of athleisure wear, and a widespread demand for comfortable, performance-driven hosiery. However, the industry is simultaneously navigating significant technological disruptions, most notably the transformative impact of e-commerce and the accelerating shift towards direct-to-consumer (DTC) sales models. Consumer behavior is undergoing a fundamental evolution, with a heightened emphasis on product sustainability and ethical sourcing practices. The forecast period (2025-2033) anticipates a sustained CAGR of XX%, propelled by the expansion of product categories, the introduction of innovative features, and the ever-increasing online penetration of the market. Market penetration is projected to reach an impressive XX% by 2033.
Dominant Regions, Countries, or Segments in Hosiery Industry
North America and Europe currently dominate the hosiery market, accounting for approximately xx% of global sales in 2024. Within product types, socks maintain the largest market share, followed by tights and knee-highs. The women's segment significantly outweighs the men's segment. Online retail stores are experiencing rapid growth as a distribution channel, while supermarkets and hypermarkets continue to play a significant role.
- Key Drivers:
- Strong consumer spending in developed markets.
- Increasing popularity of athleisure.
- Growing online retail penetration.
- Expansion of product categories.
- Dominance Factors:
- Established retail infrastructure.
- High consumer disposable income.
- Strong brand presence.
- Early adoption of e-commerce.
Hosiery Industry Product Landscape
The hosiery industry showcases continuous product innovation, emphasizing comfort, durability, and sustainability. Advancements in materials science have led to the development of seamless hosiery, pressure-free designs for athletic wear, and eco-friendly options utilizing recycled materials. Unique selling propositions frequently focus on superior comfort, breathability, and moisture-wicking capabilities, catering to diverse consumer preferences. Technological advancements are enhancing manufacturing processes, improving quality control, and reducing production costs.
Key Drivers, Barriers & Challenges in Hosiery Industry
Key Drivers:
- Growing demand for comfortable and functional hosiery.
- Rising popularity of athleisure wear.
- Increasing adoption of e-commerce.
- Innovation in materials and designs.
Key Challenges:
- Intense competition, including price wars.
- Supply chain disruptions affecting raw material availability and manufacturing.
- Fluctuations in raw material prices (e.g., cotton, nylon).
- Maintaining ethical and sustainable sourcing practices.
Emerging Opportunities in Hosiery Industry
- Expanding into untapped markets (e.g., developing economies).
- Growing demand for specialized hosiery (e.g., medical compression hosiery).
- Increasing focus on sustainable and ethically sourced products.
- Development of personalized hosiery through 3D printing and customization options.
Growth Accelerators in the Hosiery Industry
Several strategic initiatives and evolving market dynamics are acting as powerful catalysts for growth in the hosiery industry. Key among these are the formation of strategic partnerships between hosiery manufacturers and prominent apparel brands, fostering synergistic product development and market reach. Substantial investments in research and development are crucial for pioneering advanced materials and refining manufacturing processes, leading to enhanced product performance and sustainability. Furthermore, the strategic expansion into emerging and underserved markets, coupled with the widespread adoption and optimization of e-commerce platforms, are poised to drive significant market expansion and sustained growth in the coming years.
Key Players Shaping the Hosiery Industry Market
- Skims
- Hanesbrands Inc.
- Iconix Brand Group Inc.
- Jockey International Inc.
- Falke KGaA
- Gilfin S.p.A. (Golden Lady Company S.p.A.)
- Lanvin Group (Wolford AG)
- Spanx Inc.
- Heist Studios
- CSP International Fashion Group S.p.A.
- Carolina Hosiery Mill Inc. (Carolina Ultimate Real Tree)
- G-III Apparel Group (Donna Karan International)
Notable Milestones in Hosiery Industry Sector
- September 2021: SKIMS launched its first sock collection, diversifying its product line and entering the hosiery market.
- October 2021: Heist Studios unveiled sustainable tights, highlighting a growing focus on eco-friendly materials.
- May 2022: Falke introduced pressure-free running socks, showcasing innovation in comfort and performance.
In-Depth Hosiery Industry Market Outlook
The future trajectory of the hosiery industry appears exceptionally promising, driven by a confluence of factors including relentless product innovation, the expanding reach of e-commerce, and a steadily increasing consumer preference for sustainable products. Strategic alliances, aggressive expansion into new geographical territories, and dedicated investments in research and development are set to be the primary engines of significant growth. These developments will create lucrative opportunities for both established industry leaders and agile new entrants. The market is poised for considerable expansion, with substantial growth potential identified in developing economies and specialized, high-value niche segments. The industry is evolving to meet the demands of a discerning global consumer, prioritizing quality, comfort, sustainability, and ethical production.
Hosiery Industry Segmentation
-
1. Product Type
- 1.1. Body stockings
- 1.2. Socks
- 1.3. Knee highs, Hold-ups
- 1.4. Other Product Types
-
2. End-User
- 2.1. Men
- 2.2. Women
-
3. Distribution Channel
- 3.1. Supermarkets/Hypermarkets
- 3.2. Specialty Stores
- 3.3. Online Retail Stores
- 3.4. Other Distribution Channels
Hosiery Industry Segmentation By Geography
-
1. North America
- 1.1. United States
- 1.2. Canada
- 1.3. Mexico
- 1.4. Rest of North America
-
2. Europe
- 2.1. Spain
- 2.2. United Kingdom
- 2.3. Germany
- 2.4. France
- 2.5. Italy
- 2.6. Russia
- 2.7. Rest of Europe
-
3. Asia Pacific
- 3.1. China
- 3.2. Japan
- 3.3. India
- 3.4. Australia
- 3.5. Rest of Asia Pacific
-
4. South America
- 4.1. Brazil
- 4.2. Argentina
- 4.3. Rest of South America
-
5. Middle East and Africa
- 5.1. South Africa
- 5.2. Saudi Arabia
- 5.3. Rest of Middle East and Africa
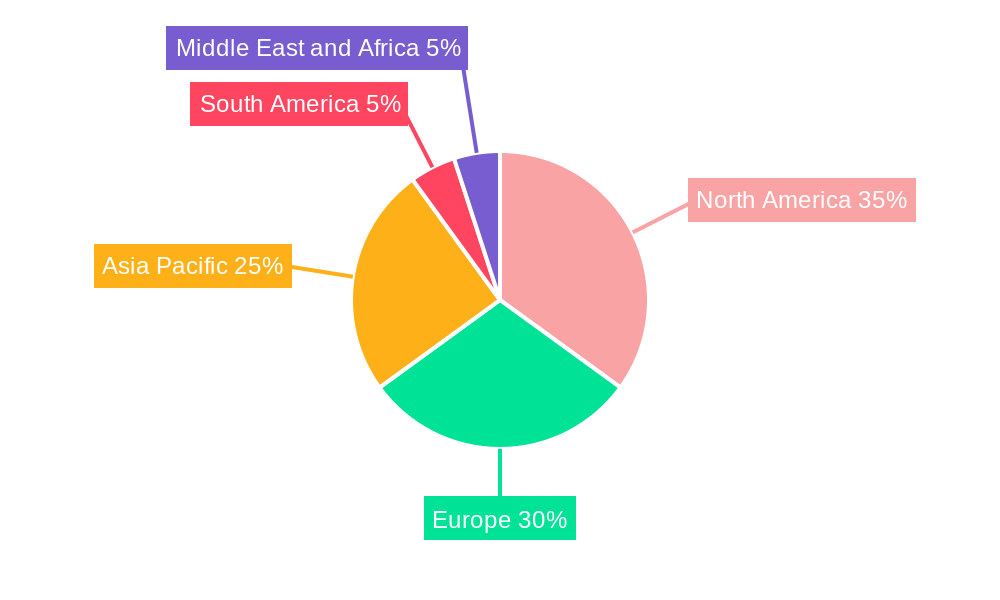
Hosiery Industry Regional Market Share
Geographic Coverage of Hosiery Industry
Hosiery Industry REPORT HIGHLIGHTS
| Aspects | Details |
|---|---|
| Study Period | 2020-2034 |
| Base Year | 2025 |
| Estimated Year | 2026 |
| Forecast Period | 2026-2034 |
| Historical Period | 2020-2025 |
| Growth Rate | CAGR of 4.86% from 2020-2034 |
| Segmentation |
|
Table of Contents
- 1. Introduction
- 1.1. Research Scope
- 1.2. Market Segmentation
- 1.3. Research Objective
- 1.4. Definitions and Assumptions
- 2. Executive Summary
- 2.1. Market Snapshot
- 3. Market Dynamics
- 3.1. Market Drivers
- 3.2. Market Restrains
- 3.3. Market Trends
- 3.4. Market Opportunities
- 4. Market Factor Analysis
- 4.1. Porters Five Forces
- 4.1.1. Bargaining Power of Suppliers
- 4.1.2. Bargaining Power of Buyers
- 4.1.3. Threat of New Entrants
- 4.1.4. Threat of Substitutes
- 4.1.5. Competitive Rivalry
- 4.2. PESTEL analysis
- 4.3. BCG Analysis
- 4.3.1. Stars (High Growth, High Market Share)
- 4.3.2. Cash Cows (Low Growth, High Market Share)
- 4.3.3. Question Mark (High Growth, Low Market Share)
- 4.3.4. Dogs (Low Growth, Low Market Share)
- 4.4. Ansoff Matrix Analysis
- 4.5. Supply Chain Analysis
- 4.6. Regulatory Landscape
- 4.7. Current Market Potential and Opportunity Assessment (TAM–SAM–SOM Framework)
- 4.8. NRP Analyst Note
- 4.1. Porters Five Forces
- 5. Market Analysis, Insights and Forecast 2021-2033
- 5.1. Market Analysis, Insights and Forecast - by Product Type
- 5.1.1. Body stockings
- 5.1.2. Socks
- 5.1.3. Knee highs, Hold-ups
- 5.1.4. Other Product Types
- 5.2. Market Analysis, Insights and Forecast - by End-User
- 5.2.1. Men
- 5.2.2. Women
- 5.3. Market Analysis, Insights and Forecast - by Distribution Channel
- 5.3.1. Supermarkets/Hypermarkets
- 5.3.2. Specialty Stores
- 5.3.3. Online Retail Stores
- 5.3.4. Other Distribution Channels
- 5.4. Market Analysis, Insights and Forecast - by Region
- 5.4.1. North America
- 5.4.2. Europe
- 5.4.3. Asia Pacific
- 5.4.4. South America
- 5.4.5. Middle East and Africa
- 5.1. Market Analysis, Insights and Forecast - by Product Type
- 6. Global Hosiery Industry Analysis, Insights and Forecast, 2021-2033
- 6.1. Market Analysis, Insights and Forecast - by Product Type
- 6.1.1. Body stockings
- 6.1.2. Socks
- 6.1.3. Knee highs, Hold-ups
- 6.1.4. Other Product Types
- 6.2. Market Analysis, Insights and Forecast - by End-User
- 6.2.1. Men
- 6.2.2. Women
- 6.3. Market Analysis, Insights and Forecast - by Distribution Channel
- 6.3.1. Supermarkets/Hypermarkets
- 6.3.2. Specialty Stores
- 6.3.3. Online Retail Stores
- 6.3.4. Other Distribution Channels
- 6.1. Market Analysis, Insights and Forecast - by Product Type
- 7. North America Hosiery Industry Analysis, Insights and Forecast, 2020-2032
- 7.1. Market Analysis, Insights and Forecast - by Product Type
- 7.1.1. Body stockings
- 7.1.2. Socks
- 7.1.3. Knee highs, Hold-ups
- 7.1.4. Other Product Types
- 7.2. Market Analysis, Insights and Forecast - by End-User
- 7.2.1. Men
- 7.2.2. Women
- 7.3. Market Analysis, Insights and Forecast - by Distribution Channel
- 7.3.1. Supermarkets/Hypermarkets
- 7.3.2. Specialty Stores
- 7.3.3. Online Retail Stores
- 7.3.4. Other Distribution Channels
- 7.1. Market Analysis, Insights and Forecast - by Product Type
- 8. Europe Hosiery Industry Analysis, Insights and Forecast, 2020-2032
- 8.1. Market Analysis, Insights and Forecast - by Product Type
- 8.1.1. Body stockings
- 8.1.2. Socks
- 8.1.3. Knee highs, Hold-ups
- 8.1.4. Other Product Types
- 8.2. Market Analysis, Insights and Forecast - by End-User
- 8.2.1. Men
- 8.2.2. Women
- 8.3. Market Analysis, Insights and Forecast - by Distribution Channel
- 8.3.1. Supermarkets/Hypermarkets
- 8.3.2. Specialty Stores
- 8.3.3. Online Retail Stores
- 8.3.4. Other Distribution Channels
- 8.1. Market Analysis, Insights and Forecast - by Product Type
- 9. Asia Pacific Hosiery Industry Analysis, Insights and Forecast, 2020-2032
- 9.1. Market Analysis, Insights and Forecast - by Product Type
- 9.1.1. Body stockings
- 9.1.2. Socks
- 9.1.3. Knee highs, Hold-ups
- 9.1.4. Other Product Types
- 9.2. Market Analysis, Insights and Forecast - by End-User
- 9.2.1. Men
- 9.2.2. Women
- 9.3. Market Analysis, Insights and Forecast - by Distribution Channel
- 9.3.1. Supermarkets/Hypermarkets
- 9.3.2. Specialty Stores
- 9.3.3. Online Retail Stores
- 9.3.4. Other Distribution Channels
- 9.1. Market Analysis, Insights and Forecast - by Product Type
- 10. South America Hosiery Industry Analysis, Insights and Forecast, 2020-2032
- 10.1. Market Analysis, Insights and Forecast - by Product Type
- 10.1.1. Body stockings
- 10.1.2. Socks
- 10.1.3. Knee highs, Hold-ups
- 10.1.4. Other Product Types
- 10.2. Market Analysis, Insights and Forecast - by End-User
- 10.2.1. Men
- 10.2.2. Women
- 10.3. Market Analysis, Insights and Forecast - by Distribution Channel
- 10.3.1. Supermarkets/Hypermarkets
- 10.3.2. Specialty Stores
- 10.3.3. Online Retail Stores
- 10.3.4. Other Distribution Channels
- 10.1. Market Analysis, Insights and Forecast - by Product Type
- 11. Middle East and Africa Hosiery Industry Analysis, Insights and Forecast, 2020-2032
- 11.1. Market Analysis, Insights and Forecast - by Product Type
- 11.1.1. Body stockings
- 11.1.2. Socks
- 11.1.3. Knee highs, Hold-ups
- 11.1.4. Other Product Types
- 11.2. Market Analysis, Insights and Forecast - by End-User
- 11.2.1. Men
- 11.2.2. Women
- 11.3. Market Analysis, Insights and Forecast - by Distribution Channel
- 11.3.1. Supermarkets/Hypermarkets
- 11.3.2. Specialty Stores
- 11.3.3. Online Retail Stores
- 11.3.4. Other Distribution Channels
- 11.1. Market Analysis, Insights and Forecast - by Product Type
- 12. Competitive Analysis
- 12.1. Company Profiles
- 12.1.1 Skims*List Not Exhaustive
- 12.1.1.1. Company Overview
- 12.1.1.2. Products
- 12.1.1.3. Company Financials
- 12.1.1.4. SWOT Analysis
- 12.1.2 Hanesbrands Inc
- 12.1.2.1. Company Overview
- 12.1.2.2. Products
- 12.1.2.3. Company Financials
- 12.1.2.4. SWOT Analysis
- 12.1.3 Iconix Brand Group Inc
- 12.1.3.1. Company Overview
- 12.1.3.2. Products
- 12.1.3.3. Company Financials
- 12.1.3.4. SWOT Analysis
- 12.1.4 Jockey International Inc
- 12.1.4.1. Company Overview
- 12.1.4.2. Products
- 12.1.4.3. Company Financials
- 12.1.4.4. SWOT Analysis
- 12.1.5 Falke KGaA
- 12.1.5.1. Company Overview
- 12.1.5.2. Products
- 12.1.5.3. Company Financials
- 12.1.5.4. SWOT Analysis
- 12.1.6 Gilfin S P A (Golden Lady Company S P A)
- 12.1.6.1. Company Overview
- 12.1.6.2. Products
- 12.1.6.3. Company Financials
- 12.1.6.4. SWOT Analysis
- 12.1.7 Lanvin Group (Wolford AG)
- 12.1.7.1. Company Overview
- 12.1.7.2. Products
- 12.1.7.3. Company Financials
- 12.1.7.4. SWOT Analysis
- 12.1.8 Spanx Inc
- 12.1.8.1. Company Overview
- 12.1.8.2. Products
- 12.1.8.3. Company Financials
- 12.1.8.4. SWOT Analysis
- 12.1.9 Heist Studios
- 12.1.9.1. Company Overview
- 12.1.9.2. Products
- 12.1.9.3. Company Financials
- 12.1.9.4. SWOT Analysis
- 12.1.10 CSP International Fashion Group S P A
- 12.1.10.1. Company Overview
- 12.1.10.2. Products
- 12.1.10.3. Company Financials
- 12.1.10.4. SWOT Analysis
- 12.1.11 Carolina Hosiery Mill Inc (Carolina Ultimate Real Tree)
- 12.1.11.1. Company Overview
- 12.1.11.2. Products
- 12.1.11.3. Company Financials
- 12.1.11.4. SWOT Analysis
- 12.1.12 G-III Apparel Group (Donna Karan International)
- 12.1.12.1. Company Overview
- 12.1.12.2. Products
- 12.1.12.3. Company Financials
- 12.1.12.4. SWOT Analysis
- 12.1.1 Skims*List Not Exhaustive
- 12.2. Market Entropy
- 12.2.1 Company's Key Areas Served
- 12.2.2 Recent Developments
- 12.3. Company Market Share Analysis 2025
- 12.3.1 Top 5 Companies Market Share Analysis
- 12.3.2 Top 3 Companies Market Share Analysis
- 12.4. List of Potential Customers
- 13. Research Methodology
List of Figures
- Figure 1: Global Hosiery Industry Revenue Breakdown (Million, %) by Region 2025 & 2033
- Figure 2: Global Hosiery Industry Volume Breakdown (K Units, %) by Region 2025 & 2033
- Figure 3: North America Hosiery Industry Revenue (Million), by Product Type 2025 & 2033
- Figure 4: North America Hosiery Industry Volume (K Units), by Product Type 2025 & 2033
- Figure 5: North America Hosiery Industry Revenue Share (%), by Product Type 2025 & 2033
- Figure 6: North America Hosiery Industry Volume Share (%), by Product Type 2025 & 2033
- Figure 7: North America Hosiery Industry Revenue (Million), by End-User 2025 & 2033
- Figure 8: North America Hosiery Industry Volume (K Units), by End-User 2025 & 2033
- Figure 9: North America Hosiery Industry Revenue Share (%), by End-User 2025 & 2033
- Figure 10: North America Hosiery Industry Volume Share (%), by End-User 2025 & 2033
- Figure 11: North America Hosiery Industry Revenue (Million), by Distribution Channel 2025 & 2033
- Figure 12: North America Hosiery Industry Volume (K Units), by Distribution Channel 2025 & 2033
- Figure 13: North America Hosiery Industry Revenue Share (%), by Distribution Channel 2025 & 2033
- Figure 14: North America Hosiery Industry Volume Share (%), by Distribution Channel 2025 & 2033
- Figure 15: North America Hosiery Industry Revenue (Million), by Country 2025 & 2033
- Figure 16: North America Hosiery Industry Volume (K Units), by Country 2025 & 2033
- Figure 17: North America Hosiery Industry Revenue Share (%), by Country 2025 & 2033
- Figure 18: North America Hosiery Industry Volume Share (%), by Country 2025 & 2033
- Figure 19: Europe Hosiery Industry Revenue (Million), by Product Type 2025 & 2033
- Figure 20: Europe Hosiery Industry Volume (K Units), by Product Type 2025 & 2033
- Figure 21: Europe Hosiery Industry Revenue Share (%), by Product Type 2025 & 2033
- Figure 22: Europe Hosiery Industry Volume Share (%), by Product Type 2025 & 2033
- Figure 23: Europe Hosiery Industry Revenue (Million), by End-User 2025 & 2033
- Figure 24: Europe Hosiery Industry Volume (K Units), by End-User 2025 & 2033
- Figure 25: Europe Hosiery Industry Revenue Share (%), by End-User 2025 & 2033
- Figure 26: Europe Hosiery Industry Volume Share (%), by End-User 2025 & 2033
- Figure 27: Europe Hosiery Industry Revenue (Million), by Distribution Channel 2025 & 2033
- Figure 28: Europe Hosiery Industry Volume (K Units), by Distribution Channel 2025 & 2033
- Figure 29: Europe Hosiery Industry Revenue Share (%), by Distribution Channel 2025 & 2033
- Figure 30: Europe Hosiery Industry Volume Share (%), by Distribution Channel 2025 & 2033
- Figure 31: Europe Hosiery Industry Revenue (Million), by Country 2025 & 2033
- Figure 32: Europe Hosiery Industry Volume (K Units), by Country 2025 & 2033
- Figure 33: Europe Hosiery Industry Revenue Share (%), by Country 2025 & 2033
- Figure 34: Europe Hosiery Industry Volume Share (%), by Country 2025 & 2033
- Figure 35: Asia Pacific Hosiery Industry Revenue (Million), by Product Type 2025 & 2033
- Figure 36: Asia Pacific Hosiery Industry Volume (K Units), by Product Type 2025 & 2033
- Figure 37: Asia Pacific Hosiery Industry Revenue Share (%), by Product Type 2025 & 2033
- Figure 38: Asia Pacific Hosiery Industry Volume Share (%), by Product Type 2025 & 2033
- Figure 39: Asia Pacific Hosiery Industry Revenue (Million), by End-User 2025 & 2033
- Figure 40: Asia Pacific Hosiery Industry Volume (K Units), by End-User 2025 & 2033
- Figure 41: Asia Pacific Hosiery Industry Revenue Share (%), by End-User 2025 & 2033
- Figure 42: Asia Pacific Hosiery Industry Volume Share (%), by End-User 2025 & 2033
- Figure 43: Asia Pacific Hosiery Industry Revenue (Million), by Distribution Channel 2025 & 2033
- Figure 44: Asia Pacific Hosiery Industry Volume (K Units), by Distribution Channel 2025 & 2033
- Figure 45: Asia Pacific Hosiery Industry Revenue Share (%), by Distribution Channel 2025 & 2033
- Figure 46: Asia Pacific Hosiery Industry Volume Share (%), by Distribution Channel 2025 & 2033
- Figure 47: Asia Pacific Hosiery Industry Revenue (Million), by Country 2025 & 2033
- Figure 48: Asia Pacific Hosiery Industry Volume (K Units), by Country 2025 & 2033
- Figure 49: Asia Pacific Hosiery Industry Revenue Share (%), by Country 2025 & 2033
- Figure 50: Asia Pacific Hosiery Industry Volume Share (%), by Country 2025 & 2033
- Figure 51: South America Hosiery Industry Revenue (Million), by Product Type 2025 & 2033
- Figure 52: South America Hosiery Industry Volume (K Units), by Product Type 2025 & 2033
- Figure 53: South America Hosiery Industry Revenue Share (%), by Product Type 2025 & 2033
- Figure 54: South America Hosiery Industry Volume Share (%), by Product Type 2025 & 2033
- Figure 55: South America Hosiery Industry Revenue (Million), by End-User 2025 & 2033
- Figure 56: South America Hosiery Industry Volume (K Units), by End-User 2025 & 2033
- Figure 57: South America Hosiery Industry Revenue Share (%), by End-User 2025 & 2033
- Figure 58: South America Hosiery Industry Volume Share (%), by End-User 2025 & 2033
- Figure 59: South America Hosiery Industry Revenue (Million), by Distribution Channel 2025 & 2033
- Figure 60: South America Hosiery Industry Volume (K Units), by Distribution Channel 2025 & 2033
- Figure 61: South America Hosiery Industry Revenue Share (%), by Distribution Channel 2025 & 2033
- Figure 62: South America Hosiery Industry Volume Share (%), by Distribution Channel 2025 & 2033
- Figure 63: South America Hosiery Industry Revenue (Million), by Country 2025 & 2033
- Figure 64: South America Hosiery Industry Volume (K Units), by Country 2025 & 2033
- Figure 65: South America Hosiery Industry Revenue Share (%), by Country 2025 & 2033
- Figure 66: South America Hosiery Industry Volume Share (%), by Country 2025 & 2033
- Figure 67: Middle East and Africa Hosiery Industry Revenue (Million), by Product Type 2025 & 2033
- Figure 68: Middle East and Africa Hosiery Industry Volume (K Units), by Product Type 2025 & 2033
- Figure 69: Middle East and Africa Hosiery Industry Revenue Share (%), by Product Type 2025 & 2033
- Figure 70: Middle East and Africa Hosiery Industry Volume Share (%), by Product Type 2025 & 2033
- Figure 71: Middle East and Africa Hosiery Industry Revenue (Million), by End-User 2025 & 2033
- Figure 72: Middle East and Africa Hosiery Industry Volume (K Units), by End-User 2025 & 2033
- Figure 73: Middle East and Africa Hosiery Industry Revenue Share (%), by End-User 2025 & 2033
- Figure 74: Middle East and Africa Hosiery Industry Volume Share (%), by End-User 2025 & 2033
- Figure 75: Middle East and Africa Hosiery Industry Revenue (Million), by Distribution Channel 2025 & 2033
- Figure 76: Middle East and Africa Hosiery Industry Volume (K Units), by Distribution Channel 2025 & 2033
- Figure 77: Middle East and Africa Hosiery Industry Revenue Share (%), by Distribution Channel 2025 & 2033
- Figure 78: Middle East and Africa Hosiery Industry Volume Share (%), by Distribution Channel 2025 & 2033
- Figure 79: Middle East and Africa Hosiery Industry Revenue (Million), by Country 2025 & 2033
- Figure 80: Middle East and Africa Hosiery Industry Volume (K Units), by Country 2025 & 2033
- Figure 81: Middle East and Africa Hosiery Industry Revenue Share (%), by Country 2025 & 2033
- Figure 82: Middle East and Africa Hosiery Industry Volume Share (%), by Country 2025 & 2033
List of Tables
- Table 1: Global Hosiery Industry Revenue Million Forecast, by Product Type 2020 & 2033
- Table 2: Global Hosiery Industry Volume K Units Forecast, by Product Type 2020 & 2033
- Table 3: Global Hosiery Industry Revenue Million Forecast, by End-User 2020 & 2033
- Table 4: Global Hosiery Industry Volume K Units Forecast, by End-User 2020 & 2033
- Table 5: Global Hosiery Industry Revenue Million Forecast, by Distribution Channel 2020 & 2033
- Table 6: Global Hosiery Industry Volume K Units Forecast, by Distribution Channel 2020 & 2033
- Table 7: Global Hosiery Industry Revenue Million Forecast, by Region 2020 & 2033
- Table 8: Global Hosiery Industry Volume K Units Forecast, by Region 2020 & 2033
- Table 9: Global Hosiery Industry Revenue Million Forecast, by Product Type 2020 & 2033
- Table 10: Global Hosiery Industry Volume K Units Forecast, by Product Type 2020 & 2033
- Table 11: Global Hosiery Industry Revenue Million Forecast, by End-User 2020 & 2033
- Table 12: Global Hosiery Industry Volume K Units Forecast, by End-User 2020 & 2033
- Table 13: Global Hosiery Industry Revenue Million Forecast, by Distribution Channel 2020 & 2033
- Table 14: Global Hosiery Industry Volume K Units Forecast, by Distribution Channel 2020 & 2033
- Table 15: Global Hosiery Industry Revenue Million Forecast, by Country 2020 & 2033
- Table 16: Global Hosiery Industry Volume K Units Forecast, by Country 2020 & 2033
- Table 17: United States Hosiery Industry Revenue (Million) Forecast, by Application 2020 & 2033
- Table 18: United States Hosiery Industry Volume (K Units) Forecast, by Application 2020 & 2033
- Table 19: Canada Hosiery Industry Revenue (Million) Forecast, by Application 2020 & 2033
- Table 20: Canada Hosiery Industry Volume (K Units) Forecast, by Application 2020 & 2033
- Table 21: Mexico Hosiery Industry Revenue (Million) Forecast, by Application 2020 & 2033
- Table 22: Mexico Hosiery Industry Volume (K Units) Forecast, by Application 2020 & 2033
- Table 23: Rest of North America Hosiery Industry Revenue (Million) Forecast, by Application 2020 & 2033
- Table 24: Rest of North America Hosiery Industry Volume (K Units) Forecast, by Application 2020 & 2033
- Table 25: Global Hosiery Industry Revenue Million Forecast, by Product Type 2020 & 2033
- Table 26: Global Hosiery Industry Volume K Units Forecast, by Product Type 2020 & 2033
- Table 27: Global Hosiery Industry Revenue Million Forecast, by End-User 2020 & 2033
- Table 28: Global Hosiery Industry Volume K Units Forecast, by End-User 2020 & 2033
- Table 29: Global Hosiery Industry Revenue Million Forecast, by Distribution Channel 2020 & 2033
- Table 30: Global Hosiery Industry Volume K Units Forecast, by Distribution Channel 2020 & 2033
- Table 31: Global Hosiery Industry Revenue Million Forecast, by Country 2020 & 2033
- Table 32: Global Hosiery Industry Volume K Units Forecast, by Country 2020 & 2033
- Table 33: Spain Hosiery Industry Revenue (Million) Forecast, by Application 2020 & 2033
- Table 34: Spain Hosiery Industry Volume (K Units) Forecast, by Application 2020 & 2033
- Table 35: United Kingdom Hosiery Industry Revenue (Million) Forecast, by Application 2020 & 2033
- Table 36: United Kingdom Hosiery Industry Volume (K Units) Forecast, by Application 2020 & 2033
- Table 37: Germany Hosiery Industry Revenue (Million) Forecast, by Application 2020 & 2033
- Table 38: Germany Hosiery Industry Volume (K Units) Forecast, by Application 2020 & 2033
- Table 39: France Hosiery Industry Revenue (Million) Forecast, by Application 2020 & 2033
- Table 40: France Hosiery Industry Volume (K Units) Forecast, by Application 2020 & 2033
- Table 41: Italy Hosiery Industry Revenue (Million) Forecast, by Application 2020 & 2033
- Table 42: Italy Hosiery Industry Volume (K Units) Forecast, by Application 2020 & 2033
- Table 43: Russia Hosiery Industry Revenue (Million) Forecast, by Application 2020 & 2033
- Table 44: Russia Hosiery Industry Volume (K Units) Forecast, by Application 2020 & 2033
- Table 45: Rest of Europe Hosiery Industry Revenue (Million) Forecast, by Application 2020 & 2033
- Table 46: Rest of Europe Hosiery Industry Volume (K Units) Forecast, by Application 2020 & 2033
- Table 47: Global Hosiery Industry Revenue Million Forecast, by Product Type 2020 & 2033
- Table 48: Global Hosiery Industry Volume K Units Forecast, by Product Type 2020 & 2033
- Table 49: Global Hosiery Industry Revenue Million Forecast, by End-User 2020 & 2033
- Table 50: Global Hosiery Industry Volume K Units Forecast, by End-User 2020 & 2033
- Table 51: Global Hosiery Industry Revenue Million Forecast, by Distribution Channel 2020 & 2033
- Table 52: Global Hosiery Industry Volume K Units Forecast, by Distribution Channel 2020 & 2033
- Table 53: Global Hosiery Industry Revenue Million Forecast, by Country 2020 & 2033
- Table 54: Global Hosiery Industry Volume K Units Forecast, by Country 2020 & 2033
- Table 55: China Hosiery Industry Revenue (Million) Forecast, by Application 2020 & 2033
- Table 56: China Hosiery Industry Volume (K Units) Forecast, by Application 2020 & 2033
- Table 57: Japan Hosiery Industry Revenue (Million) Forecast, by Application 2020 & 2033
- Table 58: Japan Hosiery Industry Volume (K Units) Forecast, by Application 2020 & 2033
- Table 59: India Hosiery Industry Revenue (Million) Forecast, by Application 2020 & 2033
- Table 60: India Hosiery Industry Volume (K Units) Forecast, by Application 2020 & 2033
- Table 61: Australia Hosiery Industry Revenue (Million) Forecast, by Application 2020 & 2033
- Table 62: Australia Hosiery Industry Volume (K Units) Forecast, by Application 2020 & 2033
- Table 63: Rest of Asia Pacific Hosiery Industry Revenue (Million) Forecast, by Application 2020 & 2033
- Table 64: Rest of Asia Pacific Hosiery Industry Volume (K Units) Forecast, by Application 2020 & 2033
- Table 65: Global Hosiery Industry Revenue Million Forecast, by Product Type 2020 & 2033
- Table 66: Global Hosiery Industry Volume K Units Forecast, by Product Type 2020 & 2033
- Table 67: Global Hosiery Industry Revenue Million Forecast, by End-User 2020 & 2033
- Table 68: Global Hosiery Industry Volume K Units Forecast, by End-User 2020 & 2033
- Table 69: Global Hosiery Industry Revenue Million Forecast, by Distribution Channel 2020 & 2033
- Table 70: Global Hosiery Industry Volume K Units Forecast, by Distribution Channel 2020 & 2033
- Table 71: Global Hosiery Industry Revenue Million Forecast, by Country 2020 & 2033
- Table 72: Global Hosiery Industry Volume K Units Forecast, by Country 2020 & 2033
- Table 73: Brazil Hosiery Industry Revenue (Million) Forecast, by Application 2020 & 2033
- Table 74: Brazil Hosiery Industry Volume (K Units) Forecast, by Application 2020 & 2033
- Table 75: Argentina Hosiery Industry Revenue (Million) Forecast, by Application 2020 & 2033
- Table 76: Argentina Hosiery Industry Volume (K Units) Forecast, by Application 2020 & 2033
- Table 77: Rest of South America Hosiery Industry Revenue (Million) Forecast, by Application 2020 & 2033
- Table 78: Rest of South America Hosiery Industry Volume (K Units) Forecast, by Application 2020 & 2033
- Table 79: Global Hosiery Industry Revenue Million Forecast, by Product Type 2020 & 2033
- Table 80: Global Hosiery Industry Volume K Units Forecast, by Product Type 2020 & 2033
- Table 81: Global Hosiery Industry Revenue Million Forecast, by End-User 2020 & 2033
- Table 82: Global Hosiery Industry Volume K Units Forecast, by End-User 2020 & 2033
- Table 83: Global Hosiery Industry Revenue Million Forecast, by Distribution Channel 2020 & 2033
- Table 84: Global Hosiery Industry Volume K Units Forecast, by Distribution Channel 2020 & 2033
- Table 85: Global Hosiery Industry Revenue Million Forecast, by Country 2020 & 2033
- Table 86: Global Hosiery Industry Volume K Units Forecast, by Country 2020 & 2033
- Table 87: South Africa Hosiery Industry Revenue (Million) Forecast, by Application 2020 & 2033
- Table 88: South Africa Hosiery Industry Volume (K Units) Forecast, by Application 2020 & 2033
- Table 89: Saudi Arabia Hosiery Industry Revenue (Million) Forecast, by Application 2020 & 2033
- Table 90: Saudi Arabia Hosiery Industry Volume (K Units) Forecast, by Application 2020 & 2033
- Table 91: Rest of Middle East and Africa Hosiery Industry Revenue (Million) Forecast, by Application 2020 & 2033
- Table 92: Rest of Middle East and Africa Hosiery Industry Volume (K Units) Forecast, by Application 2020 & 2033
Frequently Asked Questions
1. What is the projected Compound Annual Growth Rate (CAGR) of the Hosiery Industry?
The projected CAGR is approximately 4.86%.
2. Which companies are prominent players in the Hosiery Industry?
Key companies in the market include Skims*List Not Exhaustive, Hanesbrands Inc, Iconix Brand Group Inc, Jockey International Inc, Falke KGaA, Gilfin S P A (Golden Lady Company S P A), Lanvin Group (Wolford AG), Spanx Inc, Heist Studios, CSP International Fashion Group S P A, Carolina Hosiery Mill Inc (Carolina Ultimate Real Tree), G-III Apparel Group (Donna Karan International).
3. What are the main segments of the Hosiery Industry?
The market segments include Product Type, End-User, Distribution Channel.
4. Can you provide details about the market size?
The market size is estimated to be USD 59.72 Million as of 2022.
5. What are some drivers contributing to market growth?
Fast Fashion Trend; Inflating Income Level of Individuals.
6. What are the notable trends driving market growth?
Innovative Garments Dominates the Market.
7. Are there any restraints impacting market growth?
The Presence Of Counterfeit Products.
8. Can you provide examples of recent developments in the market?
In May 2022, Falke Introduced New Pressure-Free Running Socks. Falke's new Pressure-Free sock incorporates a unique design feature to reduce the potential hotspot across the bridge of the foot. Falke has inserted a striated pad of channels on top of the foot that may move dynamically in response to foot movements. This helps to spread movement pressure and relieve pressure buildup in this area.
9. What pricing options are available for accessing the report?
Pricing options include single-user, multi-user, and enterprise licenses priced at USD 4750, USD 5250, and USD 8750 respectively.
10. Is the market size provided in terms of value or volume?
The market size is provided in terms of value, measured in Million and volume, measured in K Units.
11. Are there any specific market keywords associated with the report?
Yes, the market keyword associated with the report is "Hosiery Industry," which aids in identifying and referencing the specific market segment covered.
12. How do I determine which pricing option suits my needs best?
The pricing options vary based on user requirements and access needs. Individual users may opt for single-user licenses, while businesses requiring broader access may choose multi-user or enterprise licenses for cost-effective access to the report.
13. Are there any additional resources or data provided in the Hosiery Industry report?
While the report offers comprehensive insights, it's advisable to review the specific contents or supplementary materials provided to ascertain if additional resources or data are available.
14. How can I stay updated on further developments or reports in the Hosiery Industry?
To stay informed about further developments, trends, and reports in the Hosiery Industry, consider subscribing to industry newsletters, following relevant companies and organizations, or regularly checking reputable industry news sources and publications.
Methodology
Step 1 - Identification of Relevant Samples Size from Population Database


Step 2 - Approaches for Defining Global Market Size (Value, Volume* & Price*)

Note*: In applicable scenarios
Step 3 - Data Sources
Primary Research
- Web Analytics
- Survey Reports
- Research Institute
- Latest Research Reports
- Opinion Leaders
Secondary Research
- Annual Reports
- White Paper
- Latest Press Release
- Industry Association
- Paid Database
- Investor Presentations

Step 4 - Data Triangulation
Involves using different sources of information in order to increase the validity of a study
These sources are likely to be stakeholders in a program - participants, other researchers, program staff, other community members, and so on.
Then we put all data in single framework & apply various statistical tools to find out the dynamic on the market.
During the analysis stage, feedback from the stakeholder groups would be compared to determine areas of agreement as well as areas of divergence