

Key Insights
The inflatable hot tub market is experiencing robust growth, driven by increasing consumer demand for convenient, affordable, and space-saving at-home relaxation solutions. The market's appeal stems from its versatility, allowing for placement in various settings like backyards, patios, or even indoors (depending on the model and setup). This ease of use and portability contrasts sharply with traditional hot tubs, which require significant installation and space commitment. Furthermore, the rising popularity of staycations and the focus on wellness and self-care are contributing significantly to the market's expansion. Technological advancements in materials science, resulting in more durable and energy-efficient inflatable hot tubs, are also fueling growth. Competition is relatively high, with established players like Coleman and Intex alongside newer entrants vying for market share. Pricing strategies, marketing campaigns highlighting convenience and therapeutic benefits, and the introduction of innovative features like built-in filtration systems and LED lighting are key competitive differentiators. While challenges exist, such as concerns about durability and lifespan compared to traditional models, the overall market trajectory remains positive, driven by ongoing product innovation and consumer preference for accessible luxury.
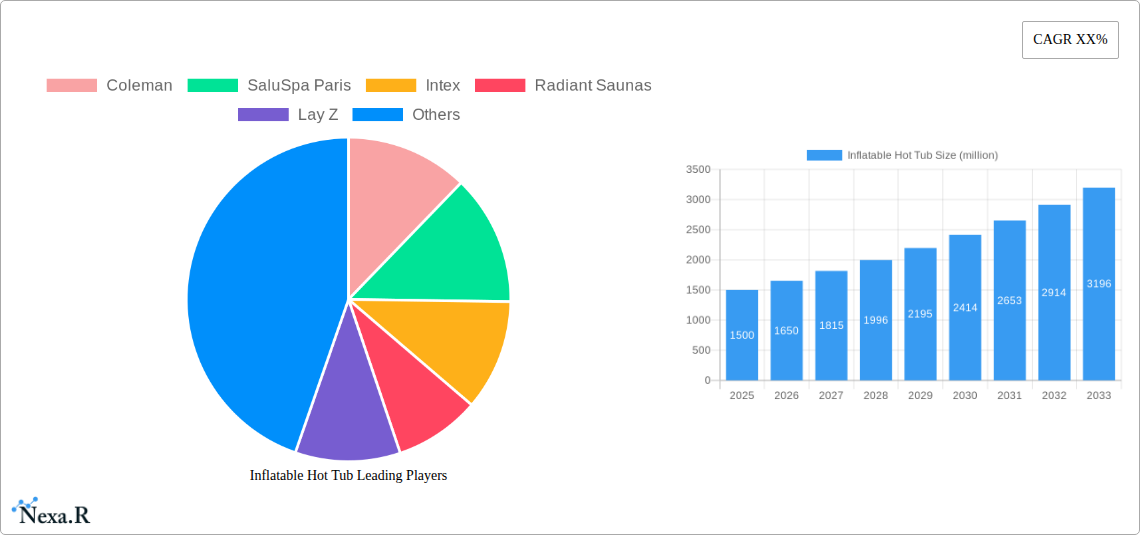
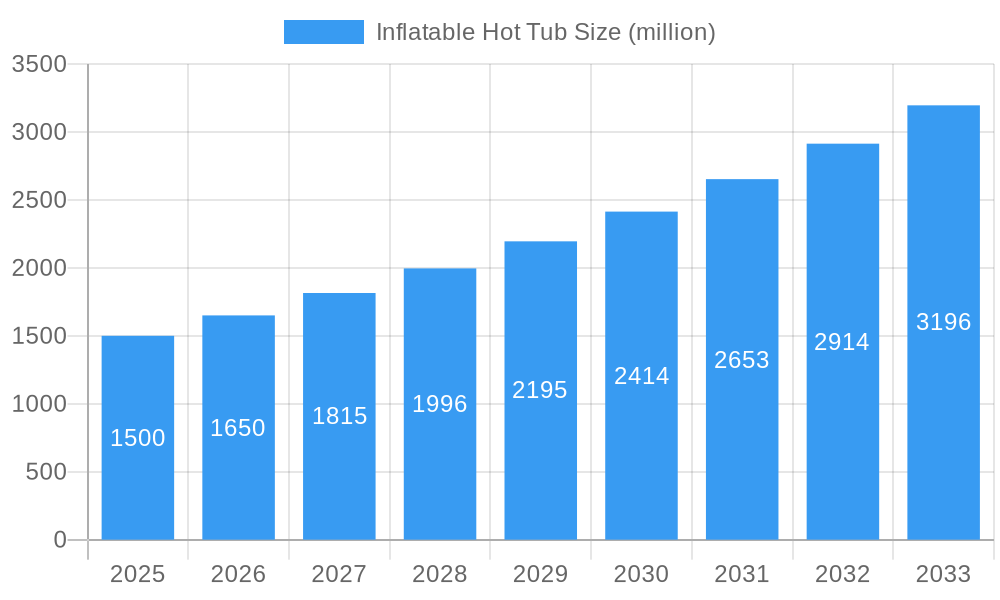
Inflatable Hot Tub Market Size (In Billion)
Despite the positive growth outlook, certain restraints impact market expansion. These include potential concerns about energy consumption, particularly for larger models, and the need for regular maintenance to ensure hygiene and optimal functionality. Seasonal variations in demand, with peaks during colder months, pose another challenge to manufacturers. However, the development of more energy-efficient designs and improved materials is mitigating some of these limitations. Further, innovative marketing strategies focusing on the year-round benefits of hydrotherapy, alongside strategic partnerships with retailers, are actively addressing seasonal fluctuations. The segmentation of the market based on capacity, features (e.g., built-in pumps, heating systems, jets), and price points creates further opportunities for specialized product development and targeted marketing initiatives, fostering continued market expansion and innovation.
Inflatable Hot Tub Company Market Share
Inflatable Hot Tub Market Report: 2019-2033
This comprehensive report provides a detailed analysis of the global inflatable hot tub market, offering invaluable insights for industry professionals, investors, and strategic decision-makers. The study period covers 2019-2033, with a base year of 2025 and a forecast period of 2025-2033. The report leverages extensive primary and secondary research to deliver a granular understanding of market dynamics, growth trends, and future opportunities. The market is segmented by product type, distribution channel, and end-user, providing a comprehensive view of the landscape. Key players analyzed include Coleman, SaluSpa Paris, Intex, Radiant Saunas, and Lay-Z-Spa. The report is valued at xx million units.
Inflatable Hot Tub Market Dynamics & Structure
The inflatable hot tub market is characterized by moderate concentration, with several key players competing for market share. Technological innovation, primarily focusing on energy efficiency, improved materials, and enhanced user experience, is a major driver. Regulatory frameworks concerning energy consumption and safety standards play a significant role. Competitive substitutes include traditional hot tubs and other forms of hydrotherapy. The end-user demographic is broad, encompassing families, individuals, and hospitality businesses. M&A activity in the sector has been relatively low in recent years, with xx deals recorded between 2019 and 2024.
- Market Concentration: Moderately fragmented, with top 5 players holding approximately xx% market share in 2024.
- Technological Innovation: Focus on energy-efficient heating systems, durable materials (e.g., reinforced PVC), and smart features (app integration, automated controls).
- Regulatory Framework: Compliance with safety and energy efficiency standards varies across regions, impacting product design and pricing.
- Competitive Substitutes: Traditional hot tubs, spa resorts, and other relaxation methods present competition.
- End-User Demographics: Primarily families, individuals seeking relaxation, and commercial establishments (hotels, resorts).
- M&A Trends: Low M&A activity observed, with xx deals recorded between 2019 and 2024. Increased consolidation is expected in the forecast period.
Inflatable Hot Tub Growth Trends & Insights
The global inflatable hot tub market experienced significant growth during the historical period (2019-2024), driven by increasing disposable incomes, a growing preference for at-home relaxation, and the introduction of innovative product features. The market size reached xx million units in 2024, exhibiting a CAGR of xx% during the historical period. Technological disruptions, such as the introduction of energy-efficient heating systems and smart app integrations, have fueled adoption rates. Consumer behavior shifts towards prioritizing wellness and self-care have further boosted market demand. The market is expected to continue its growth trajectory, with a projected CAGR of xx% from 2025 to 2033.
Dominant Regions, Countries, or Segments in Inflatable Hot Tub
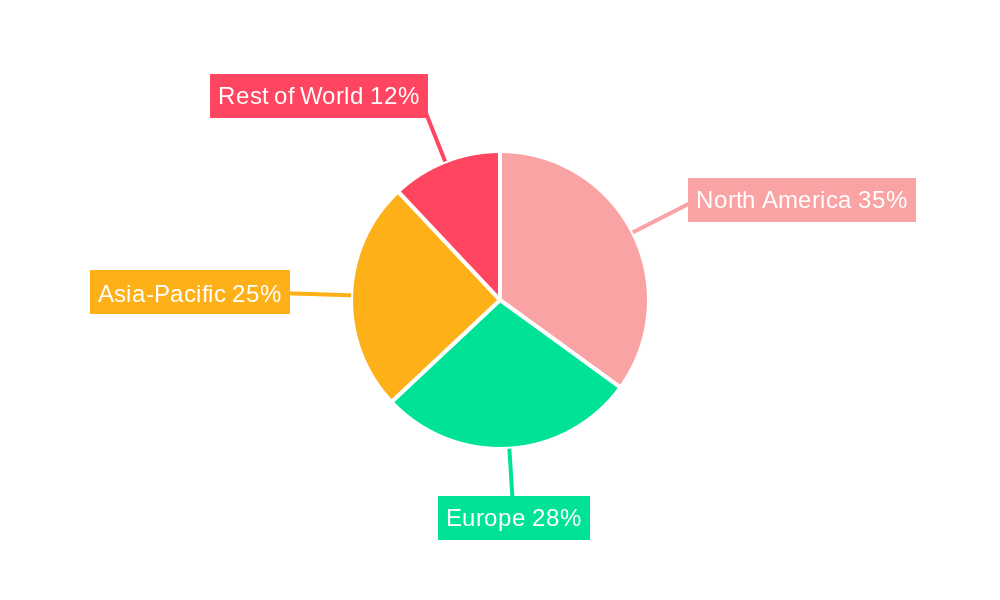
North America currently dominates the inflatable hot tub market, followed by Europe. This dominance is attributed to factors like high disposable incomes, established retail infrastructure, and a strong consumer preference for home leisure activities. The United States specifically exhibits high market penetration due to its large population and established online and offline distribution channels. Other key regions like Asia-Pacific are experiencing rapid growth driven by rising middle-class incomes and increased awareness of wellness products.
- North America: High market penetration driven by strong consumer demand and established distribution networks.
- Europe: Significant market size due to high disposable incomes and preference for home-based recreation.
- Asia-Pacific: Rapid growth driven by increasing disposable incomes and rising demand for wellness products.
- Key Drivers: Increased disposable income, rising interest in at-home wellness, robust online retail channels.
Inflatable Hot Tub Product Landscape
Inflatable hot tubs offer a range of features, from basic models with simple heating systems to advanced units with built-in filtration, massage jets, and app-controlled functionalities. Recent product innovations focus on improved energy efficiency, enhanced durability, and user-friendly designs. Unique selling propositions include portability, ease of setup, and cost-effectiveness compared to traditional hot tubs. Technological advancements include the integration of smart technology and the use of eco-friendly materials.
Key Drivers, Barriers & Challenges in Inflatable Hot Tub
Key Drivers: Rising disposable incomes, increasing awareness of wellness and relaxation, and the convenience and affordability of inflatable hot tubs are driving market growth. Technological advancements, including improved energy efficiency and smart features, further enhance their appeal.
Key Challenges: Fluctuations in raw material prices, supply chain disruptions, and intense competition among manufacturers pose significant challenges to market growth. Additionally, stringent safety and environmental regulations can increase production costs and limit market expansion. Competition from traditional hot tubs and other relaxation alternatives also impact market share.
Emerging Opportunities in Inflatable Hot Tub
Untapped markets in developing economies, particularly in Asia and Latin America, offer significant growth potential. Innovative applications, such as integrating inflatable hot tubs into backyard landscaping designs or offering rental services, are emerging trends. Evolving consumer preferences towards sustainable and eco-friendly products present opportunities for manufacturers to develop environmentally conscious inflatable hot tubs.
Growth Accelerators in the Inflatable Hot Tub Industry
Technological breakthroughs in heating technology and materials science can lead to significant improvements in energy efficiency and durability. Strategic partnerships with distributors and retailers enhance market reach and visibility. Market expansion strategies targeting emerging economies and innovative product diversification can drive further growth.
Notable Milestones in Inflatable Hot Tub Sector
- 2020: Intex launched a new line of energy-efficient inflatable hot tubs.
- 2021: Coleman introduced a smart app integration for its inflatable hot tub models.
- 2022: Lay-Z-Spa expanded its distribution network into several new markets.
- 2023: A significant increase in demand was noted due to Covid-19 Pandemic recovery.
- 2024: New regulations related to energy consumption were implemented in some regions.
In-Depth Inflatable Hot Tub Market Outlook
The inflatable hot tub market is poised for continued growth, driven by ongoing technological innovations, increasing consumer demand for at-home wellness experiences, and expansion into new markets. Strategic opportunities exist in developing sustainable products, expanding into untapped markets, and forging strategic partnerships to enhance market penetration. The market's long-term potential remains positive, with significant room for expansion and innovation.
Inflatable Hot Tub Segmentation
-
1. Application
- 1.1. Home Use
- 1.2. Commercial Use
-
2. Types
- 2.1. Max Capacity:6-person
- 2.2. Max Capacity:4-person
- 2.3. Other
Inflatable Hot Tub Segmentation By Geography
-
1. North America
- 1.1. United States
- 1.2. Canada
- 1.3. Mexico
-
2. South America
- 2.1. Brazil
- 2.2. Argentina
- 2.3. Rest of South America
-
3. Europe
- 3.1. United Kingdom
- 3.2. Germany
- 3.3. France
- 3.4. Italy
- 3.5. Spain
- 3.6. Russia
- 3.7. Benelux
- 3.8. Nordics
- 3.9. Rest of Europe
-
4. Middle East & Africa
- 4.1. Turkey
- 4.2. Israel
- 4.3. GCC
- 4.4. North Africa
- 4.5. South Africa
- 4.6. Rest of Middle East & Africa
-
5. Asia Pacific
- 5.1. China
- 5.2. India
- 5.3. Japan
- 5.4. South Korea
- 5.5. ASEAN
- 5.6. Oceania
- 5.7. Rest of Asia Pacific
Inflatable Hot Tub Regional Market Share
Geographic Coverage of Inflatable Hot Tub
Inflatable Hot Tub REPORT HIGHLIGHTS
| Aspects | Details |
|---|---|
| Study Period | 2020-2034 |
| Base Year | 2025 |
| Estimated Year | 2026 |
| Forecast Period | 2026-2034 |
| Historical Period | 2020-2025 |
| Growth Rate | CAGR of 3.94% from 2020-2034 |
| Segmentation |
|
Table of Contents
- 1. Introduction
- 1.1. Research Scope
- 1.2. Market Segmentation
- 1.3. Research Methodology
- 1.4. Definitions and Assumptions
- 2. Executive Summary
- 2.1. Introduction
- 3. Market Dynamics
- 3.1. Introduction
- 3.2. Market Drivers
- 3.3. Market Restrains
- 3.4. Market Trends
- 4. Market Factor Analysis
- 4.1. Porters Five Forces
- 4.2. Supply/Value Chain
- 4.3. PESTEL analysis
- 4.4. Market Entropy
- 4.5. Patent/Trademark Analysis
- 5. Global Inflatable Hot Tub Analysis, Insights and Forecast, 2020-2032
- 5.1. Market Analysis, Insights and Forecast - by Application
- 5.1.1. Home Use
- 5.1.2. Commercial Use
- 5.2. Market Analysis, Insights and Forecast - by Types
- 5.2.1. Max Capacity:6-person
- 5.2.2. Max Capacity:4-person
- 5.2.3. Other
- 5.3. Market Analysis, Insights and Forecast - by Region
- 5.3.1. North America
- 5.3.2. South America
- 5.3.3. Europe
- 5.3.4. Middle East & Africa
- 5.3.5. Asia Pacific
- 5.1. Market Analysis, Insights and Forecast - by Application
- 6. North America Inflatable Hot Tub Analysis, Insights and Forecast, 2020-2032
- 6.1. Market Analysis, Insights and Forecast - by Application
- 6.1.1. Home Use
- 6.1.2. Commercial Use
- 6.2. Market Analysis, Insights and Forecast - by Types
- 6.2.1. Max Capacity:6-person
- 6.2.2. Max Capacity:4-person
- 6.2.3. Other
- 6.1. Market Analysis, Insights and Forecast - by Application
- 7. South America Inflatable Hot Tub Analysis, Insights and Forecast, 2020-2032
- 7.1. Market Analysis, Insights and Forecast - by Application
- 7.1.1. Home Use
- 7.1.2. Commercial Use
- 7.2. Market Analysis, Insights and Forecast - by Types
- 7.2.1. Max Capacity:6-person
- 7.2.2. Max Capacity:4-person
- 7.2.3. Other
- 7.1. Market Analysis, Insights and Forecast - by Application
- 8. Europe Inflatable Hot Tub Analysis, Insights and Forecast, 2020-2032
- 8.1. Market Analysis, Insights and Forecast - by Application
- 8.1.1. Home Use
- 8.1.2. Commercial Use
- 8.2. Market Analysis, Insights and Forecast - by Types
- 8.2.1. Max Capacity:6-person
- 8.2.2. Max Capacity:4-person
- 8.2.3. Other
- 8.1. Market Analysis, Insights and Forecast - by Application
- 9. Middle East & Africa Inflatable Hot Tub Analysis, Insights and Forecast, 2020-2032
- 9.1. Market Analysis, Insights and Forecast - by Application
- 9.1.1. Home Use
- 9.1.2. Commercial Use
- 9.2. Market Analysis, Insights and Forecast - by Types
- 9.2.1. Max Capacity:6-person
- 9.2.2. Max Capacity:4-person
- 9.2.3. Other
- 9.1. Market Analysis, Insights and Forecast - by Application
- 10. Asia Pacific Inflatable Hot Tub Analysis, Insights and Forecast, 2020-2032
- 10.1. Market Analysis, Insights and Forecast - by Application
- 10.1.1. Home Use
- 10.1.2. Commercial Use
- 10.2. Market Analysis, Insights and Forecast - by Types
- 10.2.1. Max Capacity:6-person
- 10.2.2. Max Capacity:4-person
- 10.2.3. Other
- 10.1. Market Analysis, Insights and Forecast - by Application
- 11. Competitive Analysis
- 11.1. Global Market Share Analysis 2025
- 11.2. Company Profiles
- 11.2.1 Coleman
- 11.2.1.1. Overview
- 11.2.1.2. Products
- 11.2.1.3. SWOT Analysis
- 11.2.1.4. Recent Developments
- 11.2.1.5. Financials (Based on Availability)
- 11.2.2 SaluSpa Paris
- 11.2.2.1. Overview
- 11.2.2.2. Products
- 11.2.2.3. SWOT Analysis
- 11.2.2.4. Recent Developments
- 11.2.2.5. Financials (Based on Availability)
- 11.2.3 Intex
- 11.2.3.1. Overview
- 11.2.3.2. Products
- 11.2.3.3. SWOT Analysis
- 11.2.3.4. Recent Developments
- 11.2.3.5. Financials (Based on Availability)
- 11.2.4 Radiant Saunas
- 11.2.4.1. Overview
- 11.2.4.2. Products
- 11.2.4.3. SWOT Analysis
- 11.2.4.4. Recent Developments
- 11.2.4.5. Financials (Based on Availability)
- 11.2.5 Lay Z
- 11.2.5.1. Overview
- 11.2.5.2. Products
- 11.2.5.3. SWOT Analysis
- 11.2.5.4. Recent Developments
- 11.2.5.5. Financials (Based on Availability)
- 11.2.1 Coleman
List of Figures
- Figure 1: Global Inflatable Hot Tub Revenue Breakdown (undefined, %) by Region 2025 & 2033
- Figure 2: Global Inflatable Hot Tub Volume Breakdown (K, %) by Region 2025 & 2033
- Figure 3: North America Inflatable Hot Tub Revenue (undefined), by Application 2025 & 2033
- Figure 4: North America Inflatable Hot Tub Volume (K), by Application 2025 & 2033
- Figure 5: North America Inflatable Hot Tub Revenue Share (%), by Application 2025 & 2033
- Figure 6: North America Inflatable Hot Tub Volume Share (%), by Application 2025 & 2033
- Figure 7: North America Inflatable Hot Tub Revenue (undefined), by Types 2025 & 2033
- Figure 8: North America Inflatable Hot Tub Volume (K), by Types 2025 & 2033
- Figure 9: North America Inflatable Hot Tub Revenue Share (%), by Types 2025 & 2033
- Figure 10: North America Inflatable Hot Tub Volume Share (%), by Types 2025 & 2033
- Figure 11: North America Inflatable Hot Tub Revenue (undefined), by Country 2025 & 2033
- Figure 12: North America Inflatable Hot Tub Volume (K), by Country 2025 & 2033
- Figure 13: North America Inflatable Hot Tub Revenue Share (%), by Country 2025 & 2033
- Figure 14: North America Inflatable Hot Tub Volume Share (%), by Country 2025 & 2033
- Figure 15: South America Inflatable Hot Tub Revenue (undefined), by Application 2025 & 2033
- Figure 16: South America Inflatable Hot Tub Volume (K), by Application 2025 & 2033
- Figure 17: South America Inflatable Hot Tub Revenue Share (%), by Application 2025 & 2033
- Figure 18: South America Inflatable Hot Tub Volume Share (%), by Application 2025 & 2033
- Figure 19: South America Inflatable Hot Tub Revenue (undefined), by Types 2025 & 2033
- Figure 20: South America Inflatable Hot Tub Volume (K), by Types 2025 & 2033
- Figure 21: South America Inflatable Hot Tub Revenue Share (%), by Types 2025 & 2033
- Figure 22: South America Inflatable Hot Tub Volume Share (%), by Types 2025 & 2033
- Figure 23: South America Inflatable Hot Tub Revenue (undefined), by Country 2025 & 2033
- Figure 24: South America Inflatable Hot Tub Volume (K), by Country 2025 & 2033
- Figure 25: South America Inflatable Hot Tub Revenue Share (%), by Country 2025 & 2033
- Figure 26: South America Inflatable Hot Tub Volume Share (%), by Country 2025 & 2033
- Figure 27: Europe Inflatable Hot Tub Revenue (undefined), by Application 2025 & 2033
- Figure 28: Europe Inflatable Hot Tub Volume (K), by Application 2025 & 2033
- Figure 29: Europe Inflatable Hot Tub Revenue Share (%), by Application 2025 & 2033
- Figure 30: Europe Inflatable Hot Tub Volume Share (%), by Application 2025 & 2033
- Figure 31: Europe Inflatable Hot Tub Revenue (undefined), by Types 2025 & 2033
- Figure 32: Europe Inflatable Hot Tub Volume (K), by Types 2025 & 2033
- Figure 33: Europe Inflatable Hot Tub Revenue Share (%), by Types 2025 & 2033
- Figure 34: Europe Inflatable Hot Tub Volume Share (%), by Types 2025 & 2033
- Figure 35: Europe Inflatable Hot Tub Revenue (undefined), by Country 2025 & 2033
- Figure 36: Europe Inflatable Hot Tub Volume (K), by Country 2025 & 2033
- Figure 37: Europe Inflatable Hot Tub Revenue Share (%), by Country 2025 & 2033
- Figure 38: Europe Inflatable Hot Tub Volume Share (%), by Country 2025 & 2033
- Figure 39: Middle East & Africa Inflatable Hot Tub Revenue (undefined), by Application 2025 & 2033
- Figure 40: Middle East & Africa Inflatable Hot Tub Volume (K), by Application 2025 & 2033
- Figure 41: Middle East & Africa Inflatable Hot Tub Revenue Share (%), by Application 2025 & 2033
- Figure 42: Middle East & Africa Inflatable Hot Tub Volume Share (%), by Application 2025 & 2033
- Figure 43: Middle East & Africa Inflatable Hot Tub Revenue (undefined), by Types 2025 & 2033
- Figure 44: Middle East & Africa Inflatable Hot Tub Volume (K), by Types 2025 & 2033
- Figure 45: Middle East & Africa Inflatable Hot Tub Revenue Share (%), by Types 2025 & 2033
- Figure 46: Middle East & Africa Inflatable Hot Tub Volume Share (%), by Types 2025 & 2033
- Figure 47: Middle East & Africa Inflatable Hot Tub Revenue (undefined), by Country 2025 & 2033
- Figure 48: Middle East & Africa Inflatable Hot Tub Volume (K), by Country 2025 & 2033
- Figure 49: Middle East & Africa Inflatable Hot Tub Revenue Share (%), by Country 2025 & 2033
- Figure 50: Middle East & Africa Inflatable Hot Tub Volume Share (%), by Country 2025 & 2033
- Figure 51: Asia Pacific Inflatable Hot Tub Revenue (undefined), by Application 2025 & 2033
- Figure 52: Asia Pacific Inflatable Hot Tub Volume (K), by Application 2025 & 2033
- Figure 53: Asia Pacific Inflatable Hot Tub Revenue Share (%), by Application 2025 & 2033
- Figure 54: Asia Pacific Inflatable Hot Tub Volume Share (%), by Application 2025 & 2033
- Figure 55: Asia Pacific Inflatable Hot Tub Revenue (undefined), by Types 2025 & 2033
- Figure 56: Asia Pacific Inflatable Hot Tub Volume (K), by Types 2025 & 2033
- Figure 57: Asia Pacific Inflatable Hot Tub Revenue Share (%), by Types 2025 & 2033
- Figure 58: Asia Pacific Inflatable Hot Tub Volume Share (%), by Types 2025 & 2033
- Figure 59: Asia Pacific Inflatable Hot Tub Revenue (undefined), by Country 2025 & 2033
- Figure 60: Asia Pacific Inflatable Hot Tub Volume (K), by Country 2025 & 2033
- Figure 61: Asia Pacific Inflatable Hot Tub Revenue Share (%), by Country 2025 & 2033
- Figure 62: Asia Pacific Inflatable Hot Tub Volume Share (%), by Country 2025 & 2033
List of Tables
- Table 1: Global Inflatable Hot Tub Revenue undefined Forecast, by Application 2020 & 2033
- Table 2: Global Inflatable Hot Tub Volume K Forecast, by Application 2020 & 2033
- Table 3: Global Inflatable Hot Tub Revenue undefined Forecast, by Types 2020 & 2033
- Table 4: Global Inflatable Hot Tub Volume K Forecast, by Types 2020 & 2033
- Table 5: Global Inflatable Hot Tub Revenue undefined Forecast, by Region 2020 & 2033
- Table 6: Global Inflatable Hot Tub Volume K Forecast, by Region 2020 & 2033
- Table 7: Global Inflatable Hot Tub Revenue undefined Forecast, by Application 2020 & 2033
- Table 8: Global Inflatable Hot Tub Volume K Forecast, by Application 2020 & 2033
- Table 9: Global Inflatable Hot Tub Revenue undefined Forecast, by Types 2020 & 2033
- Table 10: Global Inflatable Hot Tub Volume K Forecast, by Types 2020 & 2033
- Table 11: Global Inflatable Hot Tub Revenue undefined Forecast, by Country 2020 & 2033
- Table 12: Global Inflatable Hot Tub Volume K Forecast, by Country 2020 & 2033
- Table 13: United States Inflatable Hot Tub Revenue (undefined) Forecast, by Application 2020 & 2033
- Table 14: United States Inflatable Hot Tub Volume (K) Forecast, by Application 2020 & 2033
- Table 15: Canada Inflatable Hot Tub Revenue (undefined) Forecast, by Application 2020 & 2033
- Table 16: Canada Inflatable Hot Tub Volume (K) Forecast, by Application 2020 & 2033
- Table 17: Mexico Inflatable Hot Tub Revenue (undefined) Forecast, by Application 2020 & 2033
- Table 18: Mexico Inflatable Hot Tub Volume (K) Forecast, by Application 2020 & 2033
- Table 19: Global Inflatable Hot Tub Revenue undefined Forecast, by Application 2020 & 2033
- Table 20: Global Inflatable Hot Tub Volume K Forecast, by Application 2020 & 2033
- Table 21: Global Inflatable Hot Tub Revenue undefined Forecast, by Types 2020 & 2033
- Table 22: Global Inflatable Hot Tub Volume K Forecast, by Types 2020 & 2033
- Table 23: Global Inflatable Hot Tub Revenue undefined Forecast, by Country 2020 & 2033
- Table 24: Global Inflatable Hot Tub Volume K Forecast, by Country 2020 & 2033
- Table 25: Brazil Inflatable Hot Tub Revenue (undefined) Forecast, by Application 2020 & 2033
- Table 26: Brazil Inflatable Hot Tub Volume (K) Forecast, by Application 2020 & 2033
- Table 27: Argentina Inflatable Hot Tub Revenue (undefined) Forecast, by Application 2020 & 2033
- Table 28: Argentina Inflatable Hot Tub Volume (K) Forecast, by Application 2020 & 2033
- Table 29: Rest of South America Inflatable Hot Tub Revenue (undefined) Forecast, by Application 2020 & 2033
- Table 30: Rest of South America Inflatable Hot Tub Volume (K) Forecast, by Application 2020 & 2033
- Table 31: Global Inflatable Hot Tub Revenue undefined Forecast, by Application 2020 & 2033
- Table 32: Global Inflatable Hot Tub Volume K Forecast, by Application 2020 & 2033
- Table 33: Global Inflatable Hot Tub Revenue undefined Forecast, by Types 2020 & 2033
- Table 34: Global Inflatable Hot Tub Volume K Forecast, by Types 2020 & 2033
- Table 35: Global Inflatable Hot Tub Revenue undefined Forecast, by Country 2020 & 2033
- Table 36: Global Inflatable Hot Tub Volume K Forecast, by Country 2020 & 2033
- Table 37: United Kingdom Inflatable Hot Tub Revenue (undefined) Forecast, by Application 2020 & 2033
- Table 38: United Kingdom Inflatable Hot Tub Volume (K) Forecast, by Application 2020 & 2033
- Table 39: Germany Inflatable Hot Tub Revenue (undefined) Forecast, by Application 2020 & 2033
- Table 40: Germany Inflatable Hot Tub Volume (K) Forecast, by Application 2020 & 2033
- Table 41: France Inflatable Hot Tub Revenue (undefined) Forecast, by Application 2020 & 2033
- Table 42: France Inflatable Hot Tub Volume (K) Forecast, by Application 2020 & 2033
- Table 43: Italy Inflatable Hot Tub Revenue (undefined) Forecast, by Application 2020 & 2033
- Table 44: Italy Inflatable Hot Tub Volume (K) Forecast, by Application 2020 & 2033
- Table 45: Spain Inflatable Hot Tub Revenue (undefined) Forecast, by Application 2020 & 2033
- Table 46: Spain Inflatable Hot Tub Volume (K) Forecast, by Application 2020 & 2033
- Table 47: Russia Inflatable Hot Tub Revenue (undefined) Forecast, by Application 2020 & 2033
- Table 48: Russia Inflatable Hot Tub Volume (K) Forecast, by Application 2020 & 2033
- Table 49: Benelux Inflatable Hot Tub Revenue (undefined) Forecast, by Application 2020 & 2033
- Table 50: Benelux Inflatable Hot Tub Volume (K) Forecast, by Application 2020 & 2033
- Table 51: Nordics Inflatable Hot Tub Revenue (undefined) Forecast, by Application 2020 & 2033
- Table 52: Nordics Inflatable Hot Tub Volume (K) Forecast, by Application 2020 & 2033
- Table 53: Rest of Europe Inflatable Hot Tub Revenue (undefined) Forecast, by Application 2020 & 2033
- Table 54: Rest of Europe Inflatable Hot Tub Volume (K) Forecast, by Application 2020 & 2033
- Table 55: Global Inflatable Hot Tub Revenue undefined Forecast, by Application 2020 & 2033
- Table 56: Global Inflatable Hot Tub Volume K Forecast, by Application 2020 & 2033
- Table 57: Global Inflatable Hot Tub Revenue undefined Forecast, by Types 2020 & 2033
- Table 58: Global Inflatable Hot Tub Volume K Forecast, by Types 2020 & 2033
- Table 59: Global Inflatable Hot Tub Revenue undefined Forecast, by Country 2020 & 2033
- Table 60: Global Inflatable Hot Tub Volume K Forecast, by Country 2020 & 2033
- Table 61: Turkey Inflatable Hot Tub Revenue (undefined) Forecast, by Application 2020 & 2033
- Table 62: Turkey Inflatable Hot Tub Volume (K) Forecast, by Application 2020 & 2033
- Table 63: Israel Inflatable Hot Tub Revenue (undefined) Forecast, by Application 2020 & 2033
- Table 64: Israel Inflatable Hot Tub Volume (K) Forecast, by Application 2020 & 2033
- Table 65: GCC Inflatable Hot Tub Revenue (undefined) Forecast, by Application 2020 & 2033
- Table 66: GCC Inflatable Hot Tub Volume (K) Forecast, by Application 2020 & 2033
- Table 67: North Africa Inflatable Hot Tub Revenue (undefined) Forecast, by Application 2020 & 2033
- Table 68: North Africa Inflatable Hot Tub Volume (K) Forecast, by Application 2020 & 2033
- Table 69: South Africa Inflatable Hot Tub Revenue (undefined) Forecast, by Application 2020 & 2033
- Table 70: South Africa Inflatable Hot Tub Volume (K) Forecast, by Application 2020 & 2033
- Table 71: Rest of Middle East & Africa Inflatable Hot Tub Revenue (undefined) Forecast, by Application 2020 & 2033
- Table 72: Rest of Middle East & Africa Inflatable Hot Tub Volume (K) Forecast, by Application 2020 & 2033
- Table 73: Global Inflatable Hot Tub Revenue undefined Forecast, by Application 2020 & 2033
- Table 74: Global Inflatable Hot Tub Volume K Forecast, by Application 2020 & 2033
- Table 75: Global Inflatable Hot Tub Revenue undefined Forecast, by Types 2020 & 2033
- Table 76: Global Inflatable Hot Tub Volume K Forecast, by Types 2020 & 2033
- Table 77: Global Inflatable Hot Tub Revenue undefined Forecast, by Country 2020 & 2033
- Table 78: Global Inflatable Hot Tub Volume K Forecast, by Country 2020 & 2033
- Table 79: China Inflatable Hot Tub Revenue (undefined) Forecast, by Application 2020 & 2033
- Table 80: China Inflatable Hot Tub Volume (K) Forecast, by Application 2020 & 2033
- Table 81: India Inflatable Hot Tub Revenue (undefined) Forecast, by Application 2020 & 2033
- Table 82: India Inflatable Hot Tub Volume (K) Forecast, by Application 2020 & 2033
- Table 83: Japan Inflatable Hot Tub Revenue (undefined) Forecast, by Application 2020 & 2033
- Table 84: Japan Inflatable Hot Tub Volume (K) Forecast, by Application 2020 & 2033
- Table 85: South Korea Inflatable Hot Tub Revenue (undefined) Forecast, by Application 2020 & 2033
- Table 86: South Korea Inflatable Hot Tub Volume (K) Forecast, by Application 2020 & 2033
- Table 87: ASEAN Inflatable Hot Tub Revenue (undefined) Forecast, by Application 2020 & 2033
- Table 88: ASEAN Inflatable Hot Tub Volume (K) Forecast, by Application 2020 & 2033
- Table 89: Oceania Inflatable Hot Tub Revenue (undefined) Forecast, by Application 2020 & 2033
- Table 90: Oceania Inflatable Hot Tub Volume (K) Forecast, by Application 2020 & 2033
- Table 91: Rest of Asia Pacific Inflatable Hot Tub Revenue (undefined) Forecast, by Application 2020 & 2033
- Table 92: Rest of Asia Pacific Inflatable Hot Tub Volume (K) Forecast, by Application 2020 & 2033
Frequently Asked Questions
1. What is the projected Compound Annual Growth Rate (CAGR) of the Inflatable Hot Tub?
The projected CAGR is approximately 3.94%.
2. Which companies are prominent players in the Inflatable Hot Tub?
Key companies in the market include Coleman, SaluSpa Paris, Intex, Radiant Saunas, Lay Z.
3. What are the main segments of the Inflatable Hot Tub?
The market segments include Application, Types.
4. Can you provide details about the market size?
The market size is estimated to be USD XXX N/A as of 2022.
5. What are some drivers contributing to market growth?
N/A
6. What are the notable trends driving market growth?
N/A
7. Are there any restraints impacting market growth?
N/A
8. Can you provide examples of recent developments in the market?
N/A
9. What pricing options are available for accessing the report?
Pricing options include single-user, multi-user, and enterprise licenses priced at USD 3350.00, USD 5025.00, and USD 6700.00 respectively.
10. Is the market size provided in terms of value or volume?
The market size is provided in terms of value, measured in N/A and volume, measured in K.
11. Are there any specific market keywords associated with the report?
Yes, the market keyword associated with the report is "Inflatable Hot Tub," which aids in identifying and referencing the specific market segment covered.
12. How do I determine which pricing option suits my needs best?
The pricing options vary based on user requirements and access needs. Individual users may opt for single-user licenses, while businesses requiring broader access may choose multi-user or enterprise licenses for cost-effective access to the report.
13. Are there any additional resources or data provided in the Inflatable Hot Tub report?
While the report offers comprehensive insights, it's advisable to review the specific contents or supplementary materials provided to ascertain if additional resources or data are available.
14. How can I stay updated on further developments or reports in the Inflatable Hot Tub?
To stay informed about further developments, trends, and reports in the Inflatable Hot Tub, consider subscribing to industry newsletters, following relevant companies and organizations, or regularly checking reputable industry news sources and publications.
Methodology
Step 1 - Identification of Relevant Samples Size from Population Database


Step 2 - Approaches for Defining Global Market Size (Value, Volume* & Price*)

Note*: In applicable scenarios
Step 3 - Data Sources
Primary Research
- Web Analytics
- Survey Reports
- Research Institute
- Latest Research Reports
- Opinion Leaders
Secondary Research
- Annual Reports
- White Paper
- Latest Press Release
- Industry Association
- Paid Database
- Investor Presentations

Step 4 - Data Triangulation
Involves using different sources of information in order to increase the validity of a study
These sources are likely to be stakeholders in a program - participants, other researchers, program staff, other community members, and so on.
Then we put all data in single framework & apply various statistical tools to find out the dynamic on the market.
During the analysis stage, feedback from the stakeholder groups would be compared to determine areas of agreement as well as areas of divergence