

Key Insights
The global Jersey barrier market is projected to reach USD 186.19 million in 2025, exhibiting a robust Compound Annual Growth Rate (CAGR) of 5.16% throughout the forecast period of 2025-2033. This steady expansion is primarily driven by the escalating infrastructure development initiatives worldwide, particularly in the construction and transportation sectors. As nations prioritize the enhancement of their road networks, the demand for effective traffic management and safety solutions like Jersey barriers is set to surge. Key growth drivers include the increasing need for physical separation of traffic lanes to prevent head-on collisions, the growing adoption of precast concrete barriers for their durability and cost-effectiveness, and the implementation of stricter safety regulations in construction zones and on highways. Furthermore, the rising investment in urban development projects and smart city initiatives is also contributing to the market's upward trajectory, as these projects often involve extensive road modifications and the installation of safety barriers.
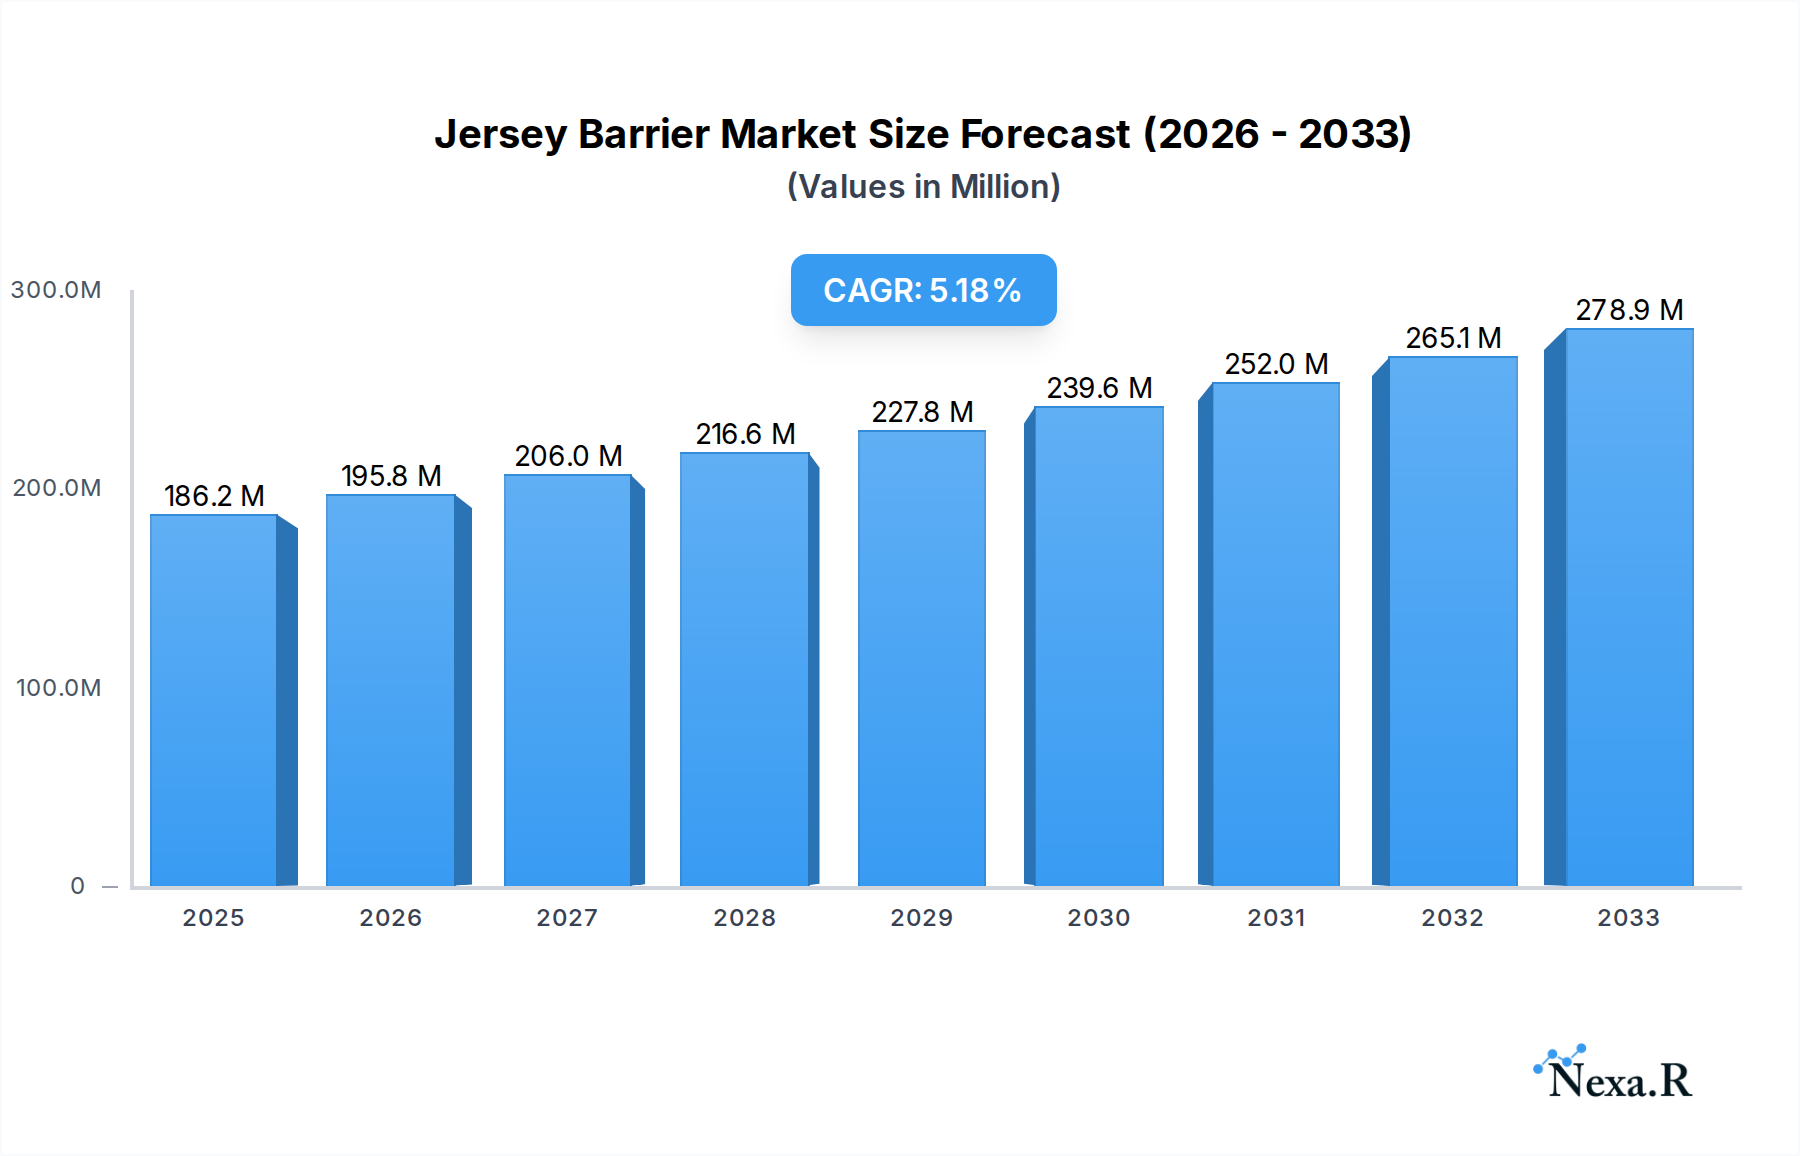
Jersey Barrier Market Size (In Million)
The market is segmented into various applications, with Construction and Transportation emerging as the dominant segments, accounting for a significant portion of the market share. Within these segments, the versatility and structural integrity offered by Plastic Material and Concrete Material barriers are driving their adoption. While cost-effectiveness and ease of installation are major advantages, the market also faces certain restraints. These include the initial capital investment required for manufacturing and the logistical challenges associated with transporting heavy barrier units. However, ongoing technological advancements in material science and manufacturing processes, aimed at producing lighter yet stronger barriers, are expected to mitigate these challenges. The market is highly competitive, with prominent players like Del Zotto Products, DELTABLOC, and Ultrablock actively engaged in innovation and strategic collaborations to expand their market presence across key regions such as North America, Europe, and Asia Pacific.

Jersey Barrier Company Market Share
Jersey Barrier Market Analysis: Trends, Opportunities, and Key Players (2019-2033)
This comprehensive report provides an in-depth analysis of the global Jersey barrier market, offering critical insights into its dynamics, growth trajectories, and future potential. Spanning the historical period from 2019 to 2024 and projecting through to 2033, with a base and estimated year of 2025, this study is an indispensable resource for stakeholders seeking to understand market evolution, identify growth accelerators, and navigate competitive landscapes. The report covers key segments including applications (Construction, Transportation, Others) and types (Plastic Material, Concrete Material, Others), detailing market share, CAGR, and projected market size in million units.
Jersey Barrier Market Dynamics & Structure
The Jersey barrier market is characterized by a moderate level of concentration, with a mix of established global players and regional specialists. Technological innovation is primarily driven by the demand for enhanced safety features, increased durability, and cost-effectiveness in barrier deployment. Regulatory frameworks, particularly those pertaining to road safety and construction standards, play a crucial role in dictating product specifications and market access. Competitive product substitutes, such as temporary fencing and other traffic control devices, present a constant challenge, necessitating continuous product development. End-user demographics are diverse, encompassing government infrastructure agencies, construction firms, event organizers, and private developers. Mergers and acquisitions (M&A) trends are observed as companies seek to expand their product portfolios, geographical reach, and technological capabilities.
- Market Concentration: Dominated by approximately 4-6 key global manufacturers, with a significant presence of medium-sized and smaller regional suppliers.
- Technological Innovation Drivers: Focus on improving impact resistance, UV stability for plastic barriers, and modular designs for faster installation and removal.
- Regulatory Frameworks: Stringent adherence to DOT (Department of Transportation) standards and international safety certifications is paramount.
- Competitive Product Substitutes: Temporary traffic control systems, concrete planters, and guardrails.
- End-User Demographics: Municipalities, highway authorities, construction companies, event management firms, and utility providers.
- M&A Trends: Acquisitions focused on companies with specialized manufacturing capabilities or established distribution networks. For instance, one significant M&A deal in 2023 involved a company with innovative plastic barrier technology acquiring a concrete barrier manufacturer to offer a broader product range, with an estimated deal value in the range of $50-75 million.
Jersey Barrier Growth Trends & Insights
The global Jersey barrier market is projected to witness robust growth from 2019 to 2033, driven by escalating infrastructure development worldwide and an increasing emphasis on public safety. The market size, valued at approximately $1,500 million in 2019, is anticipated to reach an estimated $2,800 million by 2025, exhibiting a Compound Annual Growth Rate (CAGR) of around 6.5%. This upward trajectory is expected to continue through the forecast period, reaching an estimated $4,500 million by 2033. Adoption rates are steadily increasing, particularly in developing economies undergoing significant urbanization and infrastructure upgrades. Technological disruptions are primarily focused on material science and manufacturing processes, leading to lighter, more durable, and environmentally friendly barrier options. Consumer behavior shifts indicate a growing preference for modular, easily deployable, and reusable barrier systems that offer flexibility and reduced installation costs.
The growth in the transportation segment, accounting for over 50% of the market share, is fueled by ongoing road construction, expansion projects, and maintenance activities across major economies. The construction application segment is also a significant contributor, driven by the need for site security, traffic management at construction zones, and temporary segregation of work areas. The "Others" application segment, which includes events, utilities, and temporary crowd control, is expected to witness a steady, albeit smaller, growth rate.
In terms of material types, concrete barriers continue to dominate due to their inherent strength and longevity, holding a market share of approximately 65%. However, plastic and composite barriers are gaining traction due to their lightweight nature, ease of transportation, and lower production costs, with their market share projected to grow at a CAGR of 7.8% during the forecast period. The development of advanced polymers and recycled materials is further enhancing the appeal of non-concrete alternatives.
The market penetration of Jersey barriers is currently estimated at 70% in developed nations, with significant room for expansion in emerging markets. This expansion will be supported by increased awareness of safety regulations and the cost-effectiveness of Jersey barriers compared to more permanent traffic control solutions. For example, the adoption of recycled plastic in barrier manufacturing is expected to boost sustainability initiatives and appeal to environmentally conscious infrastructure projects, contributing to market expansion in regions with stricter environmental regulations. The market is projected to grow at a CAGR of approximately 6.8% from 2019 to 2033, with the base year 2025 market size estimated at $2,800 million. The historical period 2019-2024 witnessed an average CAGR of 6.3%.
Dominant Regions, Countries, or Segments in Jersey Barrier
North America currently holds the dominant position in the global Jersey barrier market, driven by extensive infrastructure development and stringent safety regulations. The United States, in particular, accounts for a substantial portion of regional demand, with significant investments in highway expansion, repair, and maintenance projects. This dominance is further bolstered by a mature construction industry and a proactive approach to traffic management and public safety during roadworks. The market share for North America is estimated at approximately 35% of the global market.
Key Drivers for North America's Dominance:
- Extensive Infrastructure Investment: Continuous federal and state-level funding for highway and road network improvements.
- Stringent Safety Standards: Mandated use of approved safety barriers in construction zones and along high-speed roadways.
- Technological Adoption: Early adoption of advanced barrier designs and materials, including high-visibility plastic barriers.
- Economic Stability: A robust economy supports consistent demand from construction and transportation sectors.
In terms of application, the Transportation segment remains the primary growth engine, contributing an estimated 55% to the overall market value. This is directly linked to the ongoing need for traffic control and safety during road construction, expansion, and maintenance activities. The sheer scale of highway networks in North America necessitates a continuous supply of reliable and effective barrier solutions.
Key Drivers for Transportation Segment Dominance:
- Road Safety Initiatives: Government programs aimed at reducing traffic accidents and fatalities.
- Infrastructure Modernization: Projects focused on upgrading aging road infrastructure and expanding capacity.
- Event Traffic Management: Temporary barriers for managing traffic flow during major events and sports gatherings.
Within the Types of Jersey barriers, Concrete Material continues to lead due to its proven durability, weight, and ballistic resistance, holding an estimated 60% market share. However, Plastic Material barriers are experiencing rapid growth, projected to increase their market share significantly due to their portability, ease of installation, and cost-effectiveness, particularly for temporary applications. The growth potential for plastic barriers is estimated at a CAGR of 7.5% during the forecast period.
Key Drivers for Concrete Material Dominance:
- High Impact Resistance: Ideal for high-speed traffic areas where severe impacts are a concern.
- Longevity and Durability: Withstand harsh weather conditions and prolonged exposure.
- Cost-Effectiveness for Permanent Installations: Lower long-term maintenance costs compared to some alternatives.
Key Drivers for Plastic Material Growth:
- Lightweight and Portable: Easier to transport, install, and remove, reducing labor costs.
- Modular Design: Facilitates quick deployment and reconfiguration for varied site needs.
- Environmental Considerations: Increasing use of recycled plastics and lighter materials.
- Cost-Effectiveness for Temporary Use: A more economical choice for short-term projects and events.
The country of The United States is the dominant country within the North American region, representing approximately 70% of the regional market. Its vast infrastructure projects, coupled with a well-established construction industry and a strong emphasis on road safety, solidify its leading position. The market size for the United States in 2025 is estimated at $700 million.
Jersey Barrier Product Landscape
The Jersey barrier product landscape is increasingly diverse, with manufacturers focusing on enhancing performance, safety, and ease of use. Innovations in concrete formulations have led to lighter yet stronger barriers with improved durability. In the plastic segment, advancements in UV-resistant polymers and impact-absorbing designs are setting new benchmarks. Modular and interlocking systems are gaining prominence, enabling faster installation and greater flexibility on job sites. Unique selling propositions often revolve around enhanced safety features like high-visibility coatings, integrated reflective elements, and superior impact deflection capabilities. Technological advancements are also leading to smarter barriers with embedded sensors for traffic monitoring and structural integrity assessment, though widespread adoption is still nascent.
Key Drivers, Barriers & Challenges in Jersey Barrier
Key Drivers:
- Infrastructure Investment: Government initiatives and private sector spending on road, bridge, and urban development projects globally.
- Road Safety Regulations: Increasingly stringent mandates for traffic control and protection in construction zones and along roadways.
- Demand for Temporary Barriers: Growing need for flexible and easily deployable barriers for events, emergency situations, and short-term construction.
- Technological Advancements: Development of lighter, more durable, and cost-effective materials and designs.
Key Barriers & Challenges:
- High Initial Cost: While long-term benefits exist, the upfront investment for some types of Jersey barriers can be substantial.
- Supply Chain Disruptions: Potential for delays in raw material procurement and manufacturing, impacting availability and pricing, with an estimated impact of 5-10% on project timelines.
- Regulatory Variations: Differences in safety standards and approval processes across regions can create market access hurdles.
- Competition from Alternatives: The presence of other traffic control and safety solutions competing for market share.
- Environmental Concerns: While improving, the production and disposal of concrete barriers can raise environmental questions, though recycled plastic options are mitigating this.
Emerging Opportunities in Jersey Barrier
Emerging opportunities lie in the development and adoption of more sustainable barrier solutions, including those incorporating recycled materials and designed for end-of-life recyclability. The "Smart Barrier" concept, integrating sensors for real-time traffic data, structural monitoring, and even communication capabilities, presents a significant future growth avenue. Untapped markets in developing nations with burgeoning infrastructure needs offer substantial expansion potential. Furthermore, innovative applications in temporary crowd control for large-scale events and public gatherings, as well as specialized barriers for industrial safety and perimeter security, represent evolving market segments. The estimated market for smart barriers is projected to grow at a CAGR of 9.5% from 2028 to 2033.
Growth Accelerators in the Jersey Barrier Industry
Several factors are acting as growth accelerators for the Jersey barrier industry. The increasing global emphasis on infrastructure resilience and safety, spurred by a growing awareness of the economic and social costs of accidents, is a primary driver. Technological breakthroughs in material science, leading to enhanced performance characteristics and reduced production costs, are making barriers more accessible. Strategic partnerships between manufacturers and construction firms, as well as government agencies, are facilitating wider adoption and the development of customized solutions. Market expansion strategies focused on emerging economies, where infrastructure development is a national priority, will also significantly contribute to long-term growth.
Key Players Shaping the Jersey Barrier Market
- Del Zotto Products
- DELTABLOC
- Fort Miller
- Hardstaff Barriers
- Harper Precast
- Ultrablock
- HERMEQ
- JP Concrete
- Macon Precast Concrete
- Muhibah Konsortium
- Oldcastle Infrastructure
- Permatile Concrete
- Roman Stone Construction
Notable Milestones in Jersey Barrier Sector
- 2019: Introduction of enhanced UV-resistant polymers for plastic Jersey barriers, significantly improving durability in harsh climates.
- 2020: Launch of a new modular interlocking concrete barrier system, reducing installation time by an estimated 30%.
- 2021: Increased focus on sustainability with manufacturers incorporating higher percentages of recycled aggregates and plastics in barrier production.
- 2022: Development of impact-absorbing designs for plastic barriers, setting new safety benchmarks.
- 2023: Growing interest in "smart" Jersey barriers with embedded sensors for traffic monitoring and structural health assessment.
- 2024: Expansion of product lines to include specialized barriers for flood control and temporary event security.
In-Depth Jersey Barrier Market Outlook
The outlook for the Jersey barrier market remains exceptionally positive, driven by sustained global investment in infrastructure and a non-negotiable focus on safety. Growth accelerators, including advancements in material science for lighter, stronger, and more sustainable barriers, alongside the increasing adoption of modular and smart barrier technologies, will fuel market expansion. Strategic collaborations and a continued push into developing economies are expected to unlock significant new opportunities. The market is poised for continued robust growth, with an estimated market size of $4,500 million by 2033, driven by innovation, safety mandates, and infrastructure development.
Jersey Barrier Segmentation
-
1. Application
- 1.1. Construction
- 1.2. Transportation
- 1.3. Others
-
2. Types
- 2.1. Plastic Material
- 2.2. Concrete Material
- 2.3. Others
Jersey Barrier Segmentation By Geography
-
1. North America
- 1.1. United States
- 1.2. Canada
- 1.3. Mexico
-
2. South America
- 2.1. Brazil
- 2.2. Argentina
- 2.3. Rest of South America
-
3. Europe
- 3.1. United Kingdom
- 3.2. Germany
- 3.3. France
- 3.4. Italy
- 3.5. Spain
- 3.6. Russia
- 3.7. Benelux
- 3.8. Nordics
- 3.9. Rest of Europe
-
4. Middle East & Africa
- 4.1. Turkey
- 4.2. Israel
- 4.3. GCC
- 4.4. North Africa
- 4.5. South Africa
- 4.6. Rest of Middle East & Africa
-
5. Asia Pacific
- 5.1. China
- 5.2. India
- 5.3. Japan
- 5.4. South Korea
- 5.5. ASEAN
- 5.6. Oceania
- 5.7. Rest of Asia Pacific
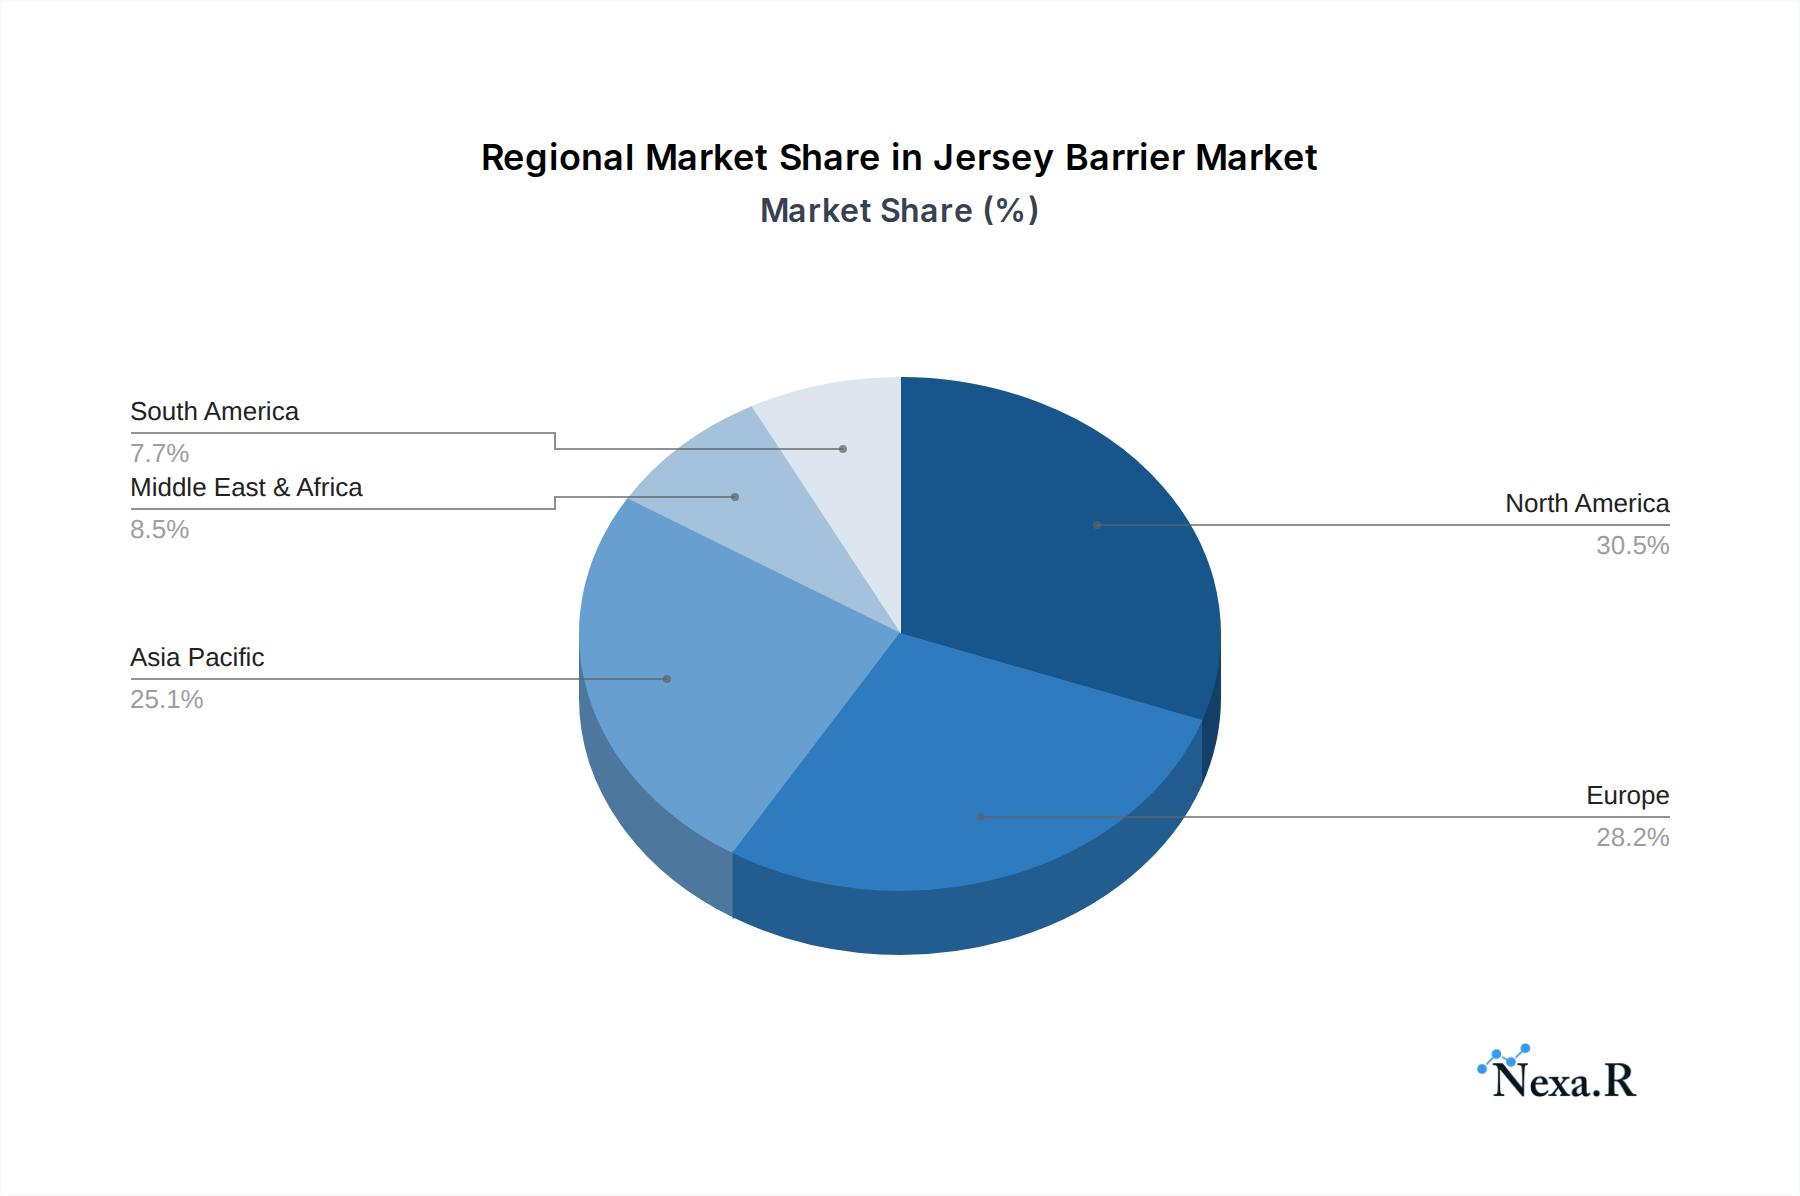
Jersey Barrier Regional Market Share
Geographic Coverage of Jersey Barrier
Jersey Barrier REPORT HIGHLIGHTS
| Aspects | Details |
|---|---|
| Study Period | 2020-2034 |
| Base Year | 2025 |
| Estimated Year | 2026 |
| Forecast Period | 2026-2034 |
| Historical Period | 2020-2025 |
| Growth Rate | CAGR of 5.16% from 2020-2034 |
| Segmentation |
|
Table of Contents
- 1. Introduction
- 1.1. Research Scope
- 1.2. Market Segmentation
- 1.3. Research Objective
- 1.4. Definitions and Assumptions
- 2. Executive Summary
- 2.1. Market Snapshot
- 3. Market Dynamics
- 3.1. Market Drivers
- 3.2. Market Restrains
- 3.3. Market Trends
- 3.4. Market Opportunities
- 4. Market Factor Analysis
- 4.1. Porters Five Forces
- 4.1.1. Bargaining Power of Suppliers
- 4.1.2. Bargaining Power of Buyers
- 4.1.3. Threat of New Entrants
- 4.1.4. Threat of Substitutes
- 4.1.5. Competitive Rivalry
- 4.2. PESTEL analysis
- 4.3. BCG Analysis
- 4.3.1. Stars (High Growth, High Market Share)
- 4.3.2. Cash Cows (Low Growth, High Market Share)
- 4.3.3. Question Mark (High Growth, Low Market Share)
- 4.3.4. Dogs (Low Growth, Low Market Share)
- 4.4. Ansoff Matrix Analysis
- 4.5. Supply Chain Analysis
- 4.6. Regulatory Landscape
- 4.7. Current Market Potential and Opportunity Assessment (TAM–SAM–SOM Framework)
- 4.8. NRP Analyst Note
- 4.1. Porters Five Forces
- 5. Market Analysis, Insights and Forecast 2021-2033
- 5.1. Market Analysis, Insights and Forecast - by Application
- 5.1.1. Construction
- 5.1.2. Transportation
- 5.1.3. Others
- 5.2. Market Analysis, Insights and Forecast - by Types
- 5.2.1. Plastic Material
- 5.2.2. Concrete Material
- 5.2.3. Others
- 5.3. Market Analysis, Insights and Forecast - by Region
- 5.3.1. North America
- 5.3.2. South America
- 5.3.3. Europe
- 5.3.4. Middle East & Africa
- 5.3.5. Asia Pacific
- 5.1. Market Analysis, Insights and Forecast - by Application
- 6. Global Jersey Barrier Analysis, Insights and Forecast, 2021-2033
- 6.1. Market Analysis, Insights and Forecast - by Application
- 6.1.1. Construction
- 6.1.2. Transportation
- 6.1.3. Others
- 6.2. Market Analysis, Insights and Forecast - by Types
- 6.2.1. Plastic Material
- 6.2.2. Concrete Material
- 6.2.3. Others
- 6.1. Market Analysis, Insights and Forecast - by Application
- 7. North America Jersey Barrier Analysis, Insights and Forecast, 2020-2032
- 7.1. Market Analysis, Insights and Forecast - by Application
- 7.1.1. Construction
- 7.1.2. Transportation
- 7.1.3. Others
- 7.2. Market Analysis, Insights and Forecast - by Types
- 7.2.1. Plastic Material
- 7.2.2. Concrete Material
- 7.2.3. Others
- 7.1. Market Analysis, Insights and Forecast - by Application
- 8. South America Jersey Barrier Analysis, Insights and Forecast, 2020-2032
- 8.1. Market Analysis, Insights and Forecast - by Application
- 8.1.1. Construction
- 8.1.2. Transportation
- 8.1.3. Others
- 8.2. Market Analysis, Insights and Forecast - by Types
- 8.2.1. Plastic Material
- 8.2.2. Concrete Material
- 8.2.3. Others
- 8.1. Market Analysis, Insights and Forecast - by Application
- 9. Europe Jersey Barrier Analysis, Insights and Forecast, 2020-2032
- 9.1. Market Analysis, Insights and Forecast - by Application
- 9.1.1. Construction
- 9.1.2. Transportation
- 9.1.3. Others
- 9.2. Market Analysis, Insights and Forecast - by Types
- 9.2.1. Plastic Material
- 9.2.2. Concrete Material
- 9.2.3. Others
- 9.1. Market Analysis, Insights and Forecast - by Application
- 10. Middle East & Africa Jersey Barrier Analysis, Insights and Forecast, 2020-2032
- 10.1. Market Analysis, Insights and Forecast - by Application
- 10.1.1. Construction
- 10.1.2. Transportation
- 10.1.3. Others
- 10.2. Market Analysis, Insights and Forecast - by Types
- 10.2.1. Plastic Material
- 10.2.2. Concrete Material
- 10.2.3. Others
- 10.1. Market Analysis, Insights and Forecast - by Application
- 11. Asia Pacific Jersey Barrier Analysis, Insights and Forecast, 2020-2032
- 11.1. Market Analysis, Insights and Forecast - by Application
- 11.1.1. Construction
- 11.1.2. Transportation
- 11.1.3. Others
- 11.2. Market Analysis, Insights and Forecast - by Types
- 11.2.1. Plastic Material
- 11.2.2. Concrete Material
- 11.2.3. Others
- 11.1. Market Analysis, Insights and Forecast - by Application
- 12. Competitive Analysis
- 12.1. Company Profiles
- 12.1.1 Del Zotto Products
- 12.1.1.1. Company Overview
- 12.1.1.2. Products
- 12.1.1.3. Company Financials
- 12.1.1.4. SWOT Analysis
- 12.1.2 DELTABLOC
- 12.1.2.1. Company Overview
- 12.1.2.2. Products
- 12.1.2.3. Company Financials
- 12.1.2.4. SWOT Analysis
- 12.1.3 Fort Miller
- 12.1.3.1. Company Overview
- 12.1.3.2. Products
- 12.1.3.3. Company Financials
- 12.1.3.4. SWOT Analysis
- 12.1.4 Hardstaff Barriers
- 12.1.4.1. Company Overview
- 12.1.4.2. Products
- 12.1.4.3. Company Financials
- 12.1.4.4. SWOT Analysis
- 12.1.5 Harper Precast
- 12.1.5.1. Company Overview
- 12.1.5.2. Products
- 12.1.5.3. Company Financials
- 12.1.5.4. SWOT Analysis
- 12.1.6 Ultrablock
- 12.1.6.1. Company Overview
- 12.1.6.2. Products
- 12.1.6.3. Company Financials
- 12.1.6.4. SWOT Analysis
- 12.1.7 HERMEQ
- 12.1.7.1. Company Overview
- 12.1.7.2. Products
- 12.1.7.3. Company Financials
- 12.1.7.4. SWOT Analysis
- 12.1.8 JP Concrete
- 12.1.8.1. Company Overview
- 12.1.8.2. Products
- 12.1.8.3. Company Financials
- 12.1.8.4. SWOT Analysis
- 12.1.9 Macon Precast Concrete
- 12.1.9.1. Company Overview
- 12.1.9.2. Products
- 12.1.9.3. Company Financials
- 12.1.9.4. SWOT Analysis
- 12.1.10 Muhibah Konsortium
- 12.1.10.1. Company Overview
- 12.1.10.2. Products
- 12.1.10.3. Company Financials
- 12.1.10.4. SWOT Analysis
- 12.1.11 Oldcastle Infrastructure
- 12.1.11.1. Company Overview
- 12.1.11.2. Products
- 12.1.11.3. Company Financials
- 12.1.11.4. SWOT Analysis
- 12.1.12 Permatile Concrete
- 12.1.12.1. Company Overview
- 12.1.12.2. Products
- 12.1.12.3. Company Financials
- 12.1.12.4. SWOT Analysis
- 12.1.13 Roman Stone Construction
- 12.1.13.1. Company Overview
- 12.1.13.2. Products
- 12.1.13.3. Company Financials
- 12.1.13.4. SWOT Analysis
- 12.1.1 Del Zotto Products
- 12.2. Market Entropy
- 12.2.1 Company's Key Areas Served
- 12.2.2 Recent Developments
- 12.3. Company Market Share Analysis 2025
- 12.3.1 Top 5 Companies Market Share Analysis
- 12.3.2 Top 3 Companies Market Share Analysis
- 12.4. List of Potential Customers
- 13. Research Methodology
List of Figures
- Figure 1: Global Jersey Barrier Revenue Breakdown (undefined, %) by Region 2025 & 2033
- Figure 2: Global Jersey Barrier Volume Breakdown (K, %) by Region 2025 & 2033
- Figure 3: North America Jersey Barrier Revenue (undefined), by Application 2025 & 2033
- Figure 4: North America Jersey Barrier Volume (K), by Application 2025 & 2033
- Figure 5: North America Jersey Barrier Revenue Share (%), by Application 2025 & 2033
- Figure 6: North America Jersey Barrier Volume Share (%), by Application 2025 & 2033
- Figure 7: North America Jersey Barrier Revenue (undefined), by Types 2025 & 2033
- Figure 8: North America Jersey Barrier Volume (K), by Types 2025 & 2033
- Figure 9: North America Jersey Barrier Revenue Share (%), by Types 2025 & 2033
- Figure 10: North America Jersey Barrier Volume Share (%), by Types 2025 & 2033
- Figure 11: North America Jersey Barrier Revenue (undefined), by Country 2025 & 2033
- Figure 12: North America Jersey Barrier Volume (K), by Country 2025 & 2033
- Figure 13: North America Jersey Barrier Revenue Share (%), by Country 2025 & 2033
- Figure 14: North America Jersey Barrier Volume Share (%), by Country 2025 & 2033
- Figure 15: South America Jersey Barrier Revenue (undefined), by Application 2025 & 2033
- Figure 16: South America Jersey Barrier Volume (K), by Application 2025 & 2033
- Figure 17: South America Jersey Barrier Revenue Share (%), by Application 2025 & 2033
- Figure 18: South America Jersey Barrier Volume Share (%), by Application 2025 & 2033
- Figure 19: South America Jersey Barrier Revenue (undefined), by Types 2025 & 2033
- Figure 20: South America Jersey Barrier Volume (K), by Types 2025 & 2033
- Figure 21: South America Jersey Barrier Revenue Share (%), by Types 2025 & 2033
- Figure 22: South America Jersey Barrier Volume Share (%), by Types 2025 & 2033
- Figure 23: South America Jersey Barrier Revenue (undefined), by Country 2025 & 2033
- Figure 24: South America Jersey Barrier Volume (K), by Country 2025 & 2033
- Figure 25: South America Jersey Barrier Revenue Share (%), by Country 2025 & 2033
- Figure 26: South America Jersey Barrier Volume Share (%), by Country 2025 & 2033
- Figure 27: Europe Jersey Barrier Revenue (undefined), by Application 2025 & 2033
- Figure 28: Europe Jersey Barrier Volume (K), by Application 2025 & 2033
- Figure 29: Europe Jersey Barrier Revenue Share (%), by Application 2025 & 2033
- Figure 30: Europe Jersey Barrier Volume Share (%), by Application 2025 & 2033
- Figure 31: Europe Jersey Barrier Revenue (undefined), by Types 2025 & 2033
- Figure 32: Europe Jersey Barrier Volume (K), by Types 2025 & 2033
- Figure 33: Europe Jersey Barrier Revenue Share (%), by Types 2025 & 2033
- Figure 34: Europe Jersey Barrier Volume Share (%), by Types 2025 & 2033
- Figure 35: Europe Jersey Barrier Revenue (undefined), by Country 2025 & 2033
- Figure 36: Europe Jersey Barrier Volume (K), by Country 2025 & 2033
- Figure 37: Europe Jersey Barrier Revenue Share (%), by Country 2025 & 2033
- Figure 38: Europe Jersey Barrier Volume Share (%), by Country 2025 & 2033
- Figure 39: Middle East & Africa Jersey Barrier Revenue (undefined), by Application 2025 & 2033
- Figure 40: Middle East & Africa Jersey Barrier Volume (K), by Application 2025 & 2033
- Figure 41: Middle East & Africa Jersey Barrier Revenue Share (%), by Application 2025 & 2033
- Figure 42: Middle East & Africa Jersey Barrier Volume Share (%), by Application 2025 & 2033
- Figure 43: Middle East & Africa Jersey Barrier Revenue (undefined), by Types 2025 & 2033
- Figure 44: Middle East & Africa Jersey Barrier Volume (K), by Types 2025 & 2033
- Figure 45: Middle East & Africa Jersey Barrier Revenue Share (%), by Types 2025 & 2033
- Figure 46: Middle East & Africa Jersey Barrier Volume Share (%), by Types 2025 & 2033
- Figure 47: Middle East & Africa Jersey Barrier Revenue (undefined), by Country 2025 & 2033
- Figure 48: Middle East & Africa Jersey Barrier Volume (K), by Country 2025 & 2033
- Figure 49: Middle East & Africa Jersey Barrier Revenue Share (%), by Country 2025 & 2033
- Figure 50: Middle East & Africa Jersey Barrier Volume Share (%), by Country 2025 & 2033
- Figure 51: Asia Pacific Jersey Barrier Revenue (undefined), by Application 2025 & 2033
- Figure 52: Asia Pacific Jersey Barrier Volume (K), by Application 2025 & 2033
- Figure 53: Asia Pacific Jersey Barrier Revenue Share (%), by Application 2025 & 2033
- Figure 54: Asia Pacific Jersey Barrier Volume Share (%), by Application 2025 & 2033
- Figure 55: Asia Pacific Jersey Barrier Revenue (undefined), by Types 2025 & 2033
- Figure 56: Asia Pacific Jersey Barrier Volume (K), by Types 2025 & 2033
- Figure 57: Asia Pacific Jersey Barrier Revenue Share (%), by Types 2025 & 2033
- Figure 58: Asia Pacific Jersey Barrier Volume Share (%), by Types 2025 & 2033
- Figure 59: Asia Pacific Jersey Barrier Revenue (undefined), by Country 2025 & 2033
- Figure 60: Asia Pacific Jersey Barrier Volume (K), by Country 2025 & 2033
- Figure 61: Asia Pacific Jersey Barrier Revenue Share (%), by Country 2025 & 2033
- Figure 62: Asia Pacific Jersey Barrier Volume Share (%), by Country 2025 & 2033
List of Tables
- Table 1: Global Jersey Barrier Revenue undefined Forecast, by Application 2020 & 2033
- Table 2: Global Jersey Barrier Volume K Forecast, by Application 2020 & 2033
- Table 3: Global Jersey Barrier Revenue undefined Forecast, by Types 2020 & 2033
- Table 4: Global Jersey Barrier Volume K Forecast, by Types 2020 & 2033
- Table 5: Global Jersey Barrier Revenue undefined Forecast, by Region 2020 & 2033
- Table 6: Global Jersey Barrier Volume K Forecast, by Region 2020 & 2033
- Table 7: Global Jersey Barrier Revenue undefined Forecast, by Application 2020 & 2033
- Table 8: Global Jersey Barrier Volume K Forecast, by Application 2020 & 2033
- Table 9: Global Jersey Barrier Revenue undefined Forecast, by Types 2020 & 2033
- Table 10: Global Jersey Barrier Volume K Forecast, by Types 2020 & 2033
- Table 11: Global Jersey Barrier Revenue undefined Forecast, by Country 2020 & 2033
- Table 12: Global Jersey Barrier Volume K Forecast, by Country 2020 & 2033
- Table 13: United States Jersey Barrier Revenue (undefined) Forecast, by Application 2020 & 2033
- Table 14: United States Jersey Barrier Volume (K) Forecast, by Application 2020 & 2033
- Table 15: Canada Jersey Barrier Revenue (undefined) Forecast, by Application 2020 & 2033
- Table 16: Canada Jersey Barrier Volume (K) Forecast, by Application 2020 & 2033
- Table 17: Mexico Jersey Barrier Revenue (undefined) Forecast, by Application 2020 & 2033
- Table 18: Mexico Jersey Barrier Volume (K) Forecast, by Application 2020 & 2033
- Table 19: Global Jersey Barrier Revenue undefined Forecast, by Application 2020 & 2033
- Table 20: Global Jersey Barrier Volume K Forecast, by Application 2020 & 2033
- Table 21: Global Jersey Barrier Revenue undefined Forecast, by Types 2020 & 2033
- Table 22: Global Jersey Barrier Volume K Forecast, by Types 2020 & 2033
- Table 23: Global Jersey Barrier Revenue undefined Forecast, by Country 2020 & 2033
- Table 24: Global Jersey Barrier Volume K Forecast, by Country 2020 & 2033
- Table 25: Brazil Jersey Barrier Revenue (undefined) Forecast, by Application 2020 & 2033
- Table 26: Brazil Jersey Barrier Volume (K) Forecast, by Application 2020 & 2033
- Table 27: Argentina Jersey Barrier Revenue (undefined) Forecast, by Application 2020 & 2033
- Table 28: Argentina Jersey Barrier Volume (K) Forecast, by Application 2020 & 2033
- Table 29: Rest of South America Jersey Barrier Revenue (undefined) Forecast, by Application 2020 & 2033
- Table 30: Rest of South America Jersey Barrier Volume (K) Forecast, by Application 2020 & 2033
- Table 31: Global Jersey Barrier Revenue undefined Forecast, by Application 2020 & 2033
- Table 32: Global Jersey Barrier Volume K Forecast, by Application 2020 & 2033
- Table 33: Global Jersey Barrier Revenue undefined Forecast, by Types 2020 & 2033
- Table 34: Global Jersey Barrier Volume K Forecast, by Types 2020 & 2033
- Table 35: Global Jersey Barrier Revenue undefined Forecast, by Country 2020 & 2033
- Table 36: Global Jersey Barrier Volume K Forecast, by Country 2020 & 2033
- Table 37: United Kingdom Jersey Barrier Revenue (undefined) Forecast, by Application 2020 & 2033
- Table 38: United Kingdom Jersey Barrier Volume (K) Forecast, by Application 2020 & 2033
- Table 39: Germany Jersey Barrier Revenue (undefined) Forecast, by Application 2020 & 2033
- Table 40: Germany Jersey Barrier Volume (K) Forecast, by Application 2020 & 2033
- Table 41: France Jersey Barrier Revenue (undefined) Forecast, by Application 2020 & 2033
- Table 42: France Jersey Barrier Volume (K) Forecast, by Application 2020 & 2033
- Table 43: Italy Jersey Barrier Revenue (undefined) Forecast, by Application 2020 & 2033
- Table 44: Italy Jersey Barrier Volume (K) Forecast, by Application 2020 & 2033
- Table 45: Spain Jersey Barrier Revenue (undefined) Forecast, by Application 2020 & 2033
- Table 46: Spain Jersey Barrier Volume (K) Forecast, by Application 2020 & 2033
- Table 47: Russia Jersey Barrier Revenue (undefined) Forecast, by Application 2020 & 2033
- Table 48: Russia Jersey Barrier Volume (K) Forecast, by Application 2020 & 2033
- Table 49: Benelux Jersey Barrier Revenue (undefined) Forecast, by Application 2020 & 2033
- Table 50: Benelux Jersey Barrier Volume (K) Forecast, by Application 2020 & 2033
- Table 51: Nordics Jersey Barrier Revenue (undefined) Forecast, by Application 2020 & 2033
- Table 52: Nordics Jersey Barrier Volume (K) Forecast, by Application 2020 & 2033
- Table 53: Rest of Europe Jersey Barrier Revenue (undefined) Forecast, by Application 2020 & 2033
- Table 54: Rest of Europe Jersey Barrier Volume (K) Forecast, by Application 2020 & 2033
- Table 55: Global Jersey Barrier Revenue undefined Forecast, by Application 2020 & 2033
- Table 56: Global Jersey Barrier Volume K Forecast, by Application 2020 & 2033
- Table 57: Global Jersey Barrier Revenue undefined Forecast, by Types 2020 & 2033
- Table 58: Global Jersey Barrier Volume K Forecast, by Types 2020 & 2033
- Table 59: Global Jersey Barrier Revenue undefined Forecast, by Country 2020 & 2033
- Table 60: Global Jersey Barrier Volume K Forecast, by Country 2020 & 2033
- Table 61: Turkey Jersey Barrier Revenue (undefined) Forecast, by Application 2020 & 2033
- Table 62: Turkey Jersey Barrier Volume (K) Forecast, by Application 2020 & 2033
- Table 63: Israel Jersey Barrier Revenue (undefined) Forecast, by Application 2020 & 2033
- Table 64: Israel Jersey Barrier Volume (K) Forecast, by Application 2020 & 2033
- Table 65: GCC Jersey Barrier Revenue (undefined) Forecast, by Application 2020 & 2033
- Table 66: GCC Jersey Barrier Volume (K) Forecast, by Application 2020 & 2033
- Table 67: North Africa Jersey Barrier Revenue (undefined) Forecast, by Application 2020 & 2033
- Table 68: North Africa Jersey Barrier Volume (K) Forecast, by Application 2020 & 2033
- Table 69: South Africa Jersey Barrier Revenue (undefined) Forecast, by Application 2020 & 2033
- Table 70: South Africa Jersey Barrier Volume (K) Forecast, by Application 2020 & 2033
- Table 71: Rest of Middle East & Africa Jersey Barrier Revenue (undefined) Forecast, by Application 2020 & 2033
- Table 72: Rest of Middle East & Africa Jersey Barrier Volume (K) Forecast, by Application 2020 & 2033
- Table 73: Global Jersey Barrier Revenue undefined Forecast, by Application 2020 & 2033
- Table 74: Global Jersey Barrier Volume K Forecast, by Application 2020 & 2033
- Table 75: Global Jersey Barrier Revenue undefined Forecast, by Types 2020 & 2033
- Table 76: Global Jersey Barrier Volume K Forecast, by Types 2020 & 2033
- Table 77: Global Jersey Barrier Revenue undefined Forecast, by Country 2020 & 2033
- Table 78: Global Jersey Barrier Volume K Forecast, by Country 2020 & 2033
- Table 79: China Jersey Barrier Revenue (undefined) Forecast, by Application 2020 & 2033
- Table 80: China Jersey Barrier Volume (K) Forecast, by Application 2020 & 2033
- Table 81: India Jersey Barrier Revenue (undefined) Forecast, by Application 2020 & 2033
- Table 82: India Jersey Barrier Volume (K) Forecast, by Application 2020 & 2033
- Table 83: Japan Jersey Barrier Revenue (undefined) Forecast, by Application 2020 & 2033
- Table 84: Japan Jersey Barrier Volume (K) Forecast, by Application 2020 & 2033
- Table 85: South Korea Jersey Barrier Revenue (undefined) Forecast, by Application 2020 & 2033
- Table 86: South Korea Jersey Barrier Volume (K) Forecast, by Application 2020 & 2033
- Table 87: ASEAN Jersey Barrier Revenue (undefined) Forecast, by Application 2020 & 2033
- Table 88: ASEAN Jersey Barrier Volume (K) Forecast, by Application 2020 & 2033
- Table 89: Oceania Jersey Barrier Revenue (undefined) Forecast, by Application 2020 & 2033
- Table 90: Oceania Jersey Barrier Volume (K) Forecast, by Application 2020 & 2033
- Table 91: Rest of Asia Pacific Jersey Barrier Revenue (undefined) Forecast, by Application 2020 & 2033
- Table 92: Rest of Asia Pacific Jersey Barrier Volume (K) Forecast, by Application 2020 & 2033
Frequently Asked Questions
1. What is the projected Compound Annual Growth Rate (CAGR) of the Jersey Barrier?
The projected CAGR is approximately 5.16%.
2. Which companies are prominent players in the Jersey Barrier?
Key companies in the market include Del Zotto Products, DELTABLOC, Fort Miller, Hardstaff Barriers, Harper Precast, Ultrablock, HERMEQ, JP Concrete, Macon Precast Concrete, Muhibah Konsortium, Oldcastle Infrastructure, Permatile Concrete, Roman Stone Construction.
3. What are the main segments of the Jersey Barrier?
The market segments include Application, Types.
4. Can you provide details about the market size?
The market size is estimated to be USD XXX N/A as of 2022.
5. What are some drivers contributing to market growth?
N/A
6. What are the notable trends driving market growth?
N/A
7. Are there any restraints impacting market growth?
N/A
8. Can you provide examples of recent developments in the market?
N/A
9. What pricing options are available for accessing the report?
Pricing options include single-user, multi-user, and enterprise licenses priced at USD 3950.00, USD 5925.00, and USD 7900.00 respectively.
10. Is the market size provided in terms of value or volume?
The market size is provided in terms of value, measured in N/A and volume, measured in K.
11. Are there any specific market keywords associated with the report?
Yes, the market keyword associated with the report is "Jersey Barrier," which aids in identifying and referencing the specific market segment covered.
12. How do I determine which pricing option suits my needs best?
The pricing options vary based on user requirements and access needs. Individual users may opt for single-user licenses, while businesses requiring broader access may choose multi-user or enterprise licenses for cost-effective access to the report.
13. Are there any additional resources or data provided in the Jersey Barrier report?
While the report offers comprehensive insights, it's advisable to review the specific contents or supplementary materials provided to ascertain if additional resources or data are available.
14. How can I stay updated on further developments or reports in the Jersey Barrier?
To stay informed about further developments, trends, and reports in the Jersey Barrier, consider subscribing to industry newsletters, following relevant companies and organizations, or regularly checking reputable industry news sources and publications.
Methodology
Step 1 - Identification of Relevant Samples Size from Population Database


Step 2 - Approaches for Defining Global Market Size (Value, Volume* & Price*)

Note*: In applicable scenarios
Step 3 - Data Sources
Primary Research
- Web Analytics
- Survey Reports
- Research Institute
- Latest Research Reports
- Opinion Leaders
Secondary Research
- Annual Reports
- White Paper
- Latest Press Release
- Industry Association
- Paid Database
- Investor Presentations

Step 4 - Data Triangulation
Involves using different sources of information in order to increase the validity of a study
These sources are likely to be stakeholders in a program - participants, other researchers, program staff, other community members, and so on.
Then we put all data in single framework & apply various statistical tools to find out the dynamic on the market.
During the analysis stage, feedback from the stakeholder groups would be compared to determine areas of agreement as well as areas of divergence