

Key Insights
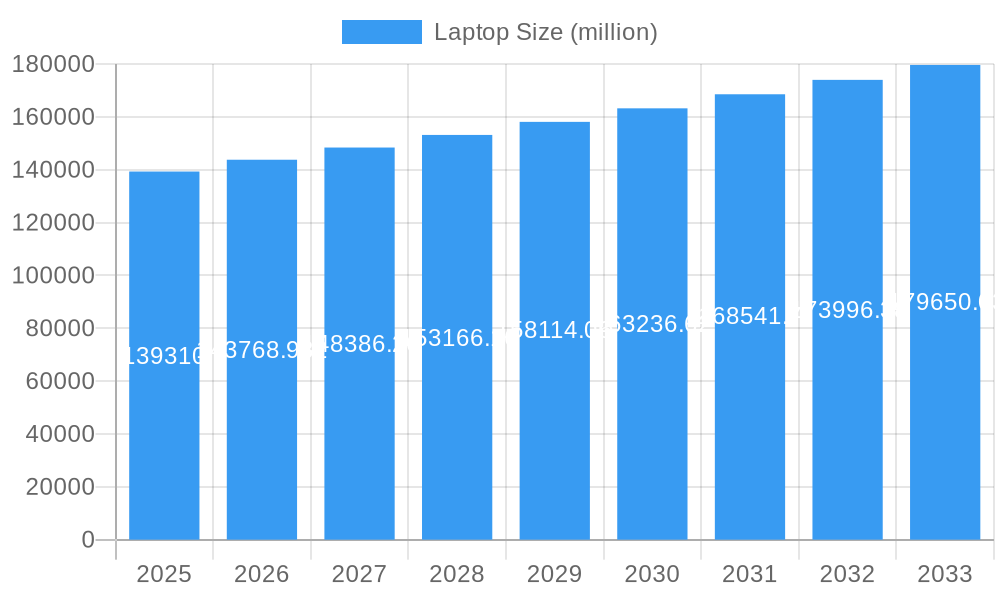
The global laptop market, valued at $139.31 billion in 2025, is projected to experience steady growth, with a compound annual growth rate (CAGR) of 3.2% from 2025 to 2033. This sustained expansion is driven by several key factors. The increasing prevalence of remote work and online learning has significantly boosted demand for laptops across various demographics. Technological advancements, such as the introduction of lighter, more powerful processors and improved battery life, are also contributing to market growth. Furthermore, the rising affordability of laptops, especially in developing economies, is expanding the market's reach. Competitive pricing strategies from major players like Lenovo, HP, Dell, Apple, ASUS, Acer, Microsoft, MSI, Razer, and Samsung fuel this accessibility. However, market growth may be tempered by factors such as the saturation of developed markets and the increasing popularity of alternative devices like tablets for certain use cases. Market segmentation based on factors like screen size, processor type, operating system, and target consumer (e.g., students, professionals, gamers) will continue to shape future growth patterns. The historical period (2019-2024) likely saw fluctuations influenced by global events like the pandemic, initially causing a surge in demand followed by a period of stabilization.
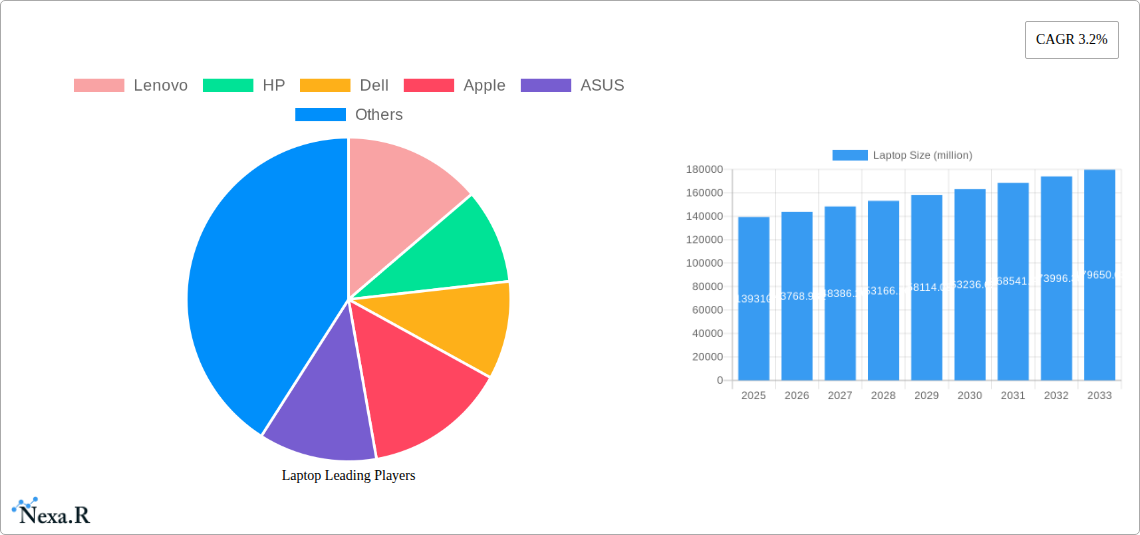
Laptop Market Size (In Billion)
The forecast period (2025-2033) suggests a gradual but consistent increase in market value. Continued innovation in areas such as foldable displays, improved connectivity (5G), and enhanced security features will likely be critical in driving future sales. Regional variations in growth rates are expected, with developing economies potentially exhibiting faster growth than mature markets. Understanding consumer preferences across different regions and adapting product offerings accordingly will be crucial for manufacturers seeking to capitalize on this growth. The competitive landscape will remain intensely competitive, necessitating continuous product development, strategic partnerships, and effective marketing strategies to maintain market share.
Laptop Company Market Share
Laptop Market Report: 2019-2033 - A Comprehensive Analysis
This in-depth report provides a comprehensive analysis of the global laptop market, encompassing historical data (2019-2024), current estimates (2025), and future forecasts (2025-2033). We delve into market dynamics, growth trends, key players (including Lenovo, HP, Dell, Apple, ASUS, Acer, Microsoft, Micro-Star International, Razer, and Samsung), and emerging opportunities within the broader personal computer (parent market) and mobile computing (child market) segments. This report is crucial for industry professionals, investors, and strategists seeking to understand and capitalize on the evolving laptop landscape. The market size is projected in million units.
Laptop Market Dynamics & Structure
The global laptop market, valued at xx million units in 2024, exhibits a moderately concentrated structure with key players holding significant market share. Lenovo, HP, and Dell consistently dominate, though Apple and ASUS maintain strong positions in premium and gaming segments respectively. Technological innovation, particularly in processing power, display technology, and battery life, are key drivers. Stringent regulatory frameworks regarding e-waste and energy efficiency impact manufacturing and product lifecycles. Tablets and 2-in-1 devices pose competitive substitution, while the growing adoption of cloud computing influences end-user preferences. M&A activity has been relatively moderate in recent years, with a focus on strategic acquisitions to expand product lines or geographical reach.
- Market Concentration: High, with top 5 players holding over 60% market share in 2024.
- Innovation Drivers: Advanced processors, improved displays (OLED, mini-LED), enhanced battery technology, AI integration.
- Regulatory Landscape: E-waste management regulations, energy efficiency standards (e.g., Energy Star).
- Competitive Substitutes: Tablets, 2-in-1 devices, cloud-based computing solutions.
- End-User Demographics: Students, professionals, gamers, creative professionals.
- M&A Activity: xx major deals between 2019 and 2024, focused primarily on component suppliers and software integration.
Laptop Growth Trends & Insights
The global laptop market experienced a period of fluctuating growth between 2019 and 2024, influenced by factors like the COVID-19 pandemic and global economic conditions. The market rebounded strongly in 2021 and 2022 due to increased remote work and education. Adoption rates have increased significantly in developing economies, driven by improved affordability and increased internet penetration. Technological disruptions, such as the widespread adoption of 5G connectivity and advancements in AI-powered features, are reshaping consumer preferences. Consumers increasingly prioritize portability, battery life, and performance, leading to shifts in design and component choices.
- Market Size Evolution: xx million units in 2019 to xx million units in 2024, with a projected xx million units in 2025.
- CAGR (2019-2024): xx%
- Market Penetration: xx% in developed economies, xx% in developing economies in 2024.
- Technological Disruptions: 5G integration, advanced processors (e.g., Apple Silicon, AMD Ryzen), AI-powered features.
- Consumer Behavior Shifts: Preference for lightweight, high-performance laptops with longer battery life.
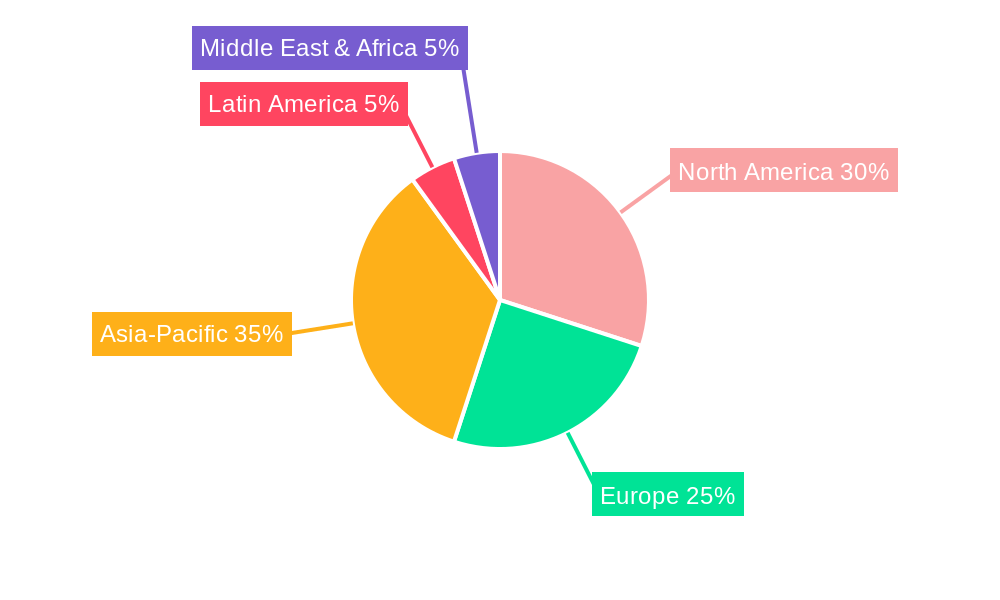
Dominant Regions, Countries, or Segments in Laptop
North America and Western Europe remain dominant regions, fueled by high per capita income and strong demand for premium laptops. However, Asia-Pacific is experiencing the fastest growth, driven by expanding middle classes, rising disposable incomes, and increasing digitalization. Within segments, the gaming laptop market showcases robust growth, reflecting the rising popularity of esports and gaming culture. Business laptops maintain significant demand, driven by increasing remote work adoption and enterprise IT investments.
- Key Growth Drivers (Asia-Pacific): Rising disposable incomes, expanding middle class, increased internet penetration, government initiatives promoting digitalization.
- Dominance Factors (North America): High per capita income, early adoption of new technologies, strong demand for premium laptops.
- Market Share: North America (xx%), Western Europe (xx%), Asia-Pacific (xx%) in 2024.
- Growth Potential: Asia-Pacific shows the highest projected growth rate (xx%) in the forecast period.
Laptop Product Landscape
The laptop product landscape is characterized by a diverse range of options catering to varied needs and budgets. From ultra-thin and lightweight designs ideal for portability to powerful gaming laptops featuring high-end graphics cards and advanced cooling systems, manufacturers continuously innovate to enhance performance, battery life, and user experience. Unique selling propositions often revolve around display quality, processing power, build materials, and innovative features like touchscreens, stylus support, and advanced biometrics.
Key Drivers, Barriers & Challenges in Laptop
Key Drivers: The increasing adoption of remote work and online education, coupled with the ongoing demand for portable computing devices, has significantly boosted the market. Technological advancements, especially in processing power and display technologies, fuel innovation and consumer demand. Government initiatives aimed at digitalization in developing economies also contribute to market growth.
Key Challenges: Supply chain disruptions, particularly regarding component sourcing, remain a major concern impacting production and pricing. Intense competition among established players and the emergence of new entrants put pressure on profit margins. Environmental regulations related to e-waste and energy efficiency necessitate significant investments in sustainable manufacturing practices.
Emerging Opportunities in Laptop
The rising popularity of foldable laptops and dual-screen devices presents a significant opportunity. Growth in specialized markets, such as education and healthcare, creates demand for ruggedized and purpose-built laptops. The increasing integration of AI and machine learning features opens avenues for enhanced productivity and user experiences.
Growth Accelerators in the Laptop Industry
Technological breakthroughs in areas like AI, advanced display technology, and improved battery life will continuously drive innovation and market growth. Strategic partnerships between hardware manufacturers and software developers will create seamless and optimized user experiences. Market expansion into untapped regions and segments, like developing economies and specialized professional sectors, will offer significant growth potential.
Notable Milestones in Laptop Sector
- 2020: Widespread adoption of laptops due to COVID-19 lockdowns.
- 2021: Launch of Apple Silicon Macs, marking a significant shift in processor technology.
- 2022: Increased focus on sustainability and eco-friendly laptop designs.
- 2023: Growing adoption of foldable and dual-screen laptops.
In-Depth Laptop Market Outlook
The global laptop market is poised for sustained growth over the forecast period (2025-2033), driven by technological innovation, increasing adoption in developing economies, and the ongoing demand for portable computing solutions across various sectors. Strategic investments in R&D, focused on enhancing performance, battery life, and user experience, will be crucial for manufacturers to maintain their competitive edge. The integration of AI and 5G technology will shape future laptop designs and functionalities, paving the way for a new era of enhanced productivity and seamless connectivity. Expanding into niche markets and developing innovative applications will be key to unlocking further growth opportunities.
Laptop Segmentation
-
1. Application
- 1.1. Commercial
- 1.2. Consumer
-
2. Types
- 2.1. Notebook Laptop
- 2.2. Gaming Laptop
- 2.3. Mobile Workstation Laptop
Laptop Segmentation By Geography
-
1. North America
- 1.1. United States
- 1.2. Canada
- 1.3. Mexico
-
2. South America
- 2.1. Brazil
- 2.2. Argentina
- 2.3. Rest of South America
-
3. Europe
- 3.1. United Kingdom
- 3.2. Germany
- 3.3. France
- 3.4. Italy
- 3.5. Spain
- 3.6. Russia
- 3.7. Benelux
- 3.8. Nordics
- 3.9. Rest of Europe
-
4. Middle East & Africa
- 4.1. Turkey
- 4.2. Israel
- 4.3. GCC
- 4.4. North Africa
- 4.5. South Africa
- 4.6. Rest of Middle East & Africa
-
5. Asia Pacific
- 5.1. China
- 5.2. India
- 5.3. Japan
- 5.4. South Korea
- 5.5. ASEAN
- 5.6. Oceania
- 5.7. Rest of Asia Pacific
Laptop Regional Market Share
Geographic Coverage of Laptop
Laptop REPORT HIGHLIGHTS
| Aspects | Details |
|---|---|
| Study Period | 2020-2034 |
| Base Year | 2025 |
| Estimated Year | 2026 |
| Forecast Period | 2026-2034 |
| Historical Period | 2020-2025 |
| Growth Rate | CAGR of 3.2% from 2020-2034 |
| Segmentation |
|
Table of Contents
- 1. Introduction
- 1.1. Research Scope
- 1.2. Market Segmentation
- 1.3. Research Methodology
- 1.4. Definitions and Assumptions
- 2. Executive Summary
- 2.1. Introduction
- 3. Market Dynamics
- 3.1. Introduction
- 3.2. Market Drivers
- 3.3. Market Restrains
- 3.4. Market Trends
- 4. Market Factor Analysis
- 4.1. Porters Five Forces
- 4.2. Supply/Value Chain
- 4.3. PESTEL analysis
- 4.4. Market Entropy
- 4.5. Patent/Trademark Analysis
- 5. Global Laptop Analysis, Insights and Forecast, 2020-2032
- 5.1. Market Analysis, Insights and Forecast - by Application
- 5.1.1. Commercial
- 5.1.2. Consumer
- 5.2. Market Analysis, Insights and Forecast - by Types
- 5.2.1. Notebook Laptop
- 5.2.2. Gaming Laptop
- 5.2.3. Mobile Workstation Laptop
- 5.3. Market Analysis, Insights and Forecast - by Region
- 5.3.1. North America
- 5.3.2. South America
- 5.3.3. Europe
- 5.3.4. Middle East & Africa
- 5.3.5. Asia Pacific
- 5.1. Market Analysis, Insights and Forecast - by Application
- 6. North America Laptop Analysis, Insights and Forecast, 2020-2032
- 6.1. Market Analysis, Insights and Forecast - by Application
- 6.1.1. Commercial
- 6.1.2. Consumer
- 6.2. Market Analysis, Insights and Forecast - by Types
- 6.2.1. Notebook Laptop
- 6.2.2. Gaming Laptop
- 6.2.3. Mobile Workstation Laptop
- 6.1. Market Analysis, Insights and Forecast - by Application
- 7. South America Laptop Analysis, Insights and Forecast, 2020-2032
- 7.1. Market Analysis, Insights and Forecast - by Application
- 7.1.1. Commercial
- 7.1.2. Consumer
- 7.2. Market Analysis, Insights and Forecast - by Types
- 7.2.1. Notebook Laptop
- 7.2.2. Gaming Laptop
- 7.2.3. Mobile Workstation Laptop
- 7.1. Market Analysis, Insights and Forecast - by Application
- 8. Europe Laptop Analysis, Insights and Forecast, 2020-2032
- 8.1. Market Analysis, Insights and Forecast - by Application
- 8.1.1. Commercial
- 8.1.2. Consumer
- 8.2. Market Analysis, Insights and Forecast - by Types
- 8.2.1. Notebook Laptop
- 8.2.2. Gaming Laptop
- 8.2.3. Mobile Workstation Laptop
- 8.1. Market Analysis, Insights and Forecast - by Application
- 9. Middle East & Africa Laptop Analysis, Insights and Forecast, 2020-2032
- 9.1. Market Analysis, Insights and Forecast - by Application
- 9.1.1. Commercial
- 9.1.2. Consumer
- 9.2. Market Analysis, Insights and Forecast - by Types
- 9.2.1. Notebook Laptop
- 9.2.2. Gaming Laptop
- 9.2.3. Mobile Workstation Laptop
- 9.1. Market Analysis, Insights and Forecast - by Application
- 10. Asia Pacific Laptop Analysis, Insights and Forecast, 2020-2032
- 10.1. Market Analysis, Insights and Forecast - by Application
- 10.1.1. Commercial
- 10.1.2. Consumer
- 10.2. Market Analysis, Insights and Forecast - by Types
- 10.2.1. Notebook Laptop
- 10.2.2. Gaming Laptop
- 10.2.3. Mobile Workstation Laptop
- 10.1. Market Analysis, Insights and Forecast - by Application
- 11. Competitive Analysis
- 11.1. Global Market Share Analysis 2025
- 11.2. Company Profiles
- 11.2.1 Lenovo
- 11.2.1.1. Overview
- 11.2.1.2. Products
- 11.2.1.3. SWOT Analysis
- 11.2.1.4. Recent Developments
- 11.2.1.5. Financials (Based on Availability)
- 11.2.2 HP
- 11.2.2.1. Overview
- 11.2.2.2. Products
- 11.2.2.3. SWOT Analysis
- 11.2.2.4. Recent Developments
- 11.2.2.5. Financials (Based on Availability)
- 11.2.3 Dell
- 11.2.3.1. Overview
- 11.2.3.2. Products
- 11.2.3.3. SWOT Analysis
- 11.2.3.4. Recent Developments
- 11.2.3.5. Financials (Based on Availability)
- 11.2.4 Apple
- 11.2.4.1. Overview
- 11.2.4.2. Products
- 11.2.4.3. SWOT Analysis
- 11.2.4.4. Recent Developments
- 11.2.4.5. Financials (Based on Availability)
- 11.2.5 ASUS
- 11.2.5.1. Overview
- 11.2.5.2. Products
- 11.2.5.3. SWOT Analysis
- 11.2.5.4. Recent Developments
- 11.2.5.5. Financials (Based on Availability)
- 11.2.6 Acer
- 11.2.6.1. Overview
- 11.2.6.2. Products
- 11.2.6.3. SWOT Analysis
- 11.2.6.4. Recent Developments
- 11.2.6.5. Financials (Based on Availability)
- 11.2.7 Microsoft
- 11.2.7.1. Overview
- 11.2.7.2. Products
- 11.2.7.3. SWOT Analysis
- 11.2.7.4. Recent Developments
- 11.2.7.5. Financials (Based on Availability)
- 11.2.8 Micro-Star International
- 11.2.8.1. Overview
- 11.2.8.2. Products
- 11.2.8.3. SWOT Analysis
- 11.2.8.4. Recent Developments
- 11.2.8.5. Financials (Based on Availability)
- 11.2.9 Razer
- 11.2.9.1. Overview
- 11.2.9.2. Products
- 11.2.9.3. SWOT Analysis
- 11.2.9.4. Recent Developments
- 11.2.9.5. Financials (Based on Availability)
- 11.2.10 Samsung
- 11.2.10.1. Overview
- 11.2.10.2. Products
- 11.2.10.3. SWOT Analysis
- 11.2.10.4. Recent Developments
- 11.2.10.5. Financials (Based on Availability)
- 11.2.1 Lenovo
List of Figures
- Figure 1: Global Laptop Revenue Breakdown (million, %) by Region 2025 & 2033
- Figure 2: North America Laptop Revenue (million), by Application 2025 & 2033
- Figure 3: North America Laptop Revenue Share (%), by Application 2025 & 2033
- Figure 4: North America Laptop Revenue (million), by Types 2025 & 2033
- Figure 5: North America Laptop Revenue Share (%), by Types 2025 & 2033
- Figure 6: North America Laptop Revenue (million), by Country 2025 & 2033
- Figure 7: North America Laptop Revenue Share (%), by Country 2025 & 2033
- Figure 8: South America Laptop Revenue (million), by Application 2025 & 2033
- Figure 9: South America Laptop Revenue Share (%), by Application 2025 & 2033
- Figure 10: South America Laptop Revenue (million), by Types 2025 & 2033
- Figure 11: South America Laptop Revenue Share (%), by Types 2025 & 2033
- Figure 12: South America Laptop Revenue (million), by Country 2025 & 2033
- Figure 13: South America Laptop Revenue Share (%), by Country 2025 & 2033
- Figure 14: Europe Laptop Revenue (million), by Application 2025 & 2033
- Figure 15: Europe Laptop Revenue Share (%), by Application 2025 & 2033
- Figure 16: Europe Laptop Revenue (million), by Types 2025 & 2033
- Figure 17: Europe Laptop Revenue Share (%), by Types 2025 & 2033
- Figure 18: Europe Laptop Revenue (million), by Country 2025 & 2033
- Figure 19: Europe Laptop Revenue Share (%), by Country 2025 & 2033
- Figure 20: Middle East & Africa Laptop Revenue (million), by Application 2025 & 2033
- Figure 21: Middle East & Africa Laptop Revenue Share (%), by Application 2025 & 2033
- Figure 22: Middle East & Africa Laptop Revenue (million), by Types 2025 & 2033
- Figure 23: Middle East & Africa Laptop Revenue Share (%), by Types 2025 & 2033
- Figure 24: Middle East & Africa Laptop Revenue (million), by Country 2025 & 2033
- Figure 25: Middle East & Africa Laptop Revenue Share (%), by Country 2025 & 2033
- Figure 26: Asia Pacific Laptop Revenue (million), by Application 2025 & 2033
- Figure 27: Asia Pacific Laptop Revenue Share (%), by Application 2025 & 2033
- Figure 28: Asia Pacific Laptop Revenue (million), by Types 2025 & 2033
- Figure 29: Asia Pacific Laptop Revenue Share (%), by Types 2025 & 2033
- Figure 30: Asia Pacific Laptop Revenue (million), by Country 2025 & 2033
- Figure 31: Asia Pacific Laptop Revenue Share (%), by Country 2025 & 2033
List of Tables
- Table 1: Global Laptop Revenue million Forecast, by Application 2020 & 2033
- Table 2: Global Laptop Revenue million Forecast, by Types 2020 & 2033
- Table 3: Global Laptop Revenue million Forecast, by Region 2020 & 2033
- Table 4: Global Laptop Revenue million Forecast, by Application 2020 & 2033
- Table 5: Global Laptop Revenue million Forecast, by Types 2020 & 2033
- Table 6: Global Laptop Revenue million Forecast, by Country 2020 & 2033
- Table 7: United States Laptop Revenue (million) Forecast, by Application 2020 & 2033
- Table 8: Canada Laptop Revenue (million) Forecast, by Application 2020 & 2033
- Table 9: Mexico Laptop Revenue (million) Forecast, by Application 2020 & 2033
- Table 10: Global Laptop Revenue million Forecast, by Application 2020 & 2033
- Table 11: Global Laptop Revenue million Forecast, by Types 2020 & 2033
- Table 12: Global Laptop Revenue million Forecast, by Country 2020 & 2033
- Table 13: Brazil Laptop Revenue (million) Forecast, by Application 2020 & 2033
- Table 14: Argentina Laptop Revenue (million) Forecast, by Application 2020 & 2033
- Table 15: Rest of South America Laptop Revenue (million) Forecast, by Application 2020 & 2033
- Table 16: Global Laptop Revenue million Forecast, by Application 2020 & 2033
- Table 17: Global Laptop Revenue million Forecast, by Types 2020 & 2033
- Table 18: Global Laptop Revenue million Forecast, by Country 2020 & 2033
- Table 19: United Kingdom Laptop Revenue (million) Forecast, by Application 2020 & 2033
- Table 20: Germany Laptop Revenue (million) Forecast, by Application 2020 & 2033
- Table 21: France Laptop Revenue (million) Forecast, by Application 2020 & 2033
- Table 22: Italy Laptop Revenue (million) Forecast, by Application 2020 & 2033
- Table 23: Spain Laptop Revenue (million) Forecast, by Application 2020 & 2033
- Table 24: Russia Laptop Revenue (million) Forecast, by Application 2020 & 2033
- Table 25: Benelux Laptop Revenue (million) Forecast, by Application 2020 & 2033
- Table 26: Nordics Laptop Revenue (million) Forecast, by Application 2020 & 2033
- Table 27: Rest of Europe Laptop Revenue (million) Forecast, by Application 2020 & 2033
- Table 28: Global Laptop Revenue million Forecast, by Application 2020 & 2033
- Table 29: Global Laptop Revenue million Forecast, by Types 2020 & 2033
- Table 30: Global Laptop Revenue million Forecast, by Country 2020 & 2033
- Table 31: Turkey Laptop Revenue (million) Forecast, by Application 2020 & 2033
- Table 32: Israel Laptop Revenue (million) Forecast, by Application 2020 & 2033
- Table 33: GCC Laptop Revenue (million) Forecast, by Application 2020 & 2033
- Table 34: North Africa Laptop Revenue (million) Forecast, by Application 2020 & 2033
- Table 35: South Africa Laptop Revenue (million) Forecast, by Application 2020 & 2033
- Table 36: Rest of Middle East & Africa Laptop Revenue (million) Forecast, by Application 2020 & 2033
- Table 37: Global Laptop Revenue million Forecast, by Application 2020 & 2033
- Table 38: Global Laptop Revenue million Forecast, by Types 2020 & 2033
- Table 39: Global Laptop Revenue million Forecast, by Country 2020 & 2033
- Table 40: China Laptop Revenue (million) Forecast, by Application 2020 & 2033
- Table 41: India Laptop Revenue (million) Forecast, by Application 2020 & 2033
- Table 42: Japan Laptop Revenue (million) Forecast, by Application 2020 & 2033
- Table 43: South Korea Laptop Revenue (million) Forecast, by Application 2020 & 2033
- Table 44: ASEAN Laptop Revenue (million) Forecast, by Application 2020 & 2033
- Table 45: Oceania Laptop Revenue (million) Forecast, by Application 2020 & 2033
- Table 46: Rest of Asia Pacific Laptop Revenue (million) Forecast, by Application 2020 & 2033
Frequently Asked Questions
1. What is the projected Compound Annual Growth Rate (CAGR) of the Laptop?
The projected CAGR is approximately 3.2%.
2. Which companies are prominent players in the Laptop?
Key companies in the market include Lenovo, HP, Dell, Apple, ASUS, Acer, Microsoft, Micro-Star International, Razer, Samsung.
3. What are the main segments of the Laptop?
The market segments include Application, Types.
4. Can you provide details about the market size?
The market size is estimated to be USD 139310 million as of 2022.
5. What are some drivers contributing to market growth?
N/A
6. What are the notable trends driving market growth?
N/A
7. Are there any restraints impacting market growth?
N/A
8. Can you provide examples of recent developments in the market?
N/A
9. What pricing options are available for accessing the report?
Pricing options include single-user, multi-user, and enterprise licenses priced at USD 2900.00, USD 4350.00, and USD 5800.00 respectively.
10. Is the market size provided in terms of value or volume?
The market size is provided in terms of value, measured in million.
11. Are there any specific market keywords associated with the report?
Yes, the market keyword associated with the report is "Laptop," which aids in identifying and referencing the specific market segment covered.
12. How do I determine which pricing option suits my needs best?
The pricing options vary based on user requirements and access needs. Individual users may opt for single-user licenses, while businesses requiring broader access may choose multi-user or enterprise licenses for cost-effective access to the report.
13. Are there any additional resources or data provided in the Laptop report?
While the report offers comprehensive insights, it's advisable to review the specific contents or supplementary materials provided to ascertain if additional resources or data are available.
14. How can I stay updated on further developments or reports in the Laptop?
To stay informed about further developments, trends, and reports in the Laptop, consider subscribing to industry newsletters, following relevant companies and organizations, or regularly checking reputable industry news sources and publications.
Methodology
Step 1 - Identification of Relevant Samples Size from Population Database


Step 2 - Approaches for Defining Global Market Size (Value, Volume* & Price*)

Note*: In applicable scenarios
Step 3 - Data Sources
Primary Research
- Web Analytics
- Survey Reports
- Research Institute
- Latest Research Reports
- Opinion Leaders
Secondary Research
- Annual Reports
- White Paper
- Latest Press Release
- Industry Association
- Paid Database
- Investor Presentations

Step 4 - Data Triangulation
Involves using different sources of information in order to increase the validity of a study
These sources are likely to be stakeholders in a program - participants, other researchers, program staff, other community members, and so on.
Then we put all data in single framework & apply various statistical tools to find out the dynamic on the market.
During the analysis stage, feedback from the stakeholder groups would be compared to determine areas of agreement as well as areas of divergence