

Key Insights
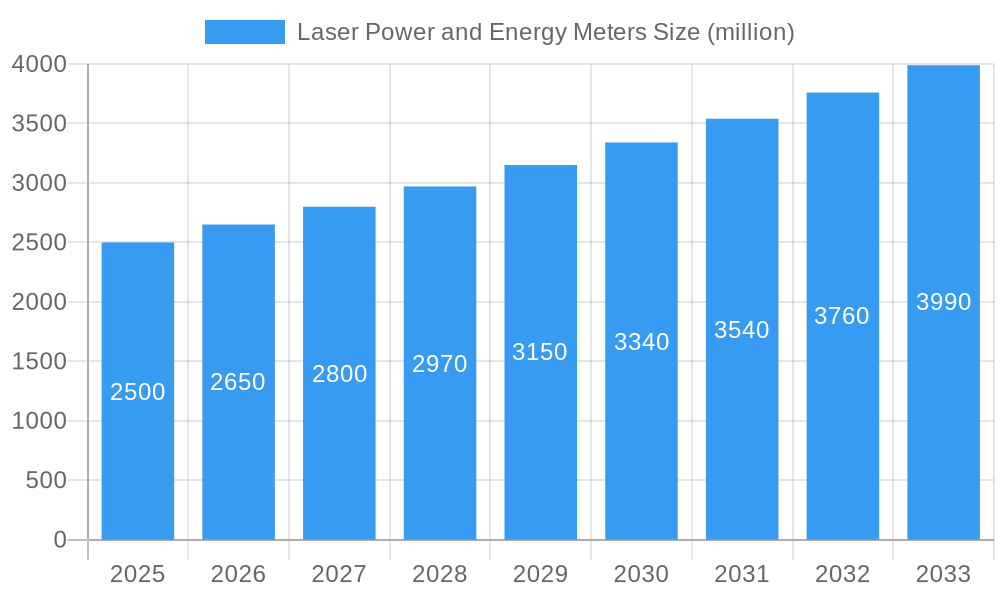
The global laser power and energy meters market is projected for significant expansion, driven by widespread adoption in manufacturing, research, and medical sectors. Advancements in laser technology, enabling higher power densities and complex applications, necessitate precise power measurement, thus fueling market growth. Increased automation in semiconductor fabrication and materials processing further underscores the demand for accurate and reliable power monitoring. Stringent regulatory mandates for laser safety and performance also compel the adoption of these meters for compliance. The market is anticipated to grow at a Compound Annual Growth Rate (CAGR) of 9.9%, reaching a market size of $948.44 million by 2025. Key industry leaders, including Coherent, Edmund Optics, MKS Instruments (Ophir and Newport), Thorlabs, Gentec-EO, Laserpoint, and Optosigma, are actively innovating and diversifying their product portfolios, shaping the market's trajectory. The market is segmented by meter type (power, energy, and combined units), application (industrial, scientific, and medical), and wavelength range, each contributing distinct growth dynamics.
Laser Power and Energy Meters Market Size (In Million)
The competitive environment features established market leaders and specialized niche providers. Competition centers on technological innovation, offering enhanced functionalities, superior accuracy, and intuitive user interfaces. Strategic initiatives include expansion into emerging applications and geographical markets, particularly in rapidly developing economies. Potential market limitations involve the cost of advanced meters with specialized features and the requirement for skilled personnel for operation and calibration. Nevertheless, the market's robust outlook, supported by diverse applications and continuous technological advancements, indicates sustained growth.
Laser Power and Energy Meters Company Market Share
Laser Power and Energy Meters Market Report: 2019-2033
This comprehensive report provides an in-depth analysis of the Laser Power and Energy Meters market, encompassing market dynamics, growth trends, regional dominance, product landscape, key players, and future outlook. The study period spans from 2019 to 2033, with 2025 serving as the base and estimated year. This report is crucial for industry professionals, investors, and researchers seeking a thorough understanding of this dynamic market. The parent market is the broader optical instrumentation market, while the child market is specifically laser measurement devices.
Laser Power and Energy Meters Market Dynamics & Structure
The Laser Power and Energy Meters market is characterized by moderate concentration, with key players like Coherent, Edmund Optics, MKS Instruments Ophir, Thorlabs, Gentec-EO, Laserpoint, MKS Instruments Newport, and Optosigma holding significant market share. The market's growth is driven by technological innovations in laser technology, increasing demand from various end-user industries (e.g., manufacturing, research, healthcare), and favorable regulatory frameworks in many regions. However, the market faces challenges from the emergence of substitute technologies and fluctuating raw material prices. The competitive landscape is shaped by strategic alliances, mergers & acquisitions (M&A), and ongoing product development.
- Market Concentration: Moderately concentrated, with the top 8 players holding approximately xx% of the market share in 2025 (estimated).
- Technological Innovation: Continuous advancements in sensor technology, improved accuracy, and miniaturization are driving growth.
- Regulatory Landscape: Stringent safety and performance standards influence market dynamics, particularly in medical and industrial applications.
- Competitive Substitutes: Alternative measurement techniques, such as thermal sensors, pose a competitive threat, though laser-based systems maintain a dominant position due to their precision and versatility.
- M&A Activity: The number of M&A deals in the Laser Power and Energy Meters market averaged approximately xx deals per year between 2019 and 2024.
- End-User Demographics: Key end-users include research institutions, manufacturing facilities (semiconductor, automotive, etc.), and medical device manufacturers.
Laser Power and Energy Meters Growth Trends & Insights
The Laser Power and Energy Meters market exhibited a Compound Annual Growth Rate (CAGR) of xx% during the historical period (2019-2024) and is projected to maintain a CAGR of xx% during the forecast period (2025-2033). Market size is estimated at $xx million in 2025, projected to reach $xx million by 2033. This growth is fueled by increasing adoption across diverse industries, driven by rising automation, precision manufacturing requirements, and technological advancements. Technological disruptions, such as the introduction of more compact and cost-effective sensors, are impacting the market positively. Consumer behavior is shifting towards preference for high-accuracy, real-time measurement capabilities. Market penetration in key sectors like healthcare and scientific research continues to grow.
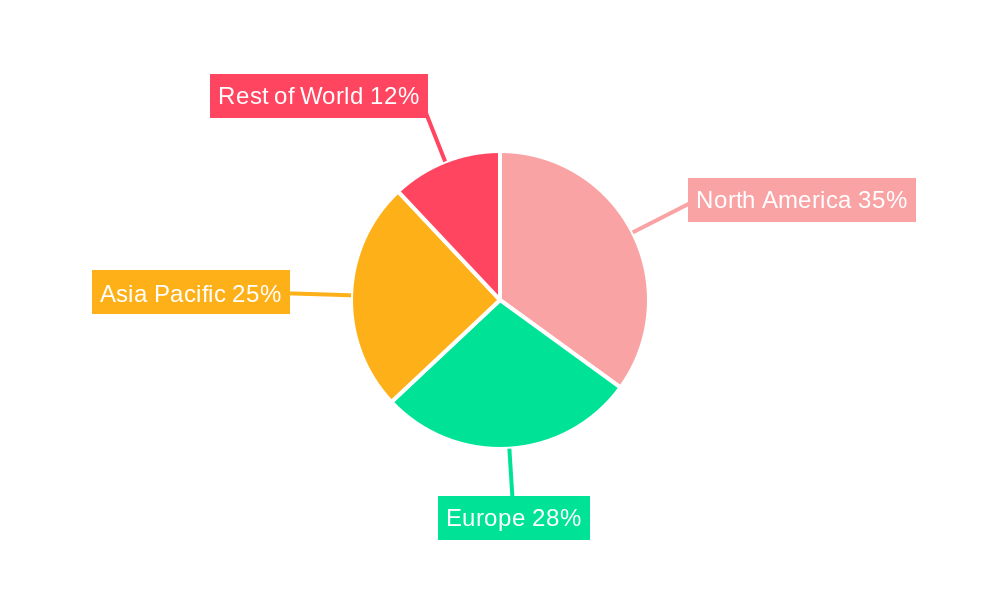
Dominant Regions, Countries, or Segments in Laser Power and Energy Meters
North America currently holds the largest market share in Laser Power and Energy Meters, driven by strong demand from the research & development sector and advanced manufacturing industries. However, Asia-Pacific is projected to experience the fastest growth during the forecast period, fueled by expanding industrialization, government initiatives promoting technological advancements, and increasing investment in research infrastructure.
- North America: High adoption rates in advanced manufacturing and research sectors, strong regulatory support.
- Europe: Stable market growth, driven by increasing demand for precision measurement across various industries.
- Asia-Pacific: Fastest growing region, driven by expanding industrialization, rising R&D investments, and government support.
- Rest of the World: Moderate growth, with potential for expansion in emerging economies.
Laser Power and Energy Meters Product Landscape
The market offers a range of power and energy meters, varying in measurement range, accuracy, and features. Innovations focus on improving accuracy, miniaturization, and integration with other systems. Products with advanced features like real-time data analysis, wireless connectivity, and automated calibration are gaining popularity. Unique selling propositions include high dynamic range, spectral response customization, and user-friendly interfaces. Technological advancements encompass faster response times, higher sensitivity, and improved thermal stability.
Key Drivers, Barriers & Challenges in Laser Power and Energy Meters
Key Drivers:
- Increasing demand for precision measurement in diverse industries (manufacturing, medical, research).
- Technological advancements resulting in improved accuracy, miniaturization, and cost-effectiveness.
- Stringent regulations promoting safety and performance standards.
- Growing automation and industrialization across different sectors.
Key Challenges:
- Fluctuations in raw material prices impacting production costs.
- Intense competition among established players and emerging entrants.
- Supply chain disruptions affecting production and delivery timelines.
- The need for continuous technological upgrades to remain competitive. The estimated impact of supply chain issues on market growth is approximately xx% annually.
Emerging Opportunities in Laser Power and Energy Meters
The market presents opportunities in emerging applications such as laser-based medical devices, advanced materials processing, and environmental monitoring. Untapped markets in developing economies present considerable growth potential. The increasing demand for portable, compact measurement devices creates opportunities for innovation in design and manufacturing.
Growth Accelerators in the Laser Power and Energy Meters Industry
Technological breakthroughs in sensor technology and data processing capabilities are major growth drivers. Strategic partnerships between manufacturers and end-users foster collaborative innovation and market expansion. Global market expansion into developing economies further accelerates growth.
Key Players Shaping the Laser Power and Energy Meters Market
- Coherent
- Edmund Optics
- MKS Instruments Ophir
- Thorlabs
- Gentec-EO
- Laserpoint
- MKS Instruments Newport
- Optosigma
Notable Milestones in Laser Power and Energy Meters Sector
- 2020: Thorlabs launched a new line of high-precision power meters.
- 2021: MKS Instruments acquired a smaller laser measurement company, enhancing its market share.
- 2022: Significant advancements in sensor technology led to more compact and cost-effective power meters.
- 2023: New industry standards for laser safety were implemented, impacting product development.
- 2024: Several key players launched new products with enhanced features like wireless connectivity and real-time data analysis.
In-Depth Laser Power and Energy Meters Market Outlook
The Laser Power and Energy Meters market is poised for significant growth in the coming years, driven by continuous technological advancements, expanding applications across multiple industries, and the increasing adoption of automation in manufacturing. Strategic partnerships and global market expansion will further contribute to market growth, presenting significant opportunities for players in the industry. The market anticipates steady expansion, with a positive outlook for innovation and market penetration.
Laser Power and Energy Meters Segmentation
-
1. Application
- 1.1. Laboratory
- 1.2. Production Environments
- 1.3. Others
-
2. Types
- 2.1. Portable PEM
- 2.2. Desktop PEM
Laser Power and Energy Meters Segmentation By Geography
-
1. North America
- 1.1. United States
- 1.2. Canada
- 1.3. Mexico
-
2. South America
- 2.1. Brazil
- 2.2. Argentina
- 2.3. Rest of South America
-
3. Europe
- 3.1. United Kingdom
- 3.2. Germany
- 3.3. France
- 3.4. Italy
- 3.5. Spain
- 3.6. Russia
- 3.7. Benelux
- 3.8. Nordics
- 3.9. Rest of Europe
-
4. Middle East & Africa
- 4.1. Turkey
- 4.2. Israel
- 4.3. GCC
- 4.4. North Africa
- 4.5. South Africa
- 4.6. Rest of Middle East & Africa
-
5. Asia Pacific
- 5.1. China
- 5.2. India
- 5.3. Japan
- 5.4. South Korea
- 5.5. ASEAN
- 5.6. Oceania
- 5.7. Rest of Asia Pacific
Laser Power and Energy Meters Regional Market Share
Geographic Coverage of Laser Power and Energy Meters
Laser Power and Energy Meters REPORT HIGHLIGHTS
| Aspects | Details |
|---|---|
| Study Period | 2020-2034 |
| Base Year | 2025 |
| Estimated Year | 2026 |
| Forecast Period | 2026-2034 |
| Historical Period | 2020-2025 |
| Growth Rate | CAGR of 9.9% from 2020-2034 |
| Segmentation |
|
Table of Contents
- 1. Introduction
- 1.1. Research Scope
- 1.2. Market Segmentation
- 1.3. Research Methodology
- 1.4. Definitions and Assumptions
- 2. Executive Summary
- 2.1. Introduction
- 3. Market Dynamics
- 3.1. Introduction
- 3.2. Market Drivers
- 3.3. Market Restrains
- 3.4. Market Trends
- 4. Market Factor Analysis
- 4.1. Porters Five Forces
- 4.2. Supply/Value Chain
- 4.3. PESTEL analysis
- 4.4. Market Entropy
- 4.5. Patent/Trademark Analysis
- 5. Global Laser Power and Energy Meters Analysis, Insights and Forecast, 2020-2032
- 5.1. Market Analysis, Insights and Forecast - by Application
- 5.1.1. Laboratory
- 5.1.2. Production Environments
- 5.1.3. Others
- 5.2. Market Analysis, Insights and Forecast - by Types
- 5.2.1. Portable PEM
- 5.2.2. Desktop PEM
- 5.3. Market Analysis, Insights and Forecast - by Region
- 5.3.1. North America
- 5.3.2. South America
- 5.3.3. Europe
- 5.3.4. Middle East & Africa
- 5.3.5. Asia Pacific
- 5.1. Market Analysis, Insights and Forecast - by Application
- 6. North America Laser Power and Energy Meters Analysis, Insights and Forecast, 2020-2032
- 6.1. Market Analysis, Insights and Forecast - by Application
- 6.1.1. Laboratory
- 6.1.2. Production Environments
- 6.1.3. Others
- 6.2. Market Analysis, Insights and Forecast - by Types
- 6.2.1. Portable PEM
- 6.2.2. Desktop PEM
- 6.1. Market Analysis, Insights and Forecast - by Application
- 7. South America Laser Power and Energy Meters Analysis, Insights and Forecast, 2020-2032
- 7.1. Market Analysis, Insights and Forecast - by Application
- 7.1.1. Laboratory
- 7.1.2. Production Environments
- 7.1.3. Others
- 7.2. Market Analysis, Insights and Forecast - by Types
- 7.2.1. Portable PEM
- 7.2.2. Desktop PEM
- 7.1. Market Analysis, Insights and Forecast - by Application
- 8. Europe Laser Power and Energy Meters Analysis, Insights and Forecast, 2020-2032
- 8.1. Market Analysis, Insights and Forecast - by Application
- 8.1.1. Laboratory
- 8.1.2. Production Environments
- 8.1.3. Others
- 8.2. Market Analysis, Insights and Forecast - by Types
- 8.2.1. Portable PEM
- 8.2.2. Desktop PEM
- 8.1. Market Analysis, Insights and Forecast - by Application
- 9. Middle East & Africa Laser Power and Energy Meters Analysis, Insights and Forecast, 2020-2032
- 9.1. Market Analysis, Insights and Forecast - by Application
- 9.1.1. Laboratory
- 9.1.2. Production Environments
- 9.1.3. Others
- 9.2. Market Analysis, Insights and Forecast - by Types
- 9.2.1. Portable PEM
- 9.2.2. Desktop PEM
- 9.1. Market Analysis, Insights and Forecast - by Application
- 10. Asia Pacific Laser Power and Energy Meters Analysis, Insights and Forecast, 2020-2032
- 10.1. Market Analysis, Insights and Forecast - by Application
- 10.1.1. Laboratory
- 10.1.2. Production Environments
- 10.1.3. Others
- 10.2. Market Analysis, Insights and Forecast - by Types
- 10.2.1. Portable PEM
- 10.2.2. Desktop PEM
- 10.1. Market Analysis, Insights and Forecast - by Application
- 11. Competitive Analysis
- 11.1. Global Market Share Analysis 2025
- 11.2. Company Profiles
- 11.2.1 Coherent
- 11.2.1.1. Overview
- 11.2.1.2. Products
- 11.2.1.3. SWOT Analysis
- 11.2.1.4. Recent Developments
- 11.2.1.5. Financials (Based on Availability)
- 11.2.2 Edmund Optics
- 11.2.2.1. Overview
- 11.2.2.2. Products
- 11.2.2.3. SWOT Analysis
- 11.2.2.4. Recent Developments
- 11.2.2.5. Financials (Based on Availability)
- 11.2.3 MKS Instruments Ophir
- 11.2.3.1. Overview
- 11.2.3.2. Products
- 11.2.3.3. SWOT Analysis
- 11.2.3.4. Recent Developments
- 11.2.3.5. Financials (Based on Availability)
- 11.2.4 Thorlabs
- 11.2.4.1. Overview
- 11.2.4.2. Products
- 11.2.4.3. SWOT Analysis
- 11.2.4.4. Recent Developments
- 11.2.4.5. Financials (Based on Availability)
- 11.2.5 Gentec-EO
- 11.2.5.1. Overview
- 11.2.5.2. Products
- 11.2.5.3. SWOT Analysis
- 11.2.5.4. Recent Developments
- 11.2.5.5. Financials (Based on Availability)
- 11.2.6 Laserpoint
- 11.2.6.1. Overview
- 11.2.6.2. Products
- 11.2.6.3. SWOT Analysis
- 11.2.6.4. Recent Developments
- 11.2.6.5. Financials (Based on Availability)
- 11.2.7 MKS Instruments Newport
- 11.2.7.1. Overview
- 11.2.7.2. Products
- 11.2.7.3. SWOT Analysis
- 11.2.7.4. Recent Developments
- 11.2.7.5. Financials (Based on Availability)
- 11.2.8 Optosigma
- 11.2.8.1. Overview
- 11.2.8.2. Products
- 11.2.8.3. SWOT Analysis
- 11.2.8.4. Recent Developments
- 11.2.8.5. Financials (Based on Availability)
- 11.2.1 Coherent
List of Figures
- Figure 1: Global Laser Power and Energy Meters Revenue Breakdown (million, %) by Region 2025 & 2033
- Figure 2: Global Laser Power and Energy Meters Volume Breakdown (K, %) by Region 2025 & 2033
- Figure 3: North America Laser Power and Energy Meters Revenue (million), by Application 2025 & 2033
- Figure 4: North America Laser Power and Energy Meters Volume (K), by Application 2025 & 2033
- Figure 5: North America Laser Power and Energy Meters Revenue Share (%), by Application 2025 & 2033
- Figure 6: North America Laser Power and Energy Meters Volume Share (%), by Application 2025 & 2033
- Figure 7: North America Laser Power and Energy Meters Revenue (million), by Types 2025 & 2033
- Figure 8: North America Laser Power and Energy Meters Volume (K), by Types 2025 & 2033
- Figure 9: North America Laser Power and Energy Meters Revenue Share (%), by Types 2025 & 2033
- Figure 10: North America Laser Power and Energy Meters Volume Share (%), by Types 2025 & 2033
- Figure 11: North America Laser Power and Energy Meters Revenue (million), by Country 2025 & 2033
- Figure 12: North America Laser Power and Energy Meters Volume (K), by Country 2025 & 2033
- Figure 13: North America Laser Power and Energy Meters Revenue Share (%), by Country 2025 & 2033
- Figure 14: North America Laser Power and Energy Meters Volume Share (%), by Country 2025 & 2033
- Figure 15: South America Laser Power and Energy Meters Revenue (million), by Application 2025 & 2033
- Figure 16: South America Laser Power and Energy Meters Volume (K), by Application 2025 & 2033
- Figure 17: South America Laser Power and Energy Meters Revenue Share (%), by Application 2025 & 2033
- Figure 18: South America Laser Power and Energy Meters Volume Share (%), by Application 2025 & 2033
- Figure 19: South America Laser Power and Energy Meters Revenue (million), by Types 2025 & 2033
- Figure 20: South America Laser Power and Energy Meters Volume (K), by Types 2025 & 2033
- Figure 21: South America Laser Power and Energy Meters Revenue Share (%), by Types 2025 & 2033
- Figure 22: South America Laser Power and Energy Meters Volume Share (%), by Types 2025 & 2033
- Figure 23: South America Laser Power and Energy Meters Revenue (million), by Country 2025 & 2033
- Figure 24: South America Laser Power and Energy Meters Volume (K), by Country 2025 & 2033
- Figure 25: South America Laser Power and Energy Meters Revenue Share (%), by Country 2025 & 2033
- Figure 26: South America Laser Power and Energy Meters Volume Share (%), by Country 2025 & 2033
- Figure 27: Europe Laser Power and Energy Meters Revenue (million), by Application 2025 & 2033
- Figure 28: Europe Laser Power and Energy Meters Volume (K), by Application 2025 & 2033
- Figure 29: Europe Laser Power and Energy Meters Revenue Share (%), by Application 2025 & 2033
- Figure 30: Europe Laser Power and Energy Meters Volume Share (%), by Application 2025 & 2033
- Figure 31: Europe Laser Power and Energy Meters Revenue (million), by Types 2025 & 2033
- Figure 32: Europe Laser Power and Energy Meters Volume (K), by Types 2025 & 2033
- Figure 33: Europe Laser Power and Energy Meters Revenue Share (%), by Types 2025 & 2033
- Figure 34: Europe Laser Power and Energy Meters Volume Share (%), by Types 2025 & 2033
- Figure 35: Europe Laser Power and Energy Meters Revenue (million), by Country 2025 & 2033
- Figure 36: Europe Laser Power and Energy Meters Volume (K), by Country 2025 & 2033
- Figure 37: Europe Laser Power and Energy Meters Revenue Share (%), by Country 2025 & 2033
- Figure 38: Europe Laser Power and Energy Meters Volume Share (%), by Country 2025 & 2033
- Figure 39: Middle East & Africa Laser Power and Energy Meters Revenue (million), by Application 2025 & 2033
- Figure 40: Middle East & Africa Laser Power and Energy Meters Volume (K), by Application 2025 & 2033
- Figure 41: Middle East & Africa Laser Power and Energy Meters Revenue Share (%), by Application 2025 & 2033
- Figure 42: Middle East & Africa Laser Power and Energy Meters Volume Share (%), by Application 2025 & 2033
- Figure 43: Middle East & Africa Laser Power and Energy Meters Revenue (million), by Types 2025 & 2033
- Figure 44: Middle East & Africa Laser Power and Energy Meters Volume (K), by Types 2025 & 2033
- Figure 45: Middle East & Africa Laser Power and Energy Meters Revenue Share (%), by Types 2025 & 2033
- Figure 46: Middle East & Africa Laser Power and Energy Meters Volume Share (%), by Types 2025 & 2033
- Figure 47: Middle East & Africa Laser Power and Energy Meters Revenue (million), by Country 2025 & 2033
- Figure 48: Middle East & Africa Laser Power and Energy Meters Volume (K), by Country 2025 & 2033
- Figure 49: Middle East & Africa Laser Power and Energy Meters Revenue Share (%), by Country 2025 & 2033
- Figure 50: Middle East & Africa Laser Power and Energy Meters Volume Share (%), by Country 2025 & 2033
- Figure 51: Asia Pacific Laser Power and Energy Meters Revenue (million), by Application 2025 & 2033
- Figure 52: Asia Pacific Laser Power and Energy Meters Volume (K), by Application 2025 & 2033
- Figure 53: Asia Pacific Laser Power and Energy Meters Revenue Share (%), by Application 2025 & 2033
- Figure 54: Asia Pacific Laser Power and Energy Meters Volume Share (%), by Application 2025 & 2033
- Figure 55: Asia Pacific Laser Power and Energy Meters Revenue (million), by Types 2025 & 2033
- Figure 56: Asia Pacific Laser Power and Energy Meters Volume (K), by Types 2025 & 2033
- Figure 57: Asia Pacific Laser Power and Energy Meters Revenue Share (%), by Types 2025 & 2033
- Figure 58: Asia Pacific Laser Power and Energy Meters Volume Share (%), by Types 2025 & 2033
- Figure 59: Asia Pacific Laser Power and Energy Meters Revenue (million), by Country 2025 & 2033
- Figure 60: Asia Pacific Laser Power and Energy Meters Volume (K), by Country 2025 & 2033
- Figure 61: Asia Pacific Laser Power and Energy Meters Revenue Share (%), by Country 2025 & 2033
- Figure 62: Asia Pacific Laser Power and Energy Meters Volume Share (%), by Country 2025 & 2033
List of Tables
- Table 1: Global Laser Power and Energy Meters Revenue million Forecast, by Application 2020 & 2033
- Table 2: Global Laser Power and Energy Meters Volume K Forecast, by Application 2020 & 2033
- Table 3: Global Laser Power and Energy Meters Revenue million Forecast, by Types 2020 & 2033
- Table 4: Global Laser Power and Energy Meters Volume K Forecast, by Types 2020 & 2033
- Table 5: Global Laser Power and Energy Meters Revenue million Forecast, by Region 2020 & 2033
- Table 6: Global Laser Power and Energy Meters Volume K Forecast, by Region 2020 & 2033
- Table 7: Global Laser Power and Energy Meters Revenue million Forecast, by Application 2020 & 2033
- Table 8: Global Laser Power and Energy Meters Volume K Forecast, by Application 2020 & 2033
- Table 9: Global Laser Power and Energy Meters Revenue million Forecast, by Types 2020 & 2033
- Table 10: Global Laser Power and Energy Meters Volume K Forecast, by Types 2020 & 2033
- Table 11: Global Laser Power and Energy Meters Revenue million Forecast, by Country 2020 & 2033
- Table 12: Global Laser Power and Energy Meters Volume K Forecast, by Country 2020 & 2033
- Table 13: United States Laser Power and Energy Meters Revenue (million) Forecast, by Application 2020 & 2033
- Table 14: United States Laser Power and Energy Meters Volume (K) Forecast, by Application 2020 & 2033
- Table 15: Canada Laser Power and Energy Meters Revenue (million) Forecast, by Application 2020 & 2033
- Table 16: Canada Laser Power and Energy Meters Volume (K) Forecast, by Application 2020 & 2033
- Table 17: Mexico Laser Power and Energy Meters Revenue (million) Forecast, by Application 2020 & 2033
- Table 18: Mexico Laser Power and Energy Meters Volume (K) Forecast, by Application 2020 & 2033
- Table 19: Global Laser Power and Energy Meters Revenue million Forecast, by Application 2020 & 2033
- Table 20: Global Laser Power and Energy Meters Volume K Forecast, by Application 2020 & 2033
- Table 21: Global Laser Power and Energy Meters Revenue million Forecast, by Types 2020 & 2033
- Table 22: Global Laser Power and Energy Meters Volume K Forecast, by Types 2020 & 2033
- Table 23: Global Laser Power and Energy Meters Revenue million Forecast, by Country 2020 & 2033
- Table 24: Global Laser Power and Energy Meters Volume K Forecast, by Country 2020 & 2033
- Table 25: Brazil Laser Power and Energy Meters Revenue (million) Forecast, by Application 2020 & 2033
- Table 26: Brazil Laser Power and Energy Meters Volume (K) Forecast, by Application 2020 & 2033
- Table 27: Argentina Laser Power and Energy Meters Revenue (million) Forecast, by Application 2020 & 2033
- Table 28: Argentina Laser Power and Energy Meters Volume (K) Forecast, by Application 2020 & 2033
- Table 29: Rest of South America Laser Power and Energy Meters Revenue (million) Forecast, by Application 2020 & 2033
- Table 30: Rest of South America Laser Power and Energy Meters Volume (K) Forecast, by Application 2020 & 2033
- Table 31: Global Laser Power and Energy Meters Revenue million Forecast, by Application 2020 & 2033
- Table 32: Global Laser Power and Energy Meters Volume K Forecast, by Application 2020 & 2033
- Table 33: Global Laser Power and Energy Meters Revenue million Forecast, by Types 2020 & 2033
- Table 34: Global Laser Power and Energy Meters Volume K Forecast, by Types 2020 & 2033
- Table 35: Global Laser Power and Energy Meters Revenue million Forecast, by Country 2020 & 2033
- Table 36: Global Laser Power and Energy Meters Volume K Forecast, by Country 2020 & 2033
- Table 37: United Kingdom Laser Power and Energy Meters Revenue (million) Forecast, by Application 2020 & 2033
- Table 38: United Kingdom Laser Power and Energy Meters Volume (K) Forecast, by Application 2020 & 2033
- Table 39: Germany Laser Power and Energy Meters Revenue (million) Forecast, by Application 2020 & 2033
- Table 40: Germany Laser Power and Energy Meters Volume (K) Forecast, by Application 2020 & 2033
- Table 41: France Laser Power and Energy Meters Revenue (million) Forecast, by Application 2020 & 2033
- Table 42: France Laser Power and Energy Meters Volume (K) Forecast, by Application 2020 & 2033
- Table 43: Italy Laser Power and Energy Meters Revenue (million) Forecast, by Application 2020 & 2033
- Table 44: Italy Laser Power and Energy Meters Volume (K) Forecast, by Application 2020 & 2033
- Table 45: Spain Laser Power and Energy Meters Revenue (million) Forecast, by Application 2020 & 2033
- Table 46: Spain Laser Power and Energy Meters Volume (K) Forecast, by Application 2020 & 2033
- Table 47: Russia Laser Power and Energy Meters Revenue (million) Forecast, by Application 2020 & 2033
- Table 48: Russia Laser Power and Energy Meters Volume (K) Forecast, by Application 2020 & 2033
- Table 49: Benelux Laser Power and Energy Meters Revenue (million) Forecast, by Application 2020 & 2033
- Table 50: Benelux Laser Power and Energy Meters Volume (K) Forecast, by Application 2020 & 2033
- Table 51: Nordics Laser Power and Energy Meters Revenue (million) Forecast, by Application 2020 & 2033
- Table 52: Nordics Laser Power and Energy Meters Volume (K) Forecast, by Application 2020 & 2033
- Table 53: Rest of Europe Laser Power and Energy Meters Revenue (million) Forecast, by Application 2020 & 2033
- Table 54: Rest of Europe Laser Power and Energy Meters Volume (K) Forecast, by Application 2020 & 2033
- Table 55: Global Laser Power and Energy Meters Revenue million Forecast, by Application 2020 & 2033
- Table 56: Global Laser Power and Energy Meters Volume K Forecast, by Application 2020 & 2033
- Table 57: Global Laser Power and Energy Meters Revenue million Forecast, by Types 2020 & 2033
- Table 58: Global Laser Power and Energy Meters Volume K Forecast, by Types 2020 & 2033
- Table 59: Global Laser Power and Energy Meters Revenue million Forecast, by Country 2020 & 2033
- Table 60: Global Laser Power and Energy Meters Volume K Forecast, by Country 2020 & 2033
- Table 61: Turkey Laser Power and Energy Meters Revenue (million) Forecast, by Application 2020 & 2033
- Table 62: Turkey Laser Power and Energy Meters Volume (K) Forecast, by Application 2020 & 2033
- Table 63: Israel Laser Power and Energy Meters Revenue (million) Forecast, by Application 2020 & 2033
- Table 64: Israel Laser Power and Energy Meters Volume (K) Forecast, by Application 2020 & 2033
- Table 65: GCC Laser Power and Energy Meters Revenue (million) Forecast, by Application 2020 & 2033
- Table 66: GCC Laser Power and Energy Meters Volume (K) Forecast, by Application 2020 & 2033
- Table 67: North Africa Laser Power and Energy Meters Revenue (million) Forecast, by Application 2020 & 2033
- Table 68: North Africa Laser Power and Energy Meters Volume (K) Forecast, by Application 2020 & 2033
- Table 69: South Africa Laser Power and Energy Meters Revenue (million) Forecast, by Application 2020 & 2033
- Table 70: South Africa Laser Power and Energy Meters Volume (K) Forecast, by Application 2020 & 2033
- Table 71: Rest of Middle East & Africa Laser Power and Energy Meters Revenue (million) Forecast, by Application 2020 & 2033
- Table 72: Rest of Middle East & Africa Laser Power and Energy Meters Volume (K) Forecast, by Application 2020 & 2033
- Table 73: Global Laser Power and Energy Meters Revenue million Forecast, by Application 2020 & 2033
- Table 74: Global Laser Power and Energy Meters Volume K Forecast, by Application 2020 & 2033
- Table 75: Global Laser Power and Energy Meters Revenue million Forecast, by Types 2020 & 2033
- Table 76: Global Laser Power and Energy Meters Volume K Forecast, by Types 2020 & 2033
- Table 77: Global Laser Power and Energy Meters Revenue million Forecast, by Country 2020 & 2033
- Table 78: Global Laser Power and Energy Meters Volume K Forecast, by Country 2020 & 2033
- Table 79: China Laser Power and Energy Meters Revenue (million) Forecast, by Application 2020 & 2033
- Table 80: China Laser Power and Energy Meters Volume (K) Forecast, by Application 2020 & 2033
- Table 81: India Laser Power and Energy Meters Revenue (million) Forecast, by Application 2020 & 2033
- Table 82: India Laser Power and Energy Meters Volume (K) Forecast, by Application 2020 & 2033
- Table 83: Japan Laser Power and Energy Meters Revenue (million) Forecast, by Application 2020 & 2033
- Table 84: Japan Laser Power and Energy Meters Volume (K) Forecast, by Application 2020 & 2033
- Table 85: South Korea Laser Power and Energy Meters Revenue (million) Forecast, by Application 2020 & 2033
- Table 86: South Korea Laser Power and Energy Meters Volume (K) Forecast, by Application 2020 & 2033
- Table 87: ASEAN Laser Power and Energy Meters Revenue (million) Forecast, by Application 2020 & 2033
- Table 88: ASEAN Laser Power and Energy Meters Volume (K) Forecast, by Application 2020 & 2033
- Table 89: Oceania Laser Power and Energy Meters Revenue (million) Forecast, by Application 2020 & 2033
- Table 90: Oceania Laser Power and Energy Meters Volume (K) Forecast, by Application 2020 & 2033
- Table 91: Rest of Asia Pacific Laser Power and Energy Meters Revenue (million) Forecast, by Application 2020 & 2033
- Table 92: Rest of Asia Pacific Laser Power and Energy Meters Volume (K) Forecast, by Application 2020 & 2033
Frequently Asked Questions
1. What is the projected Compound Annual Growth Rate (CAGR) of the Laser Power and Energy Meters?
The projected CAGR is approximately 9.9%.
2. Which companies are prominent players in the Laser Power and Energy Meters?
Key companies in the market include Coherent, Edmund Optics, MKS Instruments Ophir, Thorlabs, Gentec-EO, Laserpoint, MKS Instruments Newport, Optosigma.
3. What are the main segments of the Laser Power and Energy Meters?
The market segments include Application, Types.
4. Can you provide details about the market size?
The market size is estimated to be USD 948.44 million as of 2022.
5. What are some drivers contributing to market growth?
N/A
6. What are the notable trends driving market growth?
N/A
7. Are there any restraints impacting market growth?
N/A
8. Can you provide examples of recent developments in the market?
N/A
9. What pricing options are available for accessing the report?
Pricing options include single-user, multi-user, and enterprise licenses priced at USD 3950.00, USD 5925.00, and USD 7900.00 respectively.
10. Is the market size provided in terms of value or volume?
The market size is provided in terms of value, measured in million and volume, measured in K.
11. Are there any specific market keywords associated with the report?
Yes, the market keyword associated with the report is "Laser Power and Energy Meters," which aids in identifying and referencing the specific market segment covered.
12. How do I determine which pricing option suits my needs best?
The pricing options vary based on user requirements and access needs. Individual users may opt for single-user licenses, while businesses requiring broader access may choose multi-user or enterprise licenses for cost-effective access to the report.
13. Are there any additional resources or data provided in the Laser Power and Energy Meters report?
While the report offers comprehensive insights, it's advisable to review the specific contents or supplementary materials provided to ascertain if additional resources or data are available.
14. How can I stay updated on further developments or reports in the Laser Power and Energy Meters?
To stay informed about further developments, trends, and reports in the Laser Power and Energy Meters, consider subscribing to industry newsletters, following relevant companies and organizations, or regularly checking reputable industry news sources and publications.
Methodology
Step 1 - Identification of Relevant Samples Size from Population Database


Step 2 - Approaches for Defining Global Market Size (Value, Volume* & Price*)

Note*: In applicable scenarios
Step 3 - Data Sources
Primary Research
- Web Analytics
- Survey Reports
- Research Institute
- Latest Research Reports
- Opinion Leaders
Secondary Research
- Annual Reports
- White Paper
- Latest Press Release
- Industry Association
- Paid Database
- Investor Presentations

Step 4 - Data Triangulation
Involves using different sources of information in order to increase the validity of a study
These sources are likely to be stakeholders in a program - participants, other researchers, program staff, other community members, and so on.
Then we put all data in single framework & apply various statistical tools to find out the dynamic on the market.
During the analysis stage, feedback from the stakeholder groups would be compared to determine areas of agreement as well as areas of divergence