

Key Insights
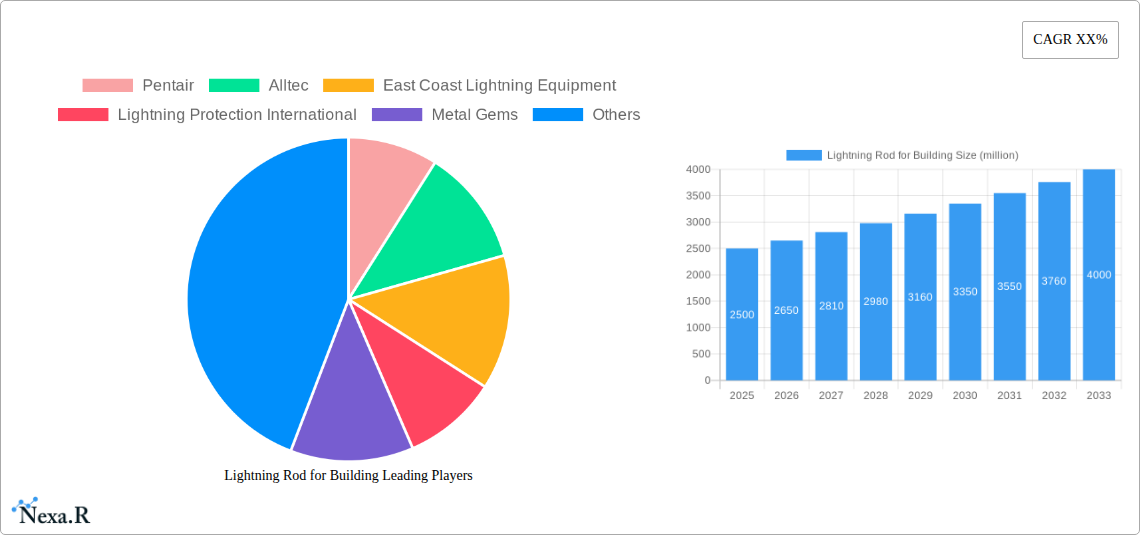
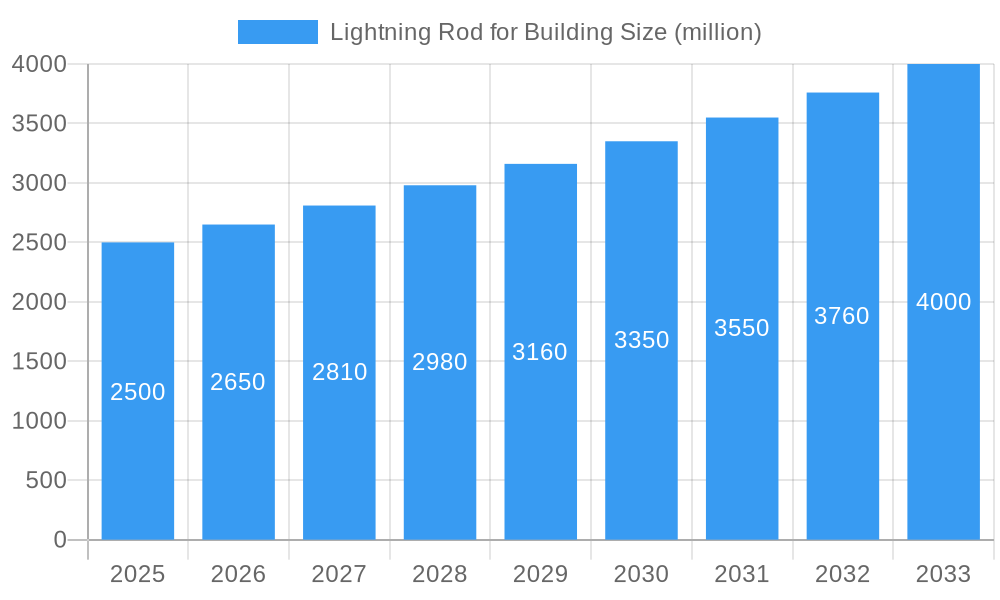
The global lightning rod for building market is experiencing robust growth, driven by increasing awareness of lightning strike risks and stringent building codes mandating lightning protection systems in various regions. The market, estimated at $2.5 billion in 2025, is projected to witness a Compound Annual Growth Rate (CAGR) of 6% between 2025 and 2033, reaching approximately $4 billion by 2033. Key drivers include rising construction activities globally, particularly in developing economies experiencing rapid urbanization. Furthermore, the increasing adoption of advanced lightning protection technologies, such as early streamer emission (ESE) air terminals and sophisticated grounding systems, is fueling market expansion. Trends toward smart building technologies and IoT integration within lightning protection systems further enhance market potential. However, high initial investment costs for sophisticated systems and the occasional lack of skilled installation personnel pose certain restraints on broader market penetration, particularly in smaller projects and less developed regions. The market is segmented by product type (air terminals, down conductors, grounding systems), building type (residential, commercial, industrial), and region. Leading companies like Pentair, ABB Furse, Schneider Electric, and DEHN are driving innovation and expanding their market presence through strategic partnerships and product diversification.
Lightning Rod for Building Market Size (In Billion)
The competitive landscape features both established global players and regional manufacturers. Global players benefit from established brand recognition, extensive distribution networks, and a diverse product portfolio. Regional players, on the other hand, often focus on cost-effective solutions tailored to specific regional needs. The increasing adoption of sustainable and eco-friendly materials in lightning rod manufacturing also presents a significant opportunity for market expansion. Future growth will be heavily influenced by government regulations, technological advancements, and the increasing integration of lightning protection systems into overall building management solutions. The market's growth trajectory is expected to remain positive, propelled by the persistent need for reliable and effective lightning protection across various building types and geographical locations.
Lightning Rod for Building Company Market Share
Lightning Rod for Building Market: A Comprehensive Report (2019-2033)
This comprehensive report provides an in-depth analysis of the global lightning rod for building market, encompassing market dynamics, growth trends, regional analysis, competitive landscape, and future outlook. The study period covers 2019-2033, with 2025 serving as the base and estimated year. The forecast period spans 2025-2033, and the historical period encompasses 2019-2024. This report is crucial for building contractors, electrical engineers, facility managers, insurance providers, and investors seeking to understand and capitalize on this vital sector of the building and construction industry (parent market) and the lightning protection systems market (child market).
Lightning Rod for Building Market Dynamics & Structure
The global lightning rod for building market is characterized by a moderately consolidated structure with key players holding significant market share. Market concentration is expected to remain relatively stable, albeit with potential shifts due to mergers and acquisitions (M&A). Technological innovation, primarily focused on enhancing lightning protection efficiency and integrating smart technologies, is a key driver. Stringent building codes and safety regulations globally influence market growth, while the presence of alternative protection methods presents a competitive challenge. End-user demographics largely consist of commercial, industrial, and residential building owners, with varying adoption rates based on risk assessment and budget. The report analyzes recent M&A activity, estimating approximately xx million USD in deals over the historical period (2019-2024).
- Market Concentration: Moderately Consolidated (xx% market share held by top 5 players in 2025)
- Technological Innovation: Focus on early streamer emission (ESE) technology, surge protection devices (SPD), and integrated monitoring systems.
- Regulatory Framework: Stringent building codes in developed nations, increasing adoption of standards in developing economies.
- Competitive Substitutes: Surge protection devices, Faraday cages, other passive and active protection systems.
- End-User Demographics: Commercial (45%), Industrial (35%), Residential (20%) (2025 estimates)
- M&A Trends: xx major M&A deals in the last five years, driving consolidation and technological integration.
Lightning Rod for Building Growth Trends & Insights
The global lightning rod for building market experienced robust growth during the historical period (2019-2024), with a CAGR of xx%. This growth is attributed to rising construction activities globally, increasing awareness of lightning strike risks, and stringent safety regulations. The market is further propelled by technological advancements leading to enhanced product performance and reliability, coupled with a growing demand for smart and integrated lightning protection systems. Adoption rates are particularly high in regions prone to frequent lightning strikes, driving regional disparities. Consumer behavior is shifting towards solutions that offer long-term protection and minimal maintenance. The report projects a CAGR of xx% for the forecast period (2025-2033), driven by infrastructure development in emerging economies and increased investments in renewable energy projects (solar panels, wind turbines) that benefit from enhanced lightning protection. Market penetration is expected to reach xx% by 2033.
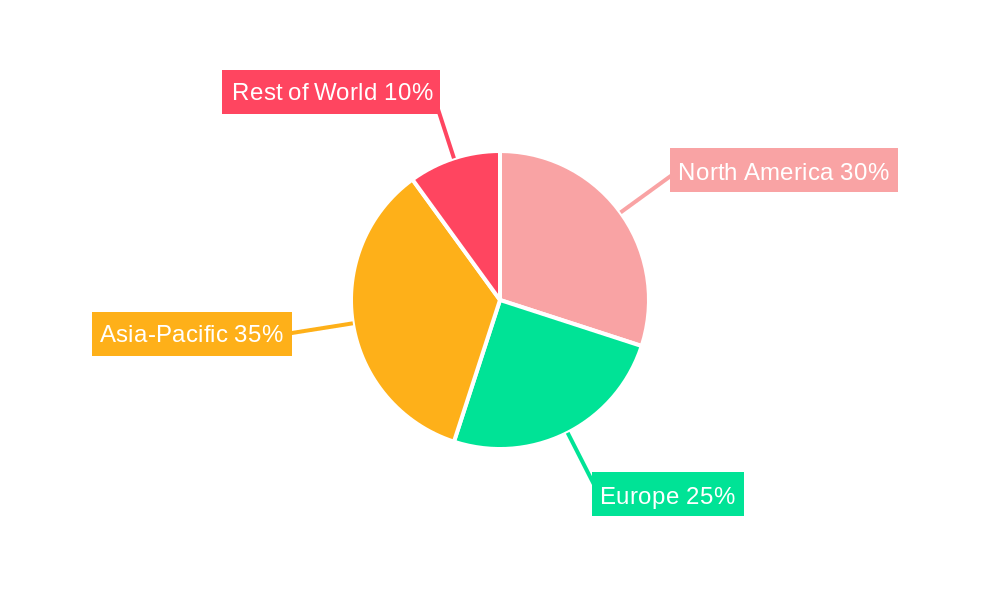
Dominant Regions, Countries, or Segments in Lightning Rod for Building
North America and Europe currently dominate the market, driven by stringent building codes and high awareness of lightning risks. However, Asia-Pacific is emerging as a significant growth region due to rapid urbanization, industrialization, and infrastructure development. Within these regions, specific countries like the US, China, Germany, and India are key contributors to market growth. The commercial building segment holds the largest market share, followed by the industrial and residential segments.
- Key Drivers (North America): Stringent building codes, high insurance penetration, awareness of lightning damage costs.
- Key Drivers (Asia-Pacific): Rapid urbanization, infrastructure development, increasing investment in renewable energy.
- Key Drivers (Europe): Stringent safety regulations, adoption of advanced technologies, established building codes.
- Market Share: North America (xx%), Europe (xx%), Asia-Pacific (xx%), Rest of World (xx%) (2025 estimates)
Lightning Rod for Building Product Landscape
Lightning rod systems vary in design and material (copper, stainless steel), with recent innovations focusing on early streamer emission (ESE) air terminals for enhanced protection range. These systems are increasingly integrated with surge protection devices (SPDs) and remote monitoring capabilities. Unique selling propositions revolve around enhanced protection radius, ease of installation, and long-term reliability. Technological advancements include the use of composite materials, improved grounding systems, and advanced data analytics for lightning strike risk assessment.
Key Drivers, Barriers & Challenges in Lightning Rod for Building
Key Drivers: Increased awareness about lightning strike risks, stringent building codes, growing adoption of renewable energy technologies, and infrastructure development in emerging markets.
Key Challenges: High initial investment costs, potential for system failures due to corrosion or damage, and competition from alternative protection methods. Supply chain disruptions have also impacted production and availability of certain components, leading to estimated xx% increase in costs in 2024. Regulatory hurdles in certain regions further complicate market entry for new players.
Emerging Opportunities in Lightning Rod for Building
Emerging opportunities lie in the integration of smart technologies (IoT sensors, data analytics) for real-time monitoring and predictive maintenance. Untapped markets exist in developing countries with growing infrastructure needs. The demand for lightning protection systems for renewable energy installations (solar farms, wind turbines) presents a significant growth avenue. Furthermore, there is potential for developing specialized lightning protection solutions for unique building structures (skyscrapers, historical buildings).
Growth Accelerators in the Lightning Rod for Building Industry
Technological breakthroughs in ESE technology, improved materials, and enhanced monitoring systems are accelerating market growth. Strategic partnerships between manufacturers and installers expand market reach and provide comprehensive solutions. Expanding into emerging markets, particularly in Africa and Latin America, also presents lucrative opportunities. Government initiatives promoting building safety and disaster preparedness further fuel market expansion.
Key Players Shaping the Lightning Rod for Building Market
- Pentair
- Alltec
- East Coast Lightning Equipment
- Lightning Protection International
- Metal Gems
- Robbins Lightning
- NVent Erico
- OBO Bettermann
- DEHN
- ABB Furse
- Phoenix Contact
- Schneider Electric
- Citel
- AN Wallis
- Sichuan Zhongguang
- VFC
- Guangxi Dikai
- Gersan Elektrik
- Harger Lightning & Grounding
- Chengdu Pedaro
- Lightning Master
Notable Milestones in Lightning Rod for Building Sector
- 2020: Introduction of a new ESE air terminal technology by DEHN, significantly improving protection range.
- 2021: Merger between two leading manufacturers, resulting in increased market share and expanded product portfolio.
- 2022: Launch of a remote monitoring system for lightning rod systems by ABB Furse, enhancing preventative maintenance capabilities.
- 2023: Implementation of stricter building codes in several countries, boosting demand for certified lightning protection systems.
- 2024: Significant supply chain disruptions impacting production and increasing prices.
In-Depth Lightning Rod for Building Market Outlook
The future of the lightning rod for building market is bright, driven by technological advancements, sustainable development initiatives, and the rising need for robust lightning protection. Strategic collaborations, market expansion into untapped regions, and the development of integrated, smart protection systems will shape future growth. The market's long-term potential is significant, particularly in regions experiencing rapid urbanization and industrialization, where the demand for advanced and reliable lightning protection solutions is steadily increasing. Investing in research and development, coupled with proactive regulatory compliance, will be crucial for companies to sustain growth in the long term.
Lightning Rod for Building Segmentation
-
1. Application
- 1.1. Residential Building
- 1.2. Commercial Building
- 1.3. Industrial Building
-
2. Types
- 2.1. Hollow Lightning Rod
- 2.2. Solid Lightning Rod
Lightning Rod for Building Segmentation By Geography
-
1. North America
- 1.1. United States
- 1.2. Canada
- 1.3. Mexico
-
2. South America
- 2.1. Brazil
- 2.2. Argentina
- 2.3. Rest of South America
-
3. Europe
- 3.1. United Kingdom
- 3.2. Germany
- 3.3. France
- 3.4. Italy
- 3.5. Spain
- 3.6. Russia
- 3.7. Benelux
- 3.8. Nordics
- 3.9. Rest of Europe
-
4. Middle East & Africa
- 4.1. Turkey
- 4.2. Israel
- 4.3. GCC
- 4.4. North Africa
- 4.5. South Africa
- 4.6. Rest of Middle East & Africa
-
5. Asia Pacific
- 5.1. China
- 5.2. India
- 5.3. Japan
- 5.4. South Korea
- 5.5. ASEAN
- 5.6. Oceania
- 5.7. Rest of Asia Pacific
Lightning Rod for Building Regional Market Share
Geographic Coverage of Lightning Rod for Building
Lightning Rod for Building REPORT HIGHLIGHTS
| Aspects | Details |
|---|---|
| Study Period | 2020-2034 |
| Base Year | 2025 |
| Estimated Year | 2026 |
| Forecast Period | 2026-2034 |
| Historical Period | 2020-2025 |
| Growth Rate | CAGR of XX% from 2020-2034 |
| Segmentation |
|
Table of Contents
- 1. Introduction
- 1.1. Research Scope
- 1.2. Market Segmentation
- 1.3. Research Methodology
- 1.4. Definitions and Assumptions
- 2. Executive Summary
- 2.1. Introduction
- 3. Market Dynamics
- 3.1. Introduction
- 3.2. Market Drivers
- 3.3. Market Restrains
- 3.4. Market Trends
- 4. Market Factor Analysis
- 4.1. Porters Five Forces
- 4.2. Supply/Value Chain
- 4.3. PESTEL analysis
- 4.4. Market Entropy
- 4.5. Patent/Trademark Analysis
- 5. Global Lightning Rod for Building Analysis, Insights and Forecast, 2020-2032
- 5.1. Market Analysis, Insights and Forecast - by Application
- 5.1.1. Residential Building
- 5.1.2. Commercial Building
- 5.1.3. Industrial Building
- 5.2. Market Analysis, Insights and Forecast - by Types
- 5.2.1. Hollow Lightning Rod
- 5.2.2. Solid Lightning Rod
- 5.3. Market Analysis, Insights and Forecast - by Region
- 5.3.1. North America
- 5.3.2. South America
- 5.3.3. Europe
- 5.3.4. Middle East & Africa
- 5.3.5. Asia Pacific
- 5.1. Market Analysis, Insights and Forecast - by Application
- 6. North America Lightning Rod for Building Analysis, Insights and Forecast, 2020-2032
- 6.1. Market Analysis, Insights and Forecast - by Application
- 6.1.1. Residential Building
- 6.1.2. Commercial Building
- 6.1.3. Industrial Building
- 6.2. Market Analysis, Insights and Forecast - by Types
- 6.2.1. Hollow Lightning Rod
- 6.2.2. Solid Lightning Rod
- 6.1. Market Analysis, Insights and Forecast - by Application
- 7. South America Lightning Rod for Building Analysis, Insights and Forecast, 2020-2032
- 7.1. Market Analysis, Insights and Forecast - by Application
- 7.1.1. Residential Building
- 7.1.2. Commercial Building
- 7.1.3. Industrial Building
- 7.2. Market Analysis, Insights and Forecast - by Types
- 7.2.1. Hollow Lightning Rod
- 7.2.2. Solid Lightning Rod
- 7.1. Market Analysis, Insights and Forecast - by Application
- 8. Europe Lightning Rod for Building Analysis, Insights and Forecast, 2020-2032
- 8.1. Market Analysis, Insights and Forecast - by Application
- 8.1.1. Residential Building
- 8.1.2. Commercial Building
- 8.1.3. Industrial Building
- 8.2. Market Analysis, Insights and Forecast - by Types
- 8.2.1. Hollow Lightning Rod
- 8.2.2. Solid Lightning Rod
- 8.1. Market Analysis, Insights and Forecast - by Application
- 9. Middle East & Africa Lightning Rod for Building Analysis, Insights and Forecast, 2020-2032
- 9.1. Market Analysis, Insights and Forecast - by Application
- 9.1.1. Residential Building
- 9.1.2. Commercial Building
- 9.1.3. Industrial Building
- 9.2. Market Analysis, Insights and Forecast - by Types
- 9.2.1. Hollow Lightning Rod
- 9.2.2. Solid Lightning Rod
- 9.1. Market Analysis, Insights and Forecast - by Application
- 10. Asia Pacific Lightning Rod for Building Analysis, Insights and Forecast, 2020-2032
- 10.1. Market Analysis, Insights and Forecast - by Application
- 10.1.1. Residential Building
- 10.1.2. Commercial Building
- 10.1.3. Industrial Building
- 10.2. Market Analysis, Insights and Forecast - by Types
- 10.2.1. Hollow Lightning Rod
- 10.2.2. Solid Lightning Rod
- 10.1. Market Analysis, Insights and Forecast - by Application
- 11. Competitive Analysis
- 11.1. Global Market Share Analysis 2025
- 11.2. Company Profiles
- 11.2.1 Pentair
- 11.2.1.1. Overview
- 11.2.1.2. Products
- 11.2.1.3. SWOT Analysis
- 11.2.1.4. Recent Developments
- 11.2.1.5. Financials (Based on Availability)
- 11.2.2 Alltec
- 11.2.2.1. Overview
- 11.2.2.2. Products
- 11.2.2.3. SWOT Analysis
- 11.2.2.4. Recent Developments
- 11.2.2.5. Financials (Based on Availability)
- 11.2.3 East Coast Lightning Equipment
- 11.2.3.1. Overview
- 11.2.3.2. Products
- 11.2.3.3. SWOT Analysis
- 11.2.3.4. Recent Developments
- 11.2.3.5. Financials (Based on Availability)
- 11.2.4 Lightning Protection International
- 11.2.4.1. Overview
- 11.2.4.2. Products
- 11.2.4.3. SWOT Analysis
- 11.2.4.4. Recent Developments
- 11.2.4.5. Financials (Based on Availability)
- 11.2.5 Metal Gems
- 11.2.5.1. Overview
- 11.2.5.2. Products
- 11.2.5.3. SWOT Analysis
- 11.2.5.4. Recent Developments
- 11.2.5.5. Financials (Based on Availability)
- 11.2.6 Robbins Lightning
- 11.2.6.1. Overview
- 11.2.6.2. Products
- 11.2.6.3. SWOT Analysis
- 11.2.6.4. Recent Developments
- 11.2.6.5. Financials (Based on Availability)
- 11.2.7 NVent Erico
- 11.2.7.1. Overview
- 11.2.7.2. Products
- 11.2.7.3. SWOT Analysis
- 11.2.7.4. Recent Developments
- 11.2.7.5. Financials (Based on Availability)
- 11.2.8 OBO Bettermann
- 11.2.8.1. Overview
- 11.2.8.2. Products
- 11.2.8.3. SWOT Analysis
- 11.2.8.4. Recent Developments
- 11.2.8.5. Financials (Based on Availability)
- 11.2.9 DEHN
- 11.2.9.1. Overview
- 11.2.9.2. Products
- 11.2.9.3. SWOT Analysis
- 11.2.9.4. Recent Developments
- 11.2.9.5. Financials (Based on Availability)
- 11.2.10 ABB Furse
- 11.2.10.1. Overview
- 11.2.10.2. Products
- 11.2.10.3. SWOT Analysis
- 11.2.10.4. Recent Developments
- 11.2.10.5. Financials (Based on Availability)
- 11.2.11 Phoenix Contact
- 11.2.11.1. Overview
- 11.2.11.2. Products
- 11.2.11.3. SWOT Analysis
- 11.2.11.4. Recent Developments
- 11.2.11.5. Financials (Based on Availability)
- 11.2.12 Schneider Electric
- 11.2.12.1. Overview
- 11.2.12.2. Products
- 11.2.12.3. SWOT Analysis
- 11.2.12.4. Recent Developments
- 11.2.12.5. Financials (Based on Availability)
- 11.2.13 Citel
- 11.2.13.1. Overview
- 11.2.13.2. Products
- 11.2.13.3. SWOT Analysis
- 11.2.13.4. Recent Developments
- 11.2.13.5. Financials (Based on Availability)
- 11.2.14 AN Wallis
- 11.2.14.1. Overview
- 11.2.14.2. Products
- 11.2.14.3. SWOT Analysis
- 11.2.14.4. Recent Developments
- 11.2.14.5. Financials (Based on Availability)
- 11.2.15 Sichuan Zhongguang
- 11.2.15.1. Overview
- 11.2.15.2. Products
- 11.2.15.3. SWOT Analysis
- 11.2.15.4. Recent Developments
- 11.2.15.5. Financials (Based on Availability)
- 11.2.16 VFC
- 11.2.16.1. Overview
- 11.2.16.2. Products
- 11.2.16.3. SWOT Analysis
- 11.2.16.4. Recent Developments
- 11.2.16.5. Financials (Based on Availability)
- 11.2.17 Guangxi Dikai
- 11.2.17.1. Overview
- 11.2.17.2. Products
- 11.2.17.3. SWOT Analysis
- 11.2.17.4. Recent Developments
- 11.2.17.5. Financials (Based on Availability)
- 11.2.18 Gersan Elektrik
- 11.2.18.1. Overview
- 11.2.18.2. Products
- 11.2.18.3. SWOT Analysis
- 11.2.18.4. Recent Developments
- 11.2.18.5. Financials (Based on Availability)
- 11.2.19 Harger Lightning & Grounding
- 11.2.19.1. Overview
- 11.2.19.2. Products
- 11.2.19.3. SWOT Analysis
- 11.2.19.4. Recent Developments
- 11.2.19.5. Financials (Based on Availability)
- 11.2.20 Chengdu Pedaro
- 11.2.20.1. Overview
- 11.2.20.2. Products
- 11.2.20.3. SWOT Analysis
- 11.2.20.4. Recent Developments
- 11.2.20.5. Financials (Based on Availability)
- 11.2.21 Lightning Master
- 11.2.21.1. Overview
- 11.2.21.2. Products
- 11.2.21.3. SWOT Analysis
- 11.2.21.4. Recent Developments
- 11.2.21.5. Financials (Based on Availability)
- 11.2.1 Pentair
List of Figures
- Figure 1: Global Lightning Rod for Building Revenue Breakdown (million, %) by Region 2025 & 2033
- Figure 2: Global Lightning Rod for Building Volume Breakdown (K, %) by Region 2025 & 2033
- Figure 3: North America Lightning Rod for Building Revenue (million), by Application 2025 & 2033
- Figure 4: North America Lightning Rod for Building Volume (K), by Application 2025 & 2033
- Figure 5: North America Lightning Rod for Building Revenue Share (%), by Application 2025 & 2033
- Figure 6: North America Lightning Rod for Building Volume Share (%), by Application 2025 & 2033
- Figure 7: North America Lightning Rod for Building Revenue (million), by Types 2025 & 2033
- Figure 8: North America Lightning Rod for Building Volume (K), by Types 2025 & 2033
- Figure 9: North America Lightning Rod for Building Revenue Share (%), by Types 2025 & 2033
- Figure 10: North America Lightning Rod for Building Volume Share (%), by Types 2025 & 2033
- Figure 11: North America Lightning Rod for Building Revenue (million), by Country 2025 & 2033
- Figure 12: North America Lightning Rod for Building Volume (K), by Country 2025 & 2033
- Figure 13: North America Lightning Rod for Building Revenue Share (%), by Country 2025 & 2033
- Figure 14: North America Lightning Rod for Building Volume Share (%), by Country 2025 & 2033
- Figure 15: South America Lightning Rod for Building Revenue (million), by Application 2025 & 2033
- Figure 16: South America Lightning Rod for Building Volume (K), by Application 2025 & 2033
- Figure 17: South America Lightning Rod for Building Revenue Share (%), by Application 2025 & 2033
- Figure 18: South America Lightning Rod for Building Volume Share (%), by Application 2025 & 2033
- Figure 19: South America Lightning Rod for Building Revenue (million), by Types 2025 & 2033
- Figure 20: South America Lightning Rod for Building Volume (K), by Types 2025 & 2033
- Figure 21: South America Lightning Rod for Building Revenue Share (%), by Types 2025 & 2033
- Figure 22: South America Lightning Rod for Building Volume Share (%), by Types 2025 & 2033
- Figure 23: South America Lightning Rod for Building Revenue (million), by Country 2025 & 2033
- Figure 24: South America Lightning Rod for Building Volume (K), by Country 2025 & 2033
- Figure 25: South America Lightning Rod for Building Revenue Share (%), by Country 2025 & 2033
- Figure 26: South America Lightning Rod for Building Volume Share (%), by Country 2025 & 2033
- Figure 27: Europe Lightning Rod for Building Revenue (million), by Application 2025 & 2033
- Figure 28: Europe Lightning Rod for Building Volume (K), by Application 2025 & 2033
- Figure 29: Europe Lightning Rod for Building Revenue Share (%), by Application 2025 & 2033
- Figure 30: Europe Lightning Rod for Building Volume Share (%), by Application 2025 & 2033
- Figure 31: Europe Lightning Rod for Building Revenue (million), by Types 2025 & 2033
- Figure 32: Europe Lightning Rod for Building Volume (K), by Types 2025 & 2033
- Figure 33: Europe Lightning Rod for Building Revenue Share (%), by Types 2025 & 2033
- Figure 34: Europe Lightning Rod for Building Volume Share (%), by Types 2025 & 2033
- Figure 35: Europe Lightning Rod for Building Revenue (million), by Country 2025 & 2033
- Figure 36: Europe Lightning Rod for Building Volume (K), by Country 2025 & 2033
- Figure 37: Europe Lightning Rod for Building Revenue Share (%), by Country 2025 & 2033
- Figure 38: Europe Lightning Rod for Building Volume Share (%), by Country 2025 & 2033
- Figure 39: Middle East & Africa Lightning Rod for Building Revenue (million), by Application 2025 & 2033
- Figure 40: Middle East & Africa Lightning Rod for Building Volume (K), by Application 2025 & 2033
- Figure 41: Middle East & Africa Lightning Rod for Building Revenue Share (%), by Application 2025 & 2033
- Figure 42: Middle East & Africa Lightning Rod for Building Volume Share (%), by Application 2025 & 2033
- Figure 43: Middle East & Africa Lightning Rod for Building Revenue (million), by Types 2025 & 2033
- Figure 44: Middle East & Africa Lightning Rod for Building Volume (K), by Types 2025 & 2033
- Figure 45: Middle East & Africa Lightning Rod for Building Revenue Share (%), by Types 2025 & 2033
- Figure 46: Middle East & Africa Lightning Rod for Building Volume Share (%), by Types 2025 & 2033
- Figure 47: Middle East & Africa Lightning Rod for Building Revenue (million), by Country 2025 & 2033
- Figure 48: Middle East & Africa Lightning Rod for Building Volume (K), by Country 2025 & 2033
- Figure 49: Middle East & Africa Lightning Rod for Building Revenue Share (%), by Country 2025 & 2033
- Figure 50: Middle East & Africa Lightning Rod for Building Volume Share (%), by Country 2025 & 2033
- Figure 51: Asia Pacific Lightning Rod for Building Revenue (million), by Application 2025 & 2033
- Figure 52: Asia Pacific Lightning Rod for Building Volume (K), by Application 2025 & 2033
- Figure 53: Asia Pacific Lightning Rod for Building Revenue Share (%), by Application 2025 & 2033
- Figure 54: Asia Pacific Lightning Rod for Building Volume Share (%), by Application 2025 & 2033
- Figure 55: Asia Pacific Lightning Rod for Building Revenue (million), by Types 2025 & 2033
- Figure 56: Asia Pacific Lightning Rod for Building Volume (K), by Types 2025 & 2033
- Figure 57: Asia Pacific Lightning Rod for Building Revenue Share (%), by Types 2025 & 2033
- Figure 58: Asia Pacific Lightning Rod for Building Volume Share (%), by Types 2025 & 2033
- Figure 59: Asia Pacific Lightning Rod for Building Revenue (million), by Country 2025 & 2033
- Figure 60: Asia Pacific Lightning Rod for Building Volume (K), by Country 2025 & 2033
- Figure 61: Asia Pacific Lightning Rod for Building Revenue Share (%), by Country 2025 & 2033
- Figure 62: Asia Pacific Lightning Rod for Building Volume Share (%), by Country 2025 & 2033
List of Tables
- Table 1: Global Lightning Rod for Building Revenue million Forecast, by Application 2020 & 2033
- Table 2: Global Lightning Rod for Building Volume K Forecast, by Application 2020 & 2033
- Table 3: Global Lightning Rod for Building Revenue million Forecast, by Types 2020 & 2033
- Table 4: Global Lightning Rod for Building Volume K Forecast, by Types 2020 & 2033
- Table 5: Global Lightning Rod for Building Revenue million Forecast, by Region 2020 & 2033
- Table 6: Global Lightning Rod for Building Volume K Forecast, by Region 2020 & 2033
- Table 7: Global Lightning Rod for Building Revenue million Forecast, by Application 2020 & 2033
- Table 8: Global Lightning Rod for Building Volume K Forecast, by Application 2020 & 2033
- Table 9: Global Lightning Rod for Building Revenue million Forecast, by Types 2020 & 2033
- Table 10: Global Lightning Rod for Building Volume K Forecast, by Types 2020 & 2033
- Table 11: Global Lightning Rod for Building Revenue million Forecast, by Country 2020 & 2033
- Table 12: Global Lightning Rod for Building Volume K Forecast, by Country 2020 & 2033
- Table 13: United States Lightning Rod for Building Revenue (million) Forecast, by Application 2020 & 2033
- Table 14: United States Lightning Rod for Building Volume (K) Forecast, by Application 2020 & 2033
- Table 15: Canada Lightning Rod for Building Revenue (million) Forecast, by Application 2020 & 2033
- Table 16: Canada Lightning Rod for Building Volume (K) Forecast, by Application 2020 & 2033
- Table 17: Mexico Lightning Rod for Building Revenue (million) Forecast, by Application 2020 & 2033
- Table 18: Mexico Lightning Rod for Building Volume (K) Forecast, by Application 2020 & 2033
- Table 19: Global Lightning Rod for Building Revenue million Forecast, by Application 2020 & 2033
- Table 20: Global Lightning Rod for Building Volume K Forecast, by Application 2020 & 2033
- Table 21: Global Lightning Rod for Building Revenue million Forecast, by Types 2020 & 2033
- Table 22: Global Lightning Rod for Building Volume K Forecast, by Types 2020 & 2033
- Table 23: Global Lightning Rod for Building Revenue million Forecast, by Country 2020 & 2033
- Table 24: Global Lightning Rod for Building Volume K Forecast, by Country 2020 & 2033
- Table 25: Brazil Lightning Rod for Building Revenue (million) Forecast, by Application 2020 & 2033
- Table 26: Brazil Lightning Rod for Building Volume (K) Forecast, by Application 2020 & 2033
- Table 27: Argentina Lightning Rod for Building Revenue (million) Forecast, by Application 2020 & 2033
- Table 28: Argentina Lightning Rod for Building Volume (K) Forecast, by Application 2020 & 2033
- Table 29: Rest of South America Lightning Rod for Building Revenue (million) Forecast, by Application 2020 & 2033
- Table 30: Rest of South America Lightning Rod for Building Volume (K) Forecast, by Application 2020 & 2033
- Table 31: Global Lightning Rod for Building Revenue million Forecast, by Application 2020 & 2033
- Table 32: Global Lightning Rod for Building Volume K Forecast, by Application 2020 & 2033
- Table 33: Global Lightning Rod for Building Revenue million Forecast, by Types 2020 & 2033
- Table 34: Global Lightning Rod for Building Volume K Forecast, by Types 2020 & 2033
- Table 35: Global Lightning Rod for Building Revenue million Forecast, by Country 2020 & 2033
- Table 36: Global Lightning Rod for Building Volume K Forecast, by Country 2020 & 2033
- Table 37: United Kingdom Lightning Rod for Building Revenue (million) Forecast, by Application 2020 & 2033
- Table 38: United Kingdom Lightning Rod for Building Volume (K) Forecast, by Application 2020 & 2033
- Table 39: Germany Lightning Rod for Building Revenue (million) Forecast, by Application 2020 & 2033
- Table 40: Germany Lightning Rod for Building Volume (K) Forecast, by Application 2020 & 2033
- Table 41: France Lightning Rod for Building Revenue (million) Forecast, by Application 2020 & 2033
- Table 42: France Lightning Rod for Building Volume (K) Forecast, by Application 2020 & 2033
- Table 43: Italy Lightning Rod for Building Revenue (million) Forecast, by Application 2020 & 2033
- Table 44: Italy Lightning Rod for Building Volume (K) Forecast, by Application 2020 & 2033
- Table 45: Spain Lightning Rod for Building Revenue (million) Forecast, by Application 2020 & 2033
- Table 46: Spain Lightning Rod for Building Volume (K) Forecast, by Application 2020 & 2033
- Table 47: Russia Lightning Rod for Building Revenue (million) Forecast, by Application 2020 & 2033
- Table 48: Russia Lightning Rod for Building Volume (K) Forecast, by Application 2020 & 2033
- Table 49: Benelux Lightning Rod for Building Revenue (million) Forecast, by Application 2020 & 2033
- Table 50: Benelux Lightning Rod for Building Volume (K) Forecast, by Application 2020 & 2033
- Table 51: Nordics Lightning Rod for Building Revenue (million) Forecast, by Application 2020 & 2033
- Table 52: Nordics Lightning Rod for Building Volume (K) Forecast, by Application 2020 & 2033
- Table 53: Rest of Europe Lightning Rod for Building Revenue (million) Forecast, by Application 2020 & 2033
- Table 54: Rest of Europe Lightning Rod for Building Volume (K) Forecast, by Application 2020 & 2033
- Table 55: Global Lightning Rod for Building Revenue million Forecast, by Application 2020 & 2033
- Table 56: Global Lightning Rod for Building Volume K Forecast, by Application 2020 & 2033
- Table 57: Global Lightning Rod for Building Revenue million Forecast, by Types 2020 & 2033
- Table 58: Global Lightning Rod for Building Volume K Forecast, by Types 2020 & 2033
- Table 59: Global Lightning Rod for Building Revenue million Forecast, by Country 2020 & 2033
- Table 60: Global Lightning Rod for Building Volume K Forecast, by Country 2020 & 2033
- Table 61: Turkey Lightning Rod for Building Revenue (million) Forecast, by Application 2020 & 2033
- Table 62: Turkey Lightning Rod for Building Volume (K) Forecast, by Application 2020 & 2033
- Table 63: Israel Lightning Rod for Building Revenue (million) Forecast, by Application 2020 & 2033
- Table 64: Israel Lightning Rod for Building Volume (K) Forecast, by Application 2020 & 2033
- Table 65: GCC Lightning Rod for Building Revenue (million) Forecast, by Application 2020 & 2033
- Table 66: GCC Lightning Rod for Building Volume (K) Forecast, by Application 2020 & 2033
- Table 67: North Africa Lightning Rod for Building Revenue (million) Forecast, by Application 2020 & 2033
- Table 68: North Africa Lightning Rod for Building Volume (K) Forecast, by Application 2020 & 2033
- Table 69: South Africa Lightning Rod for Building Revenue (million) Forecast, by Application 2020 & 2033
- Table 70: South Africa Lightning Rod for Building Volume (K) Forecast, by Application 2020 & 2033
- Table 71: Rest of Middle East & Africa Lightning Rod for Building Revenue (million) Forecast, by Application 2020 & 2033
- Table 72: Rest of Middle East & Africa Lightning Rod for Building Volume (K) Forecast, by Application 2020 & 2033
- Table 73: Global Lightning Rod for Building Revenue million Forecast, by Application 2020 & 2033
- Table 74: Global Lightning Rod for Building Volume K Forecast, by Application 2020 & 2033
- Table 75: Global Lightning Rod for Building Revenue million Forecast, by Types 2020 & 2033
- Table 76: Global Lightning Rod for Building Volume K Forecast, by Types 2020 & 2033
- Table 77: Global Lightning Rod for Building Revenue million Forecast, by Country 2020 & 2033
- Table 78: Global Lightning Rod for Building Volume K Forecast, by Country 2020 & 2033
- Table 79: China Lightning Rod for Building Revenue (million) Forecast, by Application 2020 & 2033
- Table 80: China Lightning Rod for Building Volume (K) Forecast, by Application 2020 & 2033
- Table 81: India Lightning Rod for Building Revenue (million) Forecast, by Application 2020 & 2033
- Table 82: India Lightning Rod for Building Volume (K) Forecast, by Application 2020 & 2033
- Table 83: Japan Lightning Rod for Building Revenue (million) Forecast, by Application 2020 & 2033
- Table 84: Japan Lightning Rod for Building Volume (K) Forecast, by Application 2020 & 2033
- Table 85: South Korea Lightning Rod for Building Revenue (million) Forecast, by Application 2020 & 2033
- Table 86: South Korea Lightning Rod for Building Volume (K) Forecast, by Application 2020 & 2033
- Table 87: ASEAN Lightning Rod for Building Revenue (million) Forecast, by Application 2020 & 2033
- Table 88: ASEAN Lightning Rod for Building Volume (K) Forecast, by Application 2020 & 2033
- Table 89: Oceania Lightning Rod for Building Revenue (million) Forecast, by Application 2020 & 2033
- Table 90: Oceania Lightning Rod for Building Volume (K) Forecast, by Application 2020 & 2033
- Table 91: Rest of Asia Pacific Lightning Rod for Building Revenue (million) Forecast, by Application 2020 & 2033
- Table 92: Rest of Asia Pacific Lightning Rod for Building Volume (K) Forecast, by Application 2020 & 2033
Frequently Asked Questions
1. What is the projected Compound Annual Growth Rate (CAGR) of the Lightning Rod for Building?
The projected CAGR is approximately XX%.
2. Which companies are prominent players in the Lightning Rod for Building?
Key companies in the market include Pentair, Alltec, East Coast Lightning Equipment, Lightning Protection International, Metal Gems, Robbins Lightning, NVent Erico, OBO Bettermann, DEHN, ABB Furse, Phoenix Contact, Schneider Electric, Citel, AN Wallis, Sichuan Zhongguang, VFC, Guangxi Dikai, Gersan Elektrik, Harger Lightning & Grounding, Chengdu Pedaro, Lightning Master.
3. What are the main segments of the Lightning Rod for Building?
The market segments include Application, Types.
4. Can you provide details about the market size?
The market size is estimated to be USD XXX million as of 2022.
5. What are some drivers contributing to market growth?
N/A
6. What are the notable trends driving market growth?
N/A
7. Are there any restraints impacting market growth?
N/A
8. Can you provide examples of recent developments in the market?
N/A
9. What pricing options are available for accessing the report?
Pricing options include single-user, multi-user, and enterprise licenses priced at USD 3350.00, USD 5025.00, and USD 6700.00 respectively.
10. Is the market size provided in terms of value or volume?
The market size is provided in terms of value, measured in million and volume, measured in K.
11. Are there any specific market keywords associated with the report?
Yes, the market keyword associated with the report is "Lightning Rod for Building," which aids in identifying and referencing the specific market segment covered.
12. How do I determine which pricing option suits my needs best?
The pricing options vary based on user requirements and access needs. Individual users may opt for single-user licenses, while businesses requiring broader access may choose multi-user or enterprise licenses for cost-effective access to the report.
13. Are there any additional resources or data provided in the Lightning Rod for Building report?
While the report offers comprehensive insights, it's advisable to review the specific contents or supplementary materials provided to ascertain if additional resources or data are available.
14. How can I stay updated on further developments or reports in the Lightning Rod for Building?
To stay informed about further developments, trends, and reports in the Lightning Rod for Building, consider subscribing to industry newsletters, following relevant companies and organizations, or regularly checking reputable industry news sources and publications.
Methodology
Step 1 - Identification of Relevant Samples Size from Population Database


Step 2 - Approaches for Defining Global Market Size (Value, Volume* & Price*)

Note*: In applicable scenarios
Step 3 - Data Sources
Primary Research
- Web Analytics
- Survey Reports
- Research Institute
- Latest Research Reports
- Opinion Leaders
Secondary Research
- Annual Reports
- White Paper
- Latest Press Release
- Industry Association
- Paid Database
- Investor Presentations

Step 4 - Data Triangulation
Involves using different sources of information in order to increase the validity of a study
These sources are likely to be stakeholders in a program - participants, other researchers, program staff, other community members, and so on.
Then we put all data in single framework & apply various statistical tools to find out the dynamic on the market.
During the analysis stage, feedback from the stakeholder groups would be compared to determine areas of agreement as well as areas of divergence