

Key Insights
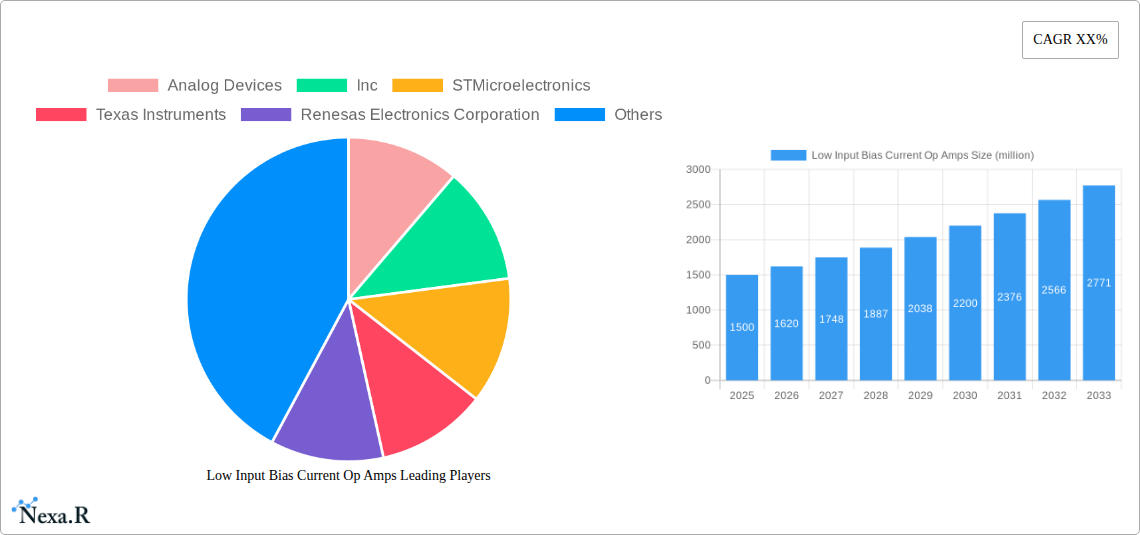
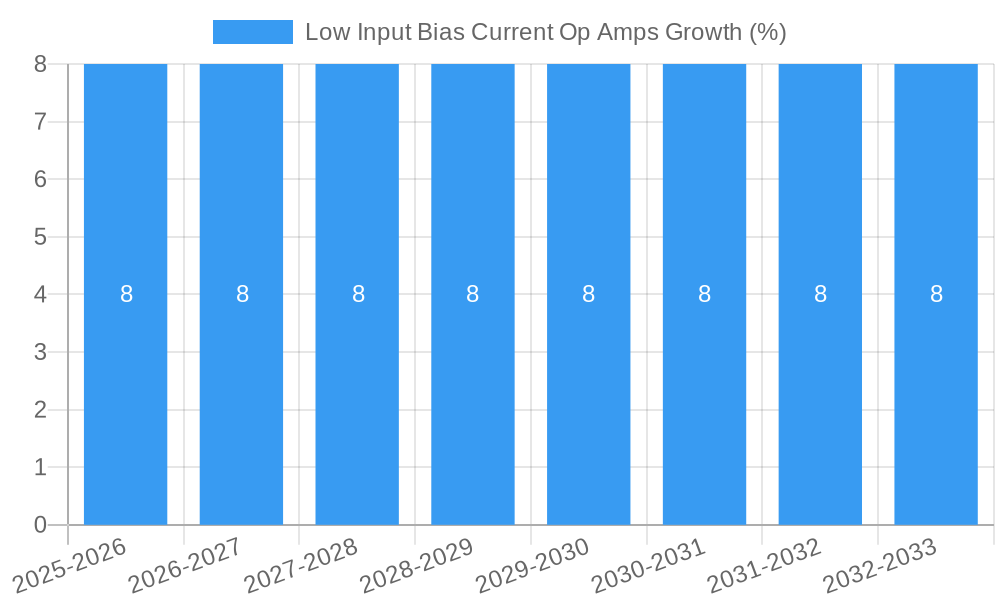
The global market for Low Input Bias Current Op Amps is experiencing robust growth, projected to reach a significant market size of approximately $1.5 billion by 2025 and expand at a Compound Annual Growth Rate (CAGR) of around 8% through 2033. This expansion is primarily fueled by the escalating demand across critical sectors such as automotive, industrial automation, and medical equipment. In the automotive sector, advancements in sensor technology, autonomous driving systems, and electric vehicle battery management are creating a substantial need for precise and low-noise amplification, a forte of these specialized operational amplifiers. Similarly, the industrial segment is witnessing a surge in the adoption of sophisticated control systems, precision measurement instruments, and IoT devices, all of which benefit from the accuracy and minimal signal degradation offered by low input bias current op amps. The medical equipment industry is another major driver, with the increasing complexity of diagnostic tools, patient monitoring systems, and implantable devices requiring high-fidelity signal processing capabilities.
Further contributing to this market's upward trajectory are emerging trends like the miniaturization of electronic components and the growing emphasis on energy efficiency in electronic designs. These trends necessitate op amps that consume less power and occupy less board space while maintaining superior performance characteristics, making Low Input Bias Current Op Amps an indispensable choice for next-generation electronics. However, the market also faces certain restraints, including the relatively higher cost of these specialized components compared to standard op amps, and the intricate design and manufacturing processes involved, which can sometimes lead to supply chain challenges. Despite these hurdles, the relentless innovation in semiconductor technology and the continuous pursuit of enhanced performance in high-value applications are expected to sustain the market's positive momentum. The market segmentation reveals a balanced demand across various applications, with single and dual-channel configurations catering to diverse circuit requirements.
This in-depth report provides a comprehensive analysis of the global Low Input Bias Current Op Amps market, crucial for understanding the intricate dynamics and future trajectory of this high-growth sector. Designed for industry professionals, procurement managers, R&D specialists, and market strategists, this report leverages extensive research and proprietary data to deliver actionable insights. We meticulously examine market segmentation, technological advancements, competitive landscapes, and regional dominance, offering a clear roadmap for strategic decision-making. The report covers the Study Period: 2019–2033, with a Base Year of 2025 and a Forecast Period from 2025–2033.
Low Input Bias Current Op Amps Market Dynamics & Structure
The global Low Input Bias Current Op Amps market exhibits a moderately concentrated structure, with leading players like Analog Devices, Inc., STMicroelectronics, and Texas Instruments holding significant market shares, estimated to be in the range of 15-20% combined. Technological innovation is a primary driver, fueled by the increasing demand for precision and low-power consumption in critical applications such as Automobile, Industrial, and Medical Equipment. For instance, advancements in CMOS and JFET technologies are enabling op-amps with ever-decreasing input bias currents, crucial for sensitive sensor signal conditioning. Regulatory frameworks, particularly those related to automotive safety standards (e.g., ISO 26262) and medical device certifications (e.g., FDA, CE), indirectly influence product development and adoption. Competitive product substitutes, while limited for ultra-low bias current requirements, include discrete transistor configurations for highly specialized niche applications. End-user demographics are evolving, with a growing demand from the Electronics segment, particularly in portable devices and IoT applications. Mergers and acquisitions (M&A) activity, while not exceptionally high, remains a strategic tool for consolidation and market expansion; a few notable acquisitions in the past five years have reshaped market shares, with deal volumes estimated in the tens of millions. Barriers to innovation include the inherent complexity of semiconductor fabrication and the significant R&D investment required for next-generation performance.
Low Input Bias Current Op Amps Growth Trends & Insights
The global Low Input Bias Current Op Amps market is poised for robust expansion, projected to grow at a Compound Annual Growth Rate (CAGR) of approximately 7.5% during the forecast period (2025–2033). The market size, estimated at $1.8 billion in the base year 2025, is expected to reach over $3.2 billion by 2033. This growth is underpinned by an increasing adoption rate across various industries, driven by the relentless pursuit of enhanced accuracy, reduced power consumption, and miniaturization in electronic systems. Technological disruptions, such as the emergence of novel material science for improved semiconductor performance and advanced packaging techniques, are further accelerating market penetration. Consumer behavior shifts, particularly the demand for sophisticated and reliable electronic devices in consumer electronics and wearables, are indirectly influencing the adoption of low input bias current op-amps for their superior signal integrity. The market penetration of these specialized op-amps is steadily increasing, moving beyond traditional high-end applications into more mainstream consumer products. Furthermore, the growing complexity of sensor networks in industrial automation and the Internet of Things (IoT) necessitates op-amps that can accurately process weak signals without significant degradation. The escalating demand for high-performance data acquisition systems in medical imaging and diagnostic equipment also plays a pivotal role in driving market growth.
Dominant Regions, Countries, or Segments in Low Input Bias Current Op Amps
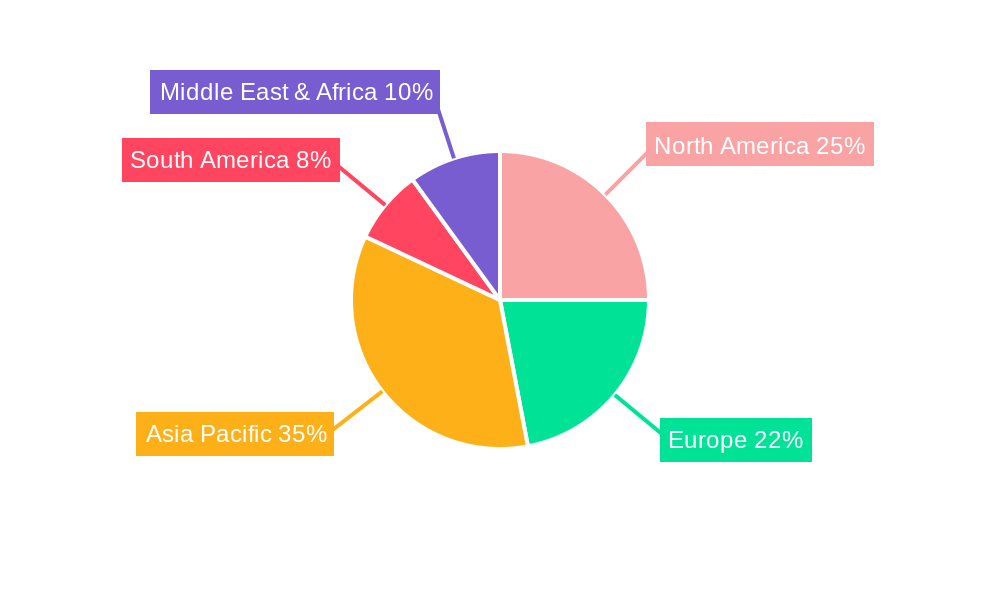
The Automobile segment, particularly for applications in Advanced Driver-Assistance Systems (ADAS), electric vehicle battery management systems, and infotainment, is a primary growth engine for the Low Input Bias Current Op Amps market. This segment is projected to account for an estimated 30% of the total market revenue in 2025, with a projected CAGR of 8.2% during the forecast period. North America and Europe are dominant regions, driven by stringent automotive safety regulations and a high concentration of automotive R&D. For instance, the United States, with its substantial automotive manufacturing base and focus on autonomous driving technology, is a key country driving demand. The increasing adoption of sophisticated sensor suites in vehicles, including LiDAR, radar, and cameras, necessitates high-precision signal conditioning, making low input bias current op-amps indispensable. Economic policies that support the development of advanced manufacturing and R&D, coupled with robust infrastructure for automotive production, further bolster growth. In the Industrial segment, smart manufacturing, predictive maintenance, and process control applications are significant contributors, accounting for approximately 25% of the market. Asia Pacific, particularly China, is emerging as a dominant force due to its expansive manufacturing capabilities and rapid industrial automation. The Electronics segment, encompassing consumer electronics, IoT devices, and telecommunications, represents another significant market share of around 22%, driven by the demand for miniaturized, low-power, and high-performance components. Medical Equipment, with its critical need for accuracy and reliability in diagnostic tools, patient monitoring systems, and implantable devices, contributes approximately 18% to the market. The Single Channel type of op-amp is expected to maintain a dominant share due to its widespread use in various single-purpose sensor interfaces, while Dual Channel variants are gaining traction in applications requiring differential measurements or multiple signal processing paths.
Low Input Bias Current Op Amps Product Landscape
The product landscape for Low Input Bias Current Op Amps is characterized by continuous innovation aimed at achieving progressively lower input bias currents, reduced noise, wider bandwidth, and lower power consumption. Key product innovations include the development of op-amps utilizing advanced CMOS and JFET technologies, offering input bias currents in the femtoampere range, essential for high-impedance sensor applications. Applications span from highly sensitive bio-medical instrumentation and precise sensor signal conditioning in industrial automation to advanced automotive safety systems. Performance metrics like ultra-low offset voltage, excellent gain bandwidth product, and high common-mode rejection ratio are critical differentiators, enabling higher accuracy and signal integrity in demanding environments. Unique selling propositions often revolve around specific combinations of these performance characteristics tailored to niche applications.
Key Drivers, Barriers & Challenges in Low Input Bias Current Op Amps
Key Drivers:
- Increasing Demand for High-Precision Measurement: Critical applications in automotive, medical, and industrial sectors necessitate op-amps capable of accurately processing faint signals.
- Miniaturization and Low-Power Requirements: The proliferation of portable electronics and IoT devices drives the demand for compact, energy-efficient components.
- Advancements in Semiconductor Technology: Continuous improvements in CMOS and JFET fabrication enable op-amps with ever-decreasing input bias currents.
- Growth of Autonomous Systems: The development of autonomous vehicles and advanced robotics relies heavily on sophisticated sensor integration requiring precise signal amplification.
Key Barriers & Challenges:
- High R&D Investment: Developing next-generation low input bias current op-amps requires substantial financial commitment and specialized expertise.
- Manufacturing Complexity: Achieving ultra-low input bias current levels involves intricate fabrication processes, leading to higher production costs.
- Supply Chain Volatility: Disruptions in the supply of specialized raw materials or manufacturing equipment can impact production and lead times.
- Stringent Quality Control: Maintaining consistent performance and reliability for highly sensitive applications demands rigorous testing and quality assurance protocols, adding to costs.
- Competitive Pressures: While niche, competition exists among key players to achieve superior performance benchmarks, requiring constant innovation.
Emerging Opportunities in Low Input Bias Current Op Amps
Emerging opportunities lie in the expanding use of these op-amps in emerging technologies like advanced wearable health monitors, sophisticated environmental sensors for smart cities, and high-sensitivity detectors for scientific research. The increasing adoption of electric vehicles presents new avenues for battery management systems and onboard charging infrastructure that benefit from precise current sensing. Furthermore, the development of new sensing modalities in medical diagnostics, such as advanced optical and electrochemical sensors, will fuel demand. Untapped markets in developing economies, as they advance their industrial automation and healthcare infrastructure, also represent significant potential.
Growth Accelerators in the Low Input Bias Current Op Amps Industry
Technological breakthroughs in material science and process engineering continue to be primary growth accelerators, enabling further reductions in input bias current and improvements in other performance parameters. Strategic partnerships between semiconductor manufacturers and end-equipment developers foster innovation by ensuring that new op-amp designs meet the evolving needs of specific applications. Market expansion strategies, including targeting new geographical regions and developing specialized product portfolios for niche segments, are also crucial. The ongoing trend towards increasing the intelligence and connectivity of devices across all industries will continue to necessitate high-performance analog components like low input bias current op-amps.
Key Players Shaping the Low Input Bias Current Op Amps Market
- Analog Devices, Inc.
- STMicroelectronics
- Texas Instruments
- Renesas Electronics Corporation
- Microchip Technology Inc.
- Onsemi
- Nisshinbo Micro Devices Inc.
Notable Milestones in Low Input Bias Current Op Amps Sector
- 2019: Introduction of new JFET-input op-amps with sub-femtoampere bias currents by a leading manufacturer, enhancing precision in electrochemical sensing.
- 2020: Significant advancements in CMOS technology enabling lower power consumption without compromising input bias current performance.
- 2021: Increased focus on automotive-grade certifications for op-amps, driving adoption in ADAS and EV battery management.
- 2022: Launch of novel packaging technologies that improve thermal performance and reduce parasitic capacitance, crucial for high-frequency applications.
- 2023: Growing demand for low input bias current op-amps in IoT devices for accurate battery monitoring and sensor data acquisition.
- 2024: Emerging trends in bio-integrated electronics pushing the boundaries for even lower power and higher sensitivity op-amp solutions.
In-Depth Low Input Bias Current Op Amps Market Outlook
The future of the Low Input Bias Current Op Amps market is exceptionally promising, driven by persistent technological advancements and expanding application horizons. Growth accelerators include the relentless miniaturization of electronic devices, the burgeoning field of IoT and smart infrastructure, and the increasing complexity of automotive electronics. Strategic opportunities lie in catering to the rapidly growing medical device sector, particularly in point-of-care diagnostics and implantable technologies, and in supporting the next generation of autonomous and electric vehicles. The market is set to witness further innovation in ultra-low power consumption and enhanced noise immunity, making these op-amps indispensable across a wider array of industries.
Low Input Bias Current Op Amps Segmentation
-
1. Application
- 1.1. Automobile
- 1.2. Industrial
- 1.3. Electronics
- 1.4. Medical Equipment
- 1.5. Other
-
2. Types
- 2.1. Single Channel
- 2.2. Dual Channel
Low Input Bias Current Op Amps Segmentation By Geography
-
1. North America
- 1.1. United States
- 1.2. Canada
- 1.3. Mexico
-
2. South America
- 2.1. Brazil
- 2.2. Argentina
- 2.3. Rest of South America
-
3. Europe
- 3.1. United Kingdom
- 3.2. Germany
- 3.3. France
- 3.4. Italy
- 3.5. Spain
- 3.6. Russia
- 3.7. Benelux
- 3.8. Nordics
- 3.9. Rest of Europe
-
4. Middle East & Africa
- 4.1. Turkey
- 4.2. Israel
- 4.3. GCC
- 4.4. North Africa
- 4.5. South Africa
- 4.6. Rest of Middle East & Africa
-
5. Asia Pacific
- 5.1. China
- 5.2. India
- 5.3. Japan
- 5.4. South Korea
- 5.5. ASEAN
- 5.6. Oceania
- 5.7. Rest of Asia Pacific
Low Input Bias Current Op Amps REPORT HIGHLIGHTS
| Aspects | Details |
|---|---|
| Study Period | 2019-2033 |
| Base Year | 2024 |
| Estimated Year | 2025 |
| Forecast Period | 2025-2033 |
| Historical Period | 2019-2024 |
| Growth Rate | CAGR of XX% from 2019-2033 |
| Segmentation |
|
Table of Contents
- 1. Introduction
- 1.1. Research Scope
- 1.2. Market Segmentation
- 1.3. Research Methodology
- 1.4. Definitions and Assumptions
- 2. Executive Summary
- 2.1. Introduction
- 3. Market Dynamics
- 3.1. Introduction
- 3.2. Market Drivers
- 3.3. Market Restrains
- 3.4. Market Trends
- 4. Market Factor Analysis
- 4.1. Porters Five Forces
- 4.2. Supply/Value Chain
- 4.3. PESTEL analysis
- 4.4. Market Entropy
- 4.5. Patent/Trademark Analysis
- 5. Global Low Input Bias Current Op Amps Analysis, Insights and Forecast, 2019-2031
- 5.1. Market Analysis, Insights and Forecast - by Application
- 5.1.1. Automobile
- 5.1.2. Industrial
- 5.1.3. Electronics
- 5.1.4. Medical Equipment
- 5.1.5. Other
- 5.2. Market Analysis, Insights and Forecast - by Types
- 5.2.1. Single Channel
- 5.2.2. Dual Channel
- 5.3. Market Analysis, Insights and Forecast - by Region
- 5.3.1. North America
- 5.3.2. South America
- 5.3.3. Europe
- 5.3.4. Middle East & Africa
- 5.3.5. Asia Pacific
- 5.1. Market Analysis, Insights and Forecast - by Application
- 6. North America Low Input Bias Current Op Amps Analysis, Insights and Forecast, 2019-2031
- 6.1. Market Analysis, Insights and Forecast - by Application
- 6.1.1. Automobile
- 6.1.2. Industrial
- 6.1.3. Electronics
- 6.1.4. Medical Equipment
- 6.1.5. Other
- 6.2. Market Analysis, Insights and Forecast - by Types
- 6.2.1. Single Channel
- 6.2.2. Dual Channel
- 6.1. Market Analysis, Insights and Forecast - by Application
- 7. South America Low Input Bias Current Op Amps Analysis, Insights and Forecast, 2019-2031
- 7.1. Market Analysis, Insights and Forecast - by Application
- 7.1.1. Automobile
- 7.1.2. Industrial
- 7.1.3. Electronics
- 7.1.4. Medical Equipment
- 7.1.5. Other
- 7.2. Market Analysis, Insights and Forecast - by Types
- 7.2.1. Single Channel
- 7.2.2. Dual Channel
- 7.1. Market Analysis, Insights and Forecast - by Application
- 8. Europe Low Input Bias Current Op Amps Analysis, Insights and Forecast, 2019-2031
- 8.1. Market Analysis, Insights and Forecast - by Application
- 8.1.1. Automobile
- 8.1.2. Industrial
- 8.1.3. Electronics
- 8.1.4. Medical Equipment
- 8.1.5. Other
- 8.2. Market Analysis, Insights and Forecast - by Types
- 8.2.1. Single Channel
- 8.2.2. Dual Channel
- 8.1. Market Analysis, Insights and Forecast - by Application
- 9. Middle East & Africa Low Input Bias Current Op Amps Analysis, Insights and Forecast, 2019-2031
- 9.1. Market Analysis, Insights and Forecast - by Application
- 9.1.1. Automobile
- 9.1.2. Industrial
- 9.1.3. Electronics
- 9.1.4. Medical Equipment
- 9.1.5. Other
- 9.2. Market Analysis, Insights and Forecast - by Types
- 9.2.1. Single Channel
- 9.2.2. Dual Channel
- 9.1. Market Analysis, Insights and Forecast - by Application
- 10. Asia Pacific Low Input Bias Current Op Amps Analysis, Insights and Forecast, 2019-2031
- 10.1. Market Analysis, Insights and Forecast - by Application
- 10.1.1. Automobile
- 10.1.2. Industrial
- 10.1.3. Electronics
- 10.1.4. Medical Equipment
- 10.1.5. Other
- 10.2. Market Analysis, Insights and Forecast - by Types
- 10.2.1. Single Channel
- 10.2.2. Dual Channel
- 10.1. Market Analysis, Insights and Forecast - by Application
- 11. Competitive Analysis
- 11.1. Global Market Share Analysis 2024
- 11.2. Company Profiles
- 11.2.1 Analog Devices
- 11.2.1.1. Overview
- 11.2.1.2. Products
- 11.2.1.3. SWOT Analysis
- 11.2.1.4. Recent Developments
- 11.2.1.5. Financials (Based on Availability)
- 11.2.2 Inc
- 11.2.2.1. Overview
- 11.2.2.2. Products
- 11.2.2.3. SWOT Analysis
- 11.2.2.4. Recent Developments
- 11.2.2.5. Financials (Based on Availability)
- 11.2.3 STMicroelectronics
- 11.2.3.1. Overview
- 11.2.3.2. Products
- 11.2.3.3. SWOT Analysis
- 11.2.3.4. Recent Developments
- 11.2.3.5. Financials (Based on Availability)
- 11.2.4 Texas Instruments
- 11.2.4.1. Overview
- 11.2.4.2. Products
- 11.2.4.3. SWOT Analysis
- 11.2.4.4. Recent Developments
- 11.2.4.5. Financials (Based on Availability)
- 11.2.5 Renesas Electronics Corporation
- 11.2.5.1. Overview
- 11.2.5.2. Products
- 11.2.5.3. SWOT Analysis
- 11.2.5.4. Recent Developments
- 11.2.5.5. Financials (Based on Availability)
- 11.2.6 Mircrochip Technology Inc
- 11.2.6.1. Overview
- 11.2.6.2. Products
- 11.2.6.3. SWOT Analysis
- 11.2.6.4. Recent Developments
- 11.2.6.5. Financials (Based on Availability)
- 11.2.7 Onsemi
- 11.2.7.1. Overview
- 11.2.7.2. Products
- 11.2.7.3. SWOT Analysis
- 11.2.7.4. Recent Developments
- 11.2.7.5. Financials (Based on Availability)
- 11.2.8 Nisshinbo Micro Devices Inc
- 11.2.8.1. Overview
- 11.2.8.2. Products
- 11.2.8.3. SWOT Analysis
- 11.2.8.4. Recent Developments
- 11.2.8.5. Financials (Based on Availability)
- 11.2.1 Analog Devices
List of Figures
- Figure 1: Global Low Input Bias Current Op Amps Revenue Breakdown (million, %) by Region 2024 & 2032
- Figure 2: North America Low Input Bias Current Op Amps Revenue (million), by Application 2024 & 2032
- Figure 3: North America Low Input Bias Current Op Amps Revenue Share (%), by Application 2024 & 2032
- Figure 4: North America Low Input Bias Current Op Amps Revenue (million), by Types 2024 & 2032
- Figure 5: North America Low Input Bias Current Op Amps Revenue Share (%), by Types 2024 & 2032
- Figure 6: North America Low Input Bias Current Op Amps Revenue (million), by Country 2024 & 2032
- Figure 7: North America Low Input Bias Current Op Amps Revenue Share (%), by Country 2024 & 2032
- Figure 8: South America Low Input Bias Current Op Amps Revenue (million), by Application 2024 & 2032
- Figure 9: South America Low Input Bias Current Op Amps Revenue Share (%), by Application 2024 & 2032
- Figure 10: South America Low Input Bias Current Op Amps Revenue (million), by Types 2024 & 2032
- Figure 11: South America Low Input Bias Current Op Amps Revenue Share (%), by Types 2024 & 2032
- Figure 12: South America Low Input Bias Current Op Amps Revenue (million), by Country 2024 & 2032
- Figure 13: South America Low Input Bias Current Op Amps Revenue Share (%), by Country 2024 & 2032
- Figure 14: Europe Low Input Bias Current Op Amps Revenue (million), by Application 2024 & 2032
- Figure 15: Europe Low Input Bias Current Op Amps Revenue Share (%), by Application 2024 & 2032
- Figure 16: Europe Low Input Bias Current Op Amps Revenue (million), by Types 2024 & 2032
- Figure 17: Europe Low Input Bias Current Op Amps Revenue Share (%), by Types 2024 & 2032
- Figure 18: Europe Low Input Bias Current Op Amps Revenue (million), by Country 2024 & 2032
- Figure 19: Europe Low Input Bias Current Op Amps Revenue Share (%), by Country 2024 & 2032
- Figure 20: Middle East & Africa Low Input Bias Current Op Amps Revenue (million), by Application 2024 & 2032
- Figure 21: Middle East & Africa Low Input Bias Current Op Amps Revenue Share (%), by Application 2024 & 2032
- Figure 22: Middle East & Africa Low Input Bias Current Op Amps Revenue (million), by Types 2024 & 2032
- Figure 23: Middle East & Africa Low Input Bias Current Op Amps Revenue Share (%), by Types 2024 & 2032
- Figure 24: Middle East & Africa Low Input Bias Current Op Amps Revenue (million), by Country 2024 & 2032
- Figure 25: Middle East & Africa Low Input Bias Current Op Amps Revenue Share (%), by Country 2024 & 2032
- Figure 26: Asia Pacific Low Input Bias Current Op Amps Revenue (million), by Application 2024 & 2032
- Figure 27: Asia Pacific Low Input Bias Current Op Amps Revenue Share (%), by Application 2024 & 2032
- Figure 28: Asia Pacific Low Input Bias Current Op Amps Revenue (million), by Types 2024 & 2032
- Figure 29: Asia Pacific Low Input Bias Current Op Amps Revenue Share (%), by Types 2024 & 2032
- Figure 30: Asia Pacific Low Input Bias Current Op Amps Revenue (million), by Country 2024 & 2032
- Figure 31: Asia Pacific Low Input Bias Current Op Amps Revenue Share (%), by Country 2024 & 2032
List of Tables
- Table 1: Global Low Input Bias Current Op Amps Revenue million Forecast, by Region 2019 & 2032
- Table 2: Global Low Input Bias Current Op Amps Revenue million Forecast, by Application 2019 & 2032
- Table 3: Global Low Input Bias Current Op Amps Revenue million Forecast, by Types 2019 & 2032
- Table 4: Global Low Input Bias Current Op Amps Revenue million Forecast, by Region 2019 & 2032
- Table 5: Global Low Input Bias Current Op Amps Revenue million Forecast, by Application 2019 & 2032
- Table 6: Global Low Input Bias Current Op Amps Revenue million Forecast, by Types 2019 & 2032
- Table 7: Global Low Input Bias Current Op Amps Revenue million Forecast, by Country 2019 & 2032
- Table 8: United States Low Input Bias Current Op Amps Revenue (million) Forecast, by Application 2019 & 2032
- Table 9: Canada Low Input Bias Current Op Amps Revenue (million) Forecast, by Application 2019 & 2032
- Table 10: Mexico Low Input Bias Current Op Amps Revenue (million) Forecast, by Application 2019 & 2032
- Table 11: Global Low Input Bias Current Op Amps Revenue million Forecast, by Application 2019 & 2032
- Table 12: Global Low Input Bias Current Op Amps Revenue million Forecast, by Types 2019 & 2032
- Table 13: Global Low Input Bias Current Op Amps Revenue million Forecast, by Country 2019 & 2032
- Table 14: Brazil Low Input Bias Current Op Amps Revenue (million) Forecast, by Application 2019 & 2032
- Table 15: Argentina Low Input Bias Current Op Amps Revenue (million) Forecast, by Application 2019 & 2032
- Table 16: Rest of South America Low Input Bias Current Op Amps Revenue (million) Forecast, by Application 2019 & 2032
- Table 17: Global Low Input Bias Current Op Amps Revenue million Forecast, by Application 2019 & 2032
- Table 18: Global Low Input Bias Current Op Amps Revenue million Forecast, by Types 2019 & 2032
- Table 19: Global Low Input Bias Current Op Amps Revenue million Forecast, by Country 2019 & 2032
- Table 20: United Kingdom Low Input Bias Current Op Amps Revenue (million) Forecast, by Application 2019 & 2032
- Table 21: Germany Low Input Bias Current Op Amps Revenue (million) Forecast, by Application 2019 & 2032
- Table 22: France Low Input Bias Current Op Amps Revenue (million) Forecast, by Application 2019 & 2032
- Table 23: Italy Low Input Bias Current Op Amps Revenue (million) Forecast, by Application 2019 & 2032
- Table 24: Spain Low Input Bias Current Op Amps Revenue (million) Forecast, by Application 2019 & 2032
- Table 25: Russia Low Input Bias Current Op Amps Revenue (million) Forecast, by Application 2019 & 2032
- Table 26: Benelux Low Input Bias Current Op Amps Revenue (million) Forecast, by Application 2019 & 2032
- Table 27: Nordics Low Input Bias Current Op Amps Revenue (million) Forecast, by Application 2019 & 2032
- Table 28: Rest of Europe Low Input Bias Current Op Amps Revenue (million) Forecast, by Application 2019 & 2032
- Table 29: Global Low Input Bias Current Op Amps Revenue million Forecast, by Application 2019 & 2032
- Table 30: Global Low Input Bias Current Op Amps Revenue million Forecast, by Types 2019 & 2032
- Table 31: Global Low Input Bias Current Op Amps Revenue million Forecast, by Country 2019 & 2032
- Table 32: Turkey Low Input Bias Current Op Amps Revenue (million) Forecast, by Application 2019 & 2032
- Table 33: Israel Low Input Bias Current Op Amps Revenue (million) Forecast, by Application 2019 & 2032
- Table 34: GCC Low Input Bias Current Op Amps Revenue (million) Forecast, by Application 2019 & 2032
- Table 35: North Africa Low Input Bias Current Op Amps Revenue (million) Forecast, by Application 2019 & 2032
- Table 36: South Africa Low Input Bias Current Op Amps Revenue (million) Forecast, by Application 2019 & 2032
- Table 37: Rest of Middle East & Africa Low Input Bias Current Op Amps Revenue (million) Forecast, by Application 2019 & 2032
- Table 38: Global Low Input Bias Current Op Amps Revenue million Forecast, by Application 2019 & 2032
- Table 39: Global Low Input Bias Current Op Amps Revenue million Forecast, by Types 2019 & 2032
- Table 40: Global Low Input Bias Current Op Amps Revenue million Forecast, by Country 2019 & 2032
- Table 41: China Low Input Bias Current Op Amps Revenue (million) Forecast, by Application 2019 & 2032
- Table 42: India Low Input Bias Current Op Amps Revenue (million) Forecast, by Application 2019 & 2032
- Table 43: Japan Low Input Bias Current Op Amps Revenue (million) Forecast, by Application 2019 & 2032
- Table 44: South Korea Low Input Bias Current Op Amps Revenue (million) Forecast, by Application 2019 & 2032
- Table 45: ASEAN Low Input Bias Current Op Amps Revenue (million) Forecast, by Application 2019 & 2032
- Table 46: Oceania Low Input Bias Current Op Amps Revenue (million) Forecast, by Application 2019 & 2032
- Table 47: Rest of Asia Pacific Low Input Bias Current Op Amps Revenue (million) Forecast, by Application 2019 & 2032
Frequently Asked Questions
1. What is the projected Compound Annual Growth Rate (CAGR) of the Low Input Bias Current Op Amps?
The projected CAGR is approximately XX%.
2. Which companies are prominent players in the Low Input Bias Current Op Amps?
Key companies in the market include Analog Devices, Inc, STMicroelectronics, Texas Instruments, Renesas Electronics Corporation, Mircrochip Technology Inc, Onsemi, Nisshinbo Micro Devices Inc.
3. What are the main segments of the Low Input Bias Current Op Amps?
The market segments include Application, Types.
4. Can you provide details about the market size?
The market size is estimated to be USD XXX million as of 2022.
5. What are some drivers contributing to market growth?
N/A
6. What are the notable trends driving market growth?
N/A
7. Are there any restraints impacting market growth?
N/A
8. Can you provide examples of recent developments in the market?
N/A
9. What pricing options are available for accessing the report?
Pricing options include single-user, multi-user, and enterprise licenses priced at USD 4900.00, USD 7350.00, and USD 9800.00 respectively.
10. Is the market size provided in terms of value or volume?
The market size is provided in terms of value, measured in million.
11. Are there any specific market keywords associated with the report?
Yes, the market keyword associated with the report is "Low Input Bias Current Op Amps," which aids in identifying and referencing the specific market segment covered.
12. How do I determine which pricing option suits my needs best?
The pricing options vary based on user requirements and access needs. Individual users may opt for single-user licenses, while businesses requiring broader access may choose multi-user or enterprise licenses for cost-effective access to the report.
13. Are there any additional resources or data provided in the Low Input Bias Current Op Amps report?
While the report offers comprehensive insights, it's advisable to review the specific contents or supplementary materials provided to ascertain if additional resources or data are available.
14. How can I stay updated on further developments or reports in the Low Input Bias Current Op Amps?
To stay informed about further developments, trends, and reports in the Low Input Bias Current Op Amps, consider subscribing to industry newsletters, following relevant companies and organizations, or regularly checking reputable industry news sources and publications.
Methodology
Step 1 - Identification of Relevant Samples Size from Population Database


Step 2 - Approaches for Defining Global Market Size (Value, Volume* & Price*)

Note*: In applicable scenarios
Step 3 - Data Sources
Primary Research
- Web Analytics
- Survey Reports
- Research Institute
- Latest Research Reports
- Opinion Leaders
Secondary Research
- Annual Reports
- White Paper
- Latest Press Release
- Industry Association
- Paid Database
- Investor Presentations

Step 4 - Data Triangulation
Involves using different sources of information in order to increase the validity of a study
These sources are likely to be stakeholders in a program - participants, other researchers, program staff, other community members, and so on.
Then we put all data in single framework & apply various statistical tools to find out the dynamic on the market.
During the analysis stage, feedback from the stakeholder groups would be compared to determine areas of agreement as well as areas of divergence
