

Key Insights
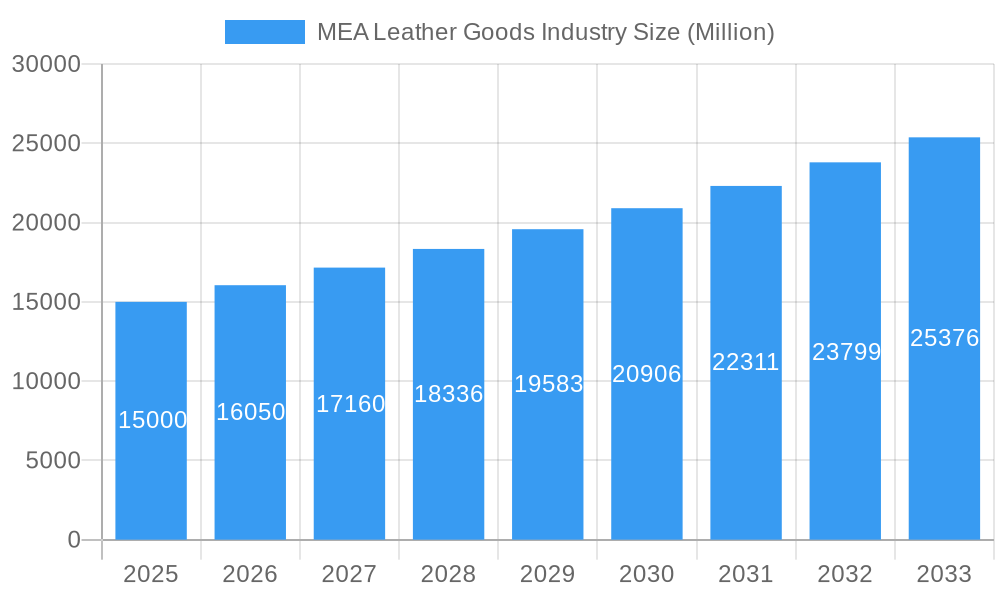
The Middle East and Africa (MEA) leather goods market, encompassing footwear, luggage, and accessories, presents a robust growth opportunity. Driven by rising disposable incomes, a burgeoning middle class, and a growing preference for luxury and branded goods, particularly in key markets like the UAE and Saudi Arabia, the industry is poised for significant expansion. The market's value is estimated to be substantial in 2025, with a compound annual growth rate (CAGR) of 7.06% projected from 2025 to 2033. This growth is fueled by increasing tourism, a young and fashion-conscious population, and the expanding e-commerce sector, which offers increased accessibility to international brands and local artisans. While the offline retail sector remains dominant, online retail stores are experiencing rapid growth, presenting lucrative opportunities for both established brands and emerging players. The market segmentation reveals a strong demand across all product categories, with footwear likely holding the largest share followed by luggage and accessories, indicating diversified growth potential.
MEA Leather Goods Industry Market Size (In Billion)
However, challenges remain. Fluctuations in raw material prices, particularly leather, can impact production costs and profitability. Furthermore, maintaining a balance between affordability and quality remains crucial to cater to the diverse consumer segments within the MEA region. Competitive pressures from both established international brands and local manufacturers also demand strategic pricing and marketing approaches. Navigating import regulations and ensuring supply chain efficiency across the diverse geographical landscape of the MEA region is crucial for sustainable growth. A nuanced understanding of regional cultural preferences is crucial for successful market penetration, with tailored marketing and product offerings key to capturing market share. Strong brand awareness, particularly among luxury brands, plays a significant role in driving consumer purchase decisions within the market.
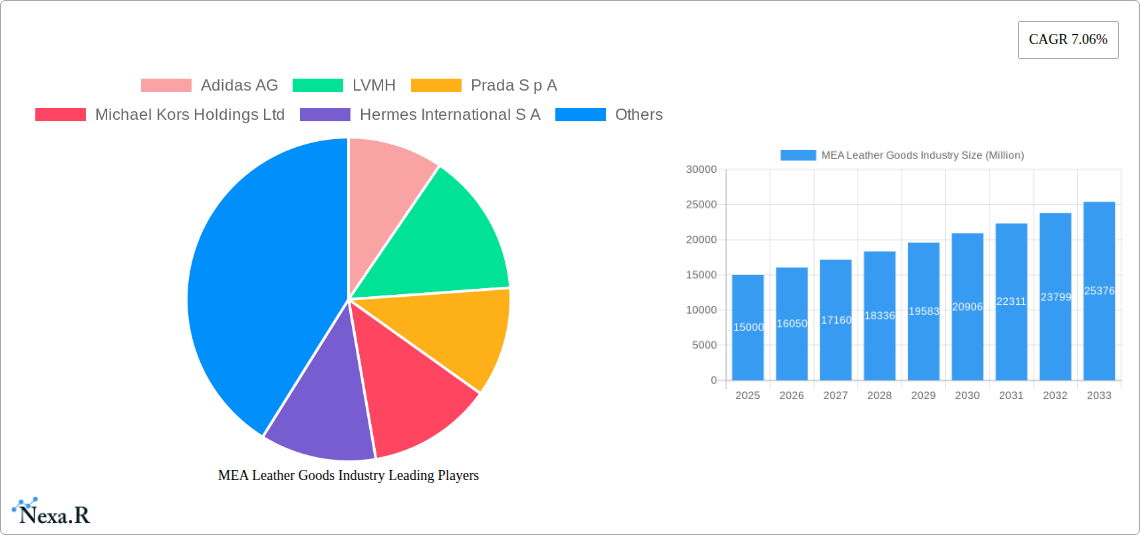
MEA Leather Goods Industry Company Market Share
MEA Leather Goods Industry: Market Analysis, Trends & Forecast 2019-2033
This comprehensive report delivers an in-depth analysis of the Middle East and Africa (MEA) leather goods industry, providing crucial insights for strategic decision-making. With a study period spanning 2019-2033, a base year of 2025, and a forecast period of 2025-2033, this report offers a detailed understanding of current market dynamics and future growth potential. The report analyzes the parent market of Luxury Goods and the child market of Leather Goods specifically in the MEA region, providing invaluable data for both established players and new entrants. The market size is projected at xx Million units in 2025.
MEA Leather Goods Industry Market Dynamics & Structure
This section analyzes the MEA leather goods market's competitive landscape, encompassing market concentration, technological advancements, regulatory frameworks, substitute products, end-user demographics, and mergers and acquisitions (M&A) activities. The market is characterized by a mix of established international brands and local players.
Market Concentration: The MEA leather goods market exhibits a moderately concentrated structure, with a few major international players holding significant market share (estimated at xx% collectively in 2025). Local players contribute significantly to the overall market volume, particularly in specific product segments and regions.
Technological Innovation: Technological advancements, such as 3D printing and advanced tanning techniques, are gradually impacting production efficiency and product quality. However, adoption remains moderate due to initial investment costs and skill gaps.
Regulatory Framework: Varying regulatory environments across MEA nations influence production costs and market access. Regulations related to animal welfare and sustainable sourcing are increasingly impacting the industry.
Competitive Substitutes: Synthetic materials and other alternatives pose a competitive threat, particularly in price-sensitive segments. However, the demand for genuine leather goods, particularly in luxury segments, remains robust.
End-User Demographics: The MEA leather goods market is driven by a growing young population with increasing disposable incomes, particularly in urban areas. Consumer preferences are evolving towards high-quality, stylish, and ethically sourced products.
M&A Trends: M&A activity in the MEA leather goods sector has been relatively moderate in recent years, with a total of xx deals recorded between 2019 and 2024. Consolidation is expected to increase as larger players seek to expand their market share and regional presence.
MEA Leather Goods Industry Growth Trends & Insights
This section analyzes the MEA leather goods market's growth trajectory, examining market size evolution, adoption rates, technological disruptions, and consumer behavior shifts. Analyzing historical data (2019-2024) and projecting future growth (2025-2033), we observe a steady expansion of the market, driven by factors such as rising disposable incomes, increasing urbanization, and a growing preference for luxury goods. The Compound Annual Growth Rate (CAGR) is projected to be xx% during the forecast period (2025-2033). Market penetration is expected to increase to xx% by 2033. Technological disruptions, such as e-commerce expansion and personalized product offerings, are significantly influencing consumer purchasing behavior and creating new opportunities for growth.
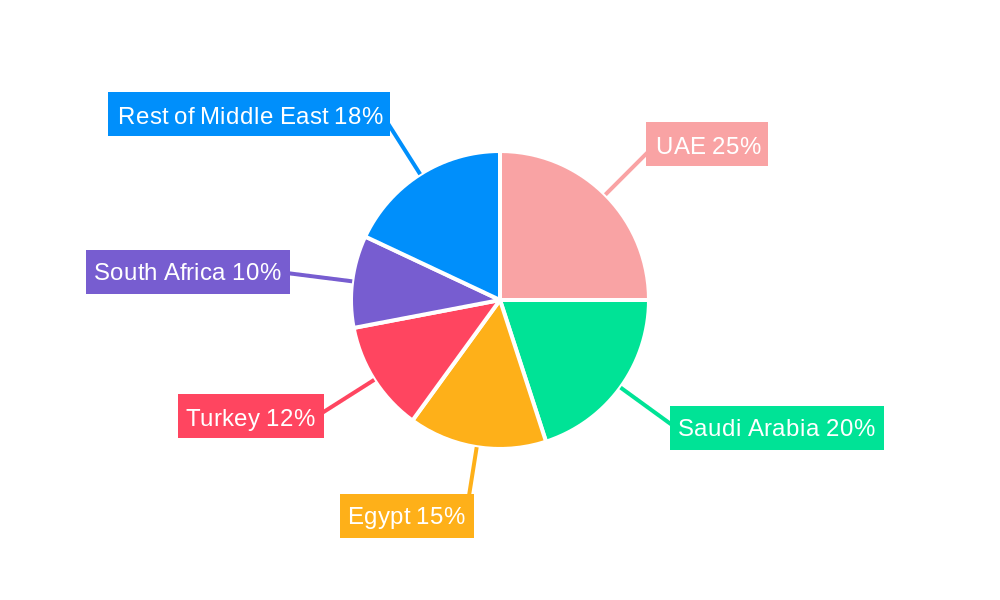
Dominant Regions, Countries, or Segments in MEA Leather Goods Industry
The United Arab Emirates (UAE) and South Africa are currently the leading markets within the MEA region, accounting for xx% and xx% of the total market value in 2025, respectively. These markets benefit from robust consumer spending, well-developed retail infrastructure, and a high concentration of international brands.
By Type:
Footwear: The footwear segment is the largest, representing xx% of the total market in 2025, driven by strong demand for both formal and casual leather shoes.
Luggage: This segment is expected to experience significant growth, driven by increasing travel and tourism.
Accessories: This segment encompasses a wide range of products, including belts, wallets, bags, and other leather accessories. The segment’s growth is driven by the increasing adoption of fashionable leather accessories across various demographics.
By Distribution Channel:
Offline Retail Stores: Offline retail stores continue to dominate the distribution channel in 2025, accounting for xx% of sales. However, the share of online retail is growing rapidly.
Online Retail Stores: Online retail is gaining traction, with rapid adoption of e-commerce platforms offering a wide product selection and convenience. This channel is projected to account for xx% of sales by 2033.
MEA Leather Goods Industry Product Landscape
The MEA leather goods market offers a diverse range of products, categorized by type, material, style, and price point. Product innovation focuses on enhancing durability, comfort, functionality, and aesthetics. Technological advancements in material processing, design, and manufacturing are leading to the production of lighter, more sustainable, and more stylish leather goods. Unique selling propositions often include handcrafted designs, superior quality materials, and brand heritage.
Key Drivers, Barriers & Challenges in MEA Leather Goods Industry
Key Drivers:
Rising disposable incomes and a growing middle class fuel demand for premium leather goods.
Evolving fashion trends and changing consumer preferences are driving innovation and product diversification.
Growing tourism and international travel increase demand for travel-related leather goods.
Key Challenges:
Fluctuations in raw material prices (leather and other components) and supply chain disruptions impact production costs and profitability.
Intense competition from both international and local brands necessitates strategic pricing and marketing strategies.
Counterfeit products pose a significant threat to established brands.
Emerging Opportunities in MEA Leather Goods Industry
Untapped markets in smaller cities and rural areas present significant growth opportunities. Increased demand for sustainable and ethically sourced leather goods creates opportunities for businesses emphasizing eco-friendly practices. The rising popularity of personalized and customized leather products offers niche market potential.
Growth Accelerators in the MEA Leather Goods Industry
Technological advancements in manufacturing, design, and supply chain management will continue to enhance efficiency and product quality. Strategic partnerships between international brands and local manufacturers facilitate market penetration and enhance production capabilities. Expansion into new market segments and geographical areas, particularly in less-developed regions, offers considerable growth potential.
Key Players Shaping the MEA Leather Goods Industry Market
- Adidas AG
- LVMH
- Prada S p A
- Michael Kors Holdings Ltd
- Hermes International S A
- Capri Holdings Ltd
- Kering S A
- Louis Vuitton
- Ralph Lauren Corporation
- List Not Exhaustive
Notable Milestones in MEA Leather Goods Industry Sector
- 2020: Increased focus on sustainable sourcing and ethical production practices.
- 2021: Launch of several e-commerce platforms specializing in luxury leather goods.
- 2022: Several major brands introduced new collections targeting the young demographic.
- 2023: Significant investments in technology upgrades across multiple factories.
- 2024: Growth in the adoption of personalized and customized leather products.
In-Depth MEA Leather Goods Industry Market Outlook
The MEA leather goods industry is poised for continued growth, driven by robust consumer demand, increasing urbanization, and technological advancements. Strategic investments in sustainable practices, supply chain optimization, and brand building will be crucial for long-term success. The focus on providing high-quality, ethically sourced, and stylish products will be vital in capturing market share and establishing a strong brand presence. The potential for market expansion within less-developed regions offers significant untapped opportunities.
MEA Leather Goods Industry Segmentation
-
1. Type
- 1.1. Footwear
- 1.2. Luggage
- 1.3. Accessories
-
2. Distribution Channel
- 2.1. Offline Retail Stores
- 2.2. Online Retail Stores
-
3. Geography
-
3.1. Middle East & Africa
- 3.1.1. United Arab Emirates
- 3.1.2. Saudi Arabia
- 3.1.3. Egypt
- 3.1.4. Turkey
- 3.1.5. South Africa
- 3.1.6. Rest of Middle East & Africa
-
3.1. Middle East & Africa
MEA Leather Goods Industry Segmentation By Geography
- 1. Middle East
-
2. United Arab Emirates
- 2.1. Saudi Arabia
- 2.2. Egypt
- 2.3. Turkey
- 2.4. South Africa
- 2.5. Rest of Middle East
MEA Leather Goods Industry Regional Market Share
Geographic Coverage of MEA Leather Goods Industry
MEA Leather Goods Industry REPORT HIGHLIGHTS
| Aspects | Details |
|---|---|
| Study Period | 2020-2034 |
| Base Year | 2025 |
| Estimated Year | 2026 |
| Forecast Period | 2026-2034 |
| Historical Period | 2020-2025 |
| Growth Rate | CAGR of 7.06% from 2020-2034 |
| Segmentation |
|
Table of Contents
- 1. Introduction
- 1.1. Research Scope
- 1.2. Market Segmentation
- 1.3. Research Objective
- 1.4. Definitions and Assumptions
- 2. Executive Summary
- 2.1. Market Snapshot
- 3. Market Dynamics
- 3.1. Market Drivers
- 3.2. Market Restrains
- 3.3. Market Trends
- 3.4. Market Opportunities
- 4. Market Factor Analysis
- 4.1. Porters Five Forces
- 4.1.1. Bargaining Power of Suppliers
- 4.1.2. Bargaining Power of Buyers
- 4.1.3. Threat of New Entrants
- 4.1.4. Threat of Substitutes
- 4.1.5. Competitive Rivalry
- 4.2. PESTEL analysis
- 4.3. BCG Analysis
- 4.3.1. Stars (High Growth, High Market Share)
- 4.3.2. Cash Cows (Low Growth, High Market Share)
- 4.3.3. Question Mark (High Growth, Low Market Share)
- 4.3.4. Dogs (Low Growth, Low Market Share)
- 4.4. Ansoff Matrix Analysis
- 4.5. Supply Chain Analysis
- 4.6. Regulatory Landscape
- 4.7. Current Market Potential and Opportunity Assessment (TAM–SAM–SOM Framework)
- 4.8. NRP Analyst Note
- 4.1. Porters Five Forces
- 5. Market Analysis, Insights and Forecast 2021-2033
- 5.1. Market Analysis, Insights and Forecast - by Type
- 5.1.1. Footwear
- 5.1.2. Luggage
- 5.1.3. Accessories
- 5.2. Market Analysis, Insights and Forecast - by Distribution Channel
- 5.2.1. Offline Retail Stores
- 5.2.2. Online Retail Stores
- 5.3. Market Analysis, Insights and Forecast - by Geography
- 5.3.1. Middle East & Africa
- 5.3.1.1. United Arab Emirates
- 5.3.1.2. Saudi Arabia
- 5.3.1.3. Egypt
- 5.3.1.4. Turkey
- 5.3.1.5. South Africa
- 5.3.1.6. Rest of Middle East & Africa
- 5.3.1. Middle East & Africa
- 5.4. Market Analysis, Insights and Forecast - by Region
- 5.4.1. Middle East
- 5.4.2. United Arab Emirates
- 5.1. Market Analysis, Insights and Forecast - by Type
- 6. MEA Leather Goods Industry Analysis, Insights and Forecast, 2021-2033
- 6.1. Market Analysis, Insights and Forecast - by Type
- 6.1.1. Footwear
- 6.1.2. Luggage
- 6.1.3. Accessories
- 6.2. Market Analysis, Insights and Forecast - by Distribution Channel
- 6.2.1. Offline Retail Stores
- 6.2.2. Online Retail Stores
- 6.3. Market Analysis, Insights and Forecast - by Geography
- 6.3.1. Middle East & Africa
- 6.3.1.1. United Arab Emirates
- 6.3.1.2. Saudi Arabia
- 6.3.1.3. Egypt
- 6.3.1.4. Turkey
- 6.3.1.5. South Africa
- 6.3.1.6. Rest of Middle East & Africa
- 6.3.1. Middle East & Africa
- 6.1. Market Analysis, Insights and Forecast - by Type
- 7. Middle East MEA Leather Goods Industry Analysis, Insights and Forecast, 2020-2032
- 7.1. Market Analysis, Insights and Forecast - by Type
- 7.1.1. Footwear
- 7.1.2. Luggage
- 7.1.3. Accessories
- 7.2. Market Analysis, Insights and Forecast - by Distribution Channel
- 7.2.1. Offline Retail Stores
- 7.2.2. Online Retail Stores
- 7.3. Market Analysis, Insights and Forecast - by Geography
- 7.3.1. Middle East & Africa
- 7.3.1.1. United Arab Emirates
- 7.3.1.2. Saudi Arabia
- 7.3.1.3. Egypt
- 7.3.1.4. Turkey
- 7.3.1.5. South Africa
- 7.3.1.6. Rest of Middle East & Africa
- 7.3.1. Middle East & Africa
- 7.1. Market Analysis, Insights and Forecast - by Type
- 8. United Arab Emirates MEA Leather Goods Industry Analysis, Insights and Forecast, 2020-2032
- 8.1. Market Analysis, Insights and Forecast - by Type
- 8.1.1. Footwear
- 8.1.2. Luggage
- 8.1.3. Accessories
- 8.2. Market Analysis, Insights and Forecast - by Distribution Channel
- 8.2.1. Offline Retail Stores
- 8.2.2. Online Retail Stores
- 8.3. Market Analysis, Insights and Forecast - by Geography
- 8.3.1. Middle East & Africa
- 8.3.1.1. United Arab Emirates
- 8.3.1.2. Saudi Arabia
- 8.3.1.3. Egypt
- 8.3.1.4. Turkey
- 8.3.1.5. South Africa
- 8.3.1.6. Rest of Middle East & Africa
- 8.3.1. Middle East & Africa
- 8.1. Market Analysis, Insights and Forecast - by Type
- 9. Competitive Analysis
- 9.1. Company Profiles
- 9.1.1 Adidas AG
- 9.1.1.1. Company Overview
- 9.1.1.2. Products
- 9.1.1.3. Company Financials
- 9.1.1.4. SWOT Analysis
- 9.1.2 LVMH
- 9.1.2.1. Company Overview
- 9.1.2.2. Products
- 9.1.2.3. Company Financials
- 9.1.2.4. SWOT Analysis
- 9.1.3 Prada S p A
- 9.1.3.1. Company Overview
- 9.1.3.2. Products
- 9.1.3.3. Company Financials
- 9.1.3.4. SWOT Analysis
- 9.1.4 Michael Kors Holdings Ltd
- 9.1.4.1. Company Overview
- 9.1.4.2. Products
- 9.1.4.3. Company Financials
- 9.1.4.4. SWOT Analysis
- 9.1.5 Hermes International S A
- 9.1.5.1. Company Overview
- 9.1.5.2. Products
- 9.1.5.3. Company Financials
- 9.1.5.4. SWOT Analysis
- 9.1.6 Capri Holdings Ltd
- 9.1.6.1. Company Overview
- 9.1.6.2. Products
- 9.1.6.3. Company Financials
- 9.1.6.4. SWOT Analysis
- 9.1.7 Kering S A *List Not Exhaustive
- 9.1.7.1. Company Overview
- 9.1.7.2. Products
- 9.1.7.3. Company Financials
- 9.1.7.4. SWOT Analysis
- 9.1.8 Louis Vuitton
- 9.1.8.1. Company Overview
- 9.1.8.2. Products
- 9.1.8.3. Company Financials
- 9.1.8.4. SWOT Analysis
- 9.1.9 Ralph Lauren Corporation
- 9.1.9.1. Company Overview
- 9.1.9.2. Products
- 9.1.9.3. Company Financials
- 9.1.9.4. SWOT Analysis
- 9.1.1 Adidas AG
- 9.2. Market Entropy
- 9.2.1 Company's Key Areas Served
- 9.2.2 Recent Developments
- 9.3. Company Market Share Analysis 2025
- 9.3.1 Top 5 Companies Market Share Analysis
- 9.3.2 Top 3 Companies Market Share Analysis
- 9.4. List of Potential Customers
- 10. Research Methodology
List of Figures
- Figure 1: MEA Leather Goods Industry Revenue Breakdown (Million, %) by Product 2025 & 2033
- Figure 2: MEA Leather Goods Industry Share (%) by Company 2025
List of Tables
- Table 1: MEA Leather Goods Industry Revenue Million Forecast, by Type 2020 & 2033
- Table 2: MEA Leather Goods Industry Volume K Units Forecast, by Type 2020 & 2033
- Table 3: MEA Leather Goods Industry Revenue Million Forecast, by Distribution Channel 2020 & 2033
- Table 4: MEA Leather Goods Industry Volume K Units Forecast, by Distribution Channel 2020 & 2033
- Table 5: MEA Leather Goods Industry Revenue Million Forecast, by Geography 2020 & 2033
- Table 6: MEA Leather Goods Industry Volume K Units Forecast, by Geography 2020 & 2033
- Table 7: MEA Leather Goods Industry Revenue Million Forecast, by Region 2020 & 2033
- Table 8: MEA Leather Goods Industry Volume K Units Forecast, by Region 2020 & 2033
- Table 9: MEA Leather Goods Industry Revenue Million Forecast, by Type 2020 & 2033
- Table 10: MEA Leather Goods Industry Volume K Units Forecast, by Type 2020 & 2033
- Table 11: MEA Leather Goods Industry Revenue Million Forecast, by Distribution Channel 2020 & 2033
- Table 12: MEA Leather Goods Industry Volume K Units Forecast, by Distribution Channel 2020 & 2033
- Table 13: MEA Leather Goods Industry Revenue Million Forecast, by Geography 2020 & 2033
- Table 14: MEA Leather Goods Industry Volume K Units Forecast, by Geography 2020 & 2033
- Table 15: MEA Leather Goods Industry Revenue Million Forecast, by Country 2020 & 2033
- Table 16: MEA Leather Goods Industry Volume K Units Forecast, by Country 2020 & 2033
- Table 17: MEA Leather Goods Industry Revenue Million Forecast, by Type 2020 & 2033
- Table 18: MEA Leather Goods Industry Volume K Units Forecast, by Type 2020 & 2033
- Table 19: MEA Leather Goods Industry Revenue Million Forecast, by Distribution Channel 2020 & 2033
- Table 20: MEA Leather Goods Industry Volume K Units Forecast, by Distribution Channel 2020 & 2033
- Table 21: MEA Leather Goods Industry Revenue Million Forecast, by Geography 2020 & 2033
- Table 22: MEA Leather Goods Industry Volume K Units Forecast, by Geography 2020 & 2033
- Table 23: MEA Leather Goods Industry Revenue Million Forecast, by Country 2020 & 2033
- Table 24: MEA Leather Goods Industry Volume K Units Forecast, by Country 2020 & 2033
- Table 25: Saudi Arabia MEA Leather Goods Industry Revenue (Million) Forecast, by Application 2020 & 2033
- Table 26: Saudi Arabia MEA Leather Goods Industry Volume (K Units) Forecast, by Application 2020 & 2033
- Table 27: Egypt MEA Leather Goods Industry Revenue (Million) Forecast, by Application 2020 & 2033
- Table 28: Egypt MEA Leather Goods Industry Volume (K Units) Forecast, by Application 2020 & 2033
- Table 29: Turkey MEA Leather Goods Industry Revenue (Million) Forecast, by Application 2020 & 2033
- Table 30: Turkey MEA Leather Goods Industry Volume (K Units) Forecast, by Application 2020 & 2033
- Table 31: South Africa MEA Leather Goods Industry Revenue (Million) Forecast, by Application 2020 & 2033
- Table 32: South Africa MEA Leather Goods Industry Volume (K Units) Forecast, by Application 2020 & 2033
- Table 33: Rest of Middle East MEA Leather Goods Industry Revenue (Million) Forecast, by Application 2020 & 2033
- Table 34: Rest of Middle East MEA Leather Goods Industry Volume (K Units) Forecast, by Application 2020 & 2033
Frequently Asked Questions
1. What is the projected Compound Annual Growth Rate (CAGR) of the MEA Leather Goods Industry?
The projected CAGR is approximately 7.06%.
2. Which companies are prominent players in the MEA Leather Goods Industry?
Key companies in the market include Adidas AG, LVMH, Prada S p A, Michael Kors Holdings Ltd, Hermes International S A, Capri Holdings Ltd, Kering S A *List Not Exhaustive, Louis Vuitton, Ralph Lauren Corporation.
3. What are the main segments of the MEA Leather Goods Industry?
The market segments include Type, Distribution Channel, Geography.
4. Can you provide details about the market size?
The market size is estimated to be USD XX Million as of 2022.
5. What are some drivers contributing to market growth?
Increase in Sports Participation; Trend of Athleisure.
6. What are the notable trends driving market growth?
Specialized Leather Processing Hub leading to an Increase in Production and Exports.
7. Are there any restraints impacting market growth?
Availability of Fake and Counterfeit Products.
8. Can you provide examples of recent developments in the market?
N/A
9. What pricing options are available for accessing the report?
Pricing options include single-user, multi-user, and enterprise licenses priced at USD 3800, USD 4500, and USD 5800 respectively.
10. Is the market size provided in terms of value or volume?
The market size is provided in terms of value, measured in Million and volume, measured in K Units.
11. Are there any specific market keywords associated with the report?
Yes, the market keyword associated with the report is "MEA Leather Goods Industry," which aids in identifying and referencing the specific market segment covered.
12. How do I determine which pricing option suits my needs best?
The pricing options vary based on user requirements and access needs. Individual users may opt for single-user licenses, while businesses requiring broader access may choose multi-user or enterprise licenses for cost-effective access to the report.
13. Are there any additional resources or data provided in the MEA Leather Goods Industry report?
While the report offers comprehensive insights, it's advisable to review the specific contents or supplementary materials provided to ascertain if additional resources or data are available.
14. How can I stay updated on further developments or reports in the MEA Leather Goods Industry?
To stay informed about further developments, trends, and reports in the MEA Leather Goods Industry, consider subscribing to industry newsletters, following relevant companies and organizations, or regularly checking reputable industry news sources and publications.
Methodology
Step 1 - Identification of Relevant Samples Size from Population Database


Step 2 - Approaches for Defining Global Market Size (Value, Volume* & Price*)

Note*: In applicable scenarios
Step 3 - Data Sources
Primary Research
- Web Analytics
- Survey Reports
- Research Institute
- Latest Research Reports
- Opinion Leaders
Secondary Research
- Annual Reports
- White Paper
- Latest Press Release
- Industry Association
- Paid Database
- Investor Presentations

Step 4 - Data Triangulation
Involves using different sources of information in order to increase the validity of a study
These sources are likely to be stakeholders in a program - participants, other researchers, program staff, other community members, and so on.
Then we put all data in single framework & apply various statistical tools to find out the dynamic on the market.
During the analysis stage, feedback from the stakeholder groups would be compared to determine areas of agreement as well as areas of divergence