

Key Insights
The medical graphics card market is experiencing robust growth, driven by the increasing adoption of advanced medical imaging technologies such as 4K and 8K displays, high-resolution 3D visualization for surgical planning and minimally invasive procedures, and the expanding use of AI in medical diagnosis. The market's Compound Annual Growth Rate (CAGR) from 2019 to 2024 is estimated at 15%, indicating a strong upward trajectory. This growth is fueled by several factors, including the rising prevalence of chronic diseases necessitating advanced diagnostics, the increasing demand for minimally invasive surgeries, and significant investments in healthcare infrastructure globally. Key players like EIZO, AMD, and Nvidia are strategically positioning themselves within this expanding market, focusing on developing specialized graphics cards with high performance and reliability, tailored for the demanding requirements of medical imaging applications.
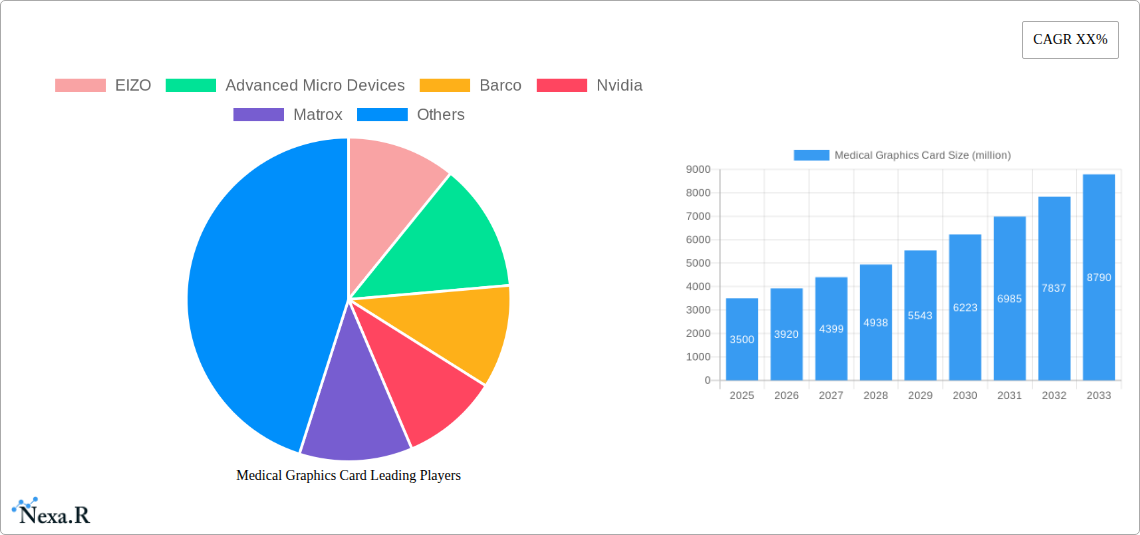
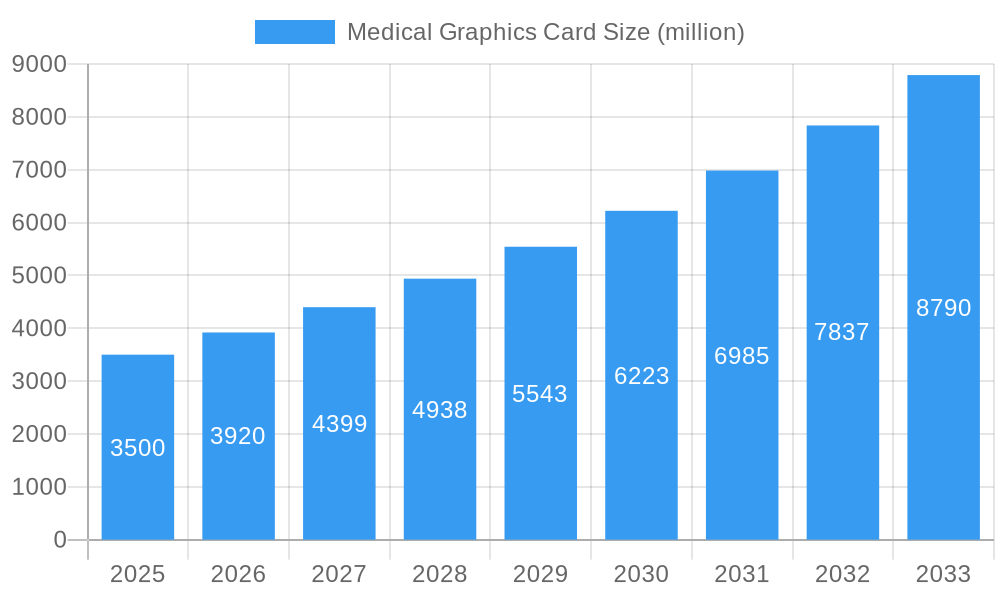
Medical Graphics Card Market Size (In Billion)
While the market is showing considerable promise, certain restraints exist. High initial investment costs for advanced systems and the need for specialized training for medical professionals represent challenges to wider adoption. However, ongoing technological advancements, particularly in AI-powered image analysis and the development of more cost-effective solutions, are mitigating these challenges. Segmentation analysis reveals that the highest market share is currently held by the high-end segment, catering to advanced imaging systems. However, the mid-range segment is projected to experience the most rapid growth over the forecast period, driven by the increasing adoption of advanced imaging technologies in smaller hospitals and clinics. The geographical distribution of market share is likely to be concentrated in North America and Europe initially, with emerging markets in Asia-Pacific showing strong potential for future growth. The market is expected to reach a value of approximately $3.5 billion by 2025, and with a projected CAGR of 12% until 2033, a substantial market expansion is anticipated.
Medical Graphics Card Company Market Share
Medical Graphics Card Market Report: 2019-2033
This comprehensive report provides a detailed analysis of the Medical Graphics Card market, encompassing market dynamics, growth trends, regional segmentation, product landscape, key players, and future outlook. The study period covers 2019-2033, with 2025 as the base and estimated year. The forecast period is 2025-2033, and the historical period is 2019-2024. This report is crucial for industry professionals, investors, and anyone seeking a deep understanding of this rapidly evolving sector. The market is projected to reach xx million units by 2033.
Medical Graphics Card Market Dynamics & Structure
The medical graphics card market is characterized by moderate concentration, with key players like Nvidia and AMD holding significant market share, estimated at 60% collectively in 2025. Technological innovation, particularly in AI-powered image processing and high-resolution displays, is a primary driver. Stringent regulatory frameworks, including HIPAA compliance, shape product development and market access. Competitive substitutes include software-based image processing solutions, but hardware-based cards remain dominant due to performance advantages. The end-user demographic includes hospitals, diagnostic imaging centers, and research institutions. M&A activity has been moderate, with approximately xx deals recorded between 2019-2024, primarily focused on enhancing technology portfolios and expanding market reach.
- Market Concentration: Moderately concentrated, with top 5 players holding 75% market share in 2025.
- Technological Drivers: AI-powered image processing, high-resolution displays, improved processing speeds.
- Regulatory Framework: HIPAA compliance, FDA approvals for medical devices.
- Competitive Substitutes: Software-based image processing, cloud-based solutions.
- End-User Demographics: Hospitals, diagnostic centers, research institutions, ambulances.
- M&A Trends: xx deals between 2019-2024, focused on technology acquisition and market expansion.
Medical Graphics Card Growth Trends & Insights
The medical graphics card market witnessed a CAGR of xx% during 2019-2024, driven by increasing adoption of advanced imaging techniques (e.g., MRI, CT scans) and the rising prevalence of chronic diseases. Technological advancements, including the introduction of specialized GPUs optimized for medical imaging, have further fueled market growth. The shift towards minimally invasive procedures and telehealth has also contributed to increased demand for high-performance graphics cards. Market penetration is expected to reach xx% by 2033, with continued growth driven by factors like increasing healthcare spending and the expanding application of AI in medical imaging. Consumer behavior is shifting towards preference for integrated solutions offering superior image quality and processing speed.
Dominant Regions, Countries, or Segments in Medical Graphics Card
North America currently holds the largest market share, driven by high healthcare expenditure, technological advancements, and early adoption of advanced medical imaging techniques. Factors like robust healthcare infrastructure, presence of key players, and supportive government policies contribute to this dominance. Europe follows as a significant market, with strong growth expected in emerging economies of Asia-Pacific.
- North America: High healthcare spending, strong technological base, early adoption of new technologies.
- Europe: Established healthcare infrastructure, presence of major players, growing demand for advanced imaging.
- Asia-Pacific: Rising healthcare expenditure, increasing prevalence of chronic diseases, growing adoption of advanced technologies.
Medical Graphics Card Product Landscape
Medical graphics cards are designed to meet the demanding requirements of medical imaging applications. These cards offer high processing power, low latency, and compatibility with various medical imaging modalities. Recent innovations focus on AI acceleration, improved image rendering, and enhanced data security. Unique selling propositions include optimized performance for specific imaging modalities, dedicated memory for high-resolution images and real-time processing capabilities. Technological advancements such as real-time 3D rendering and improved DICOM support enhance diagnostic capabilities and streamline workflows.
Key Drivers, Barriers & Challenges in Medical Graphics Card
Key Drivers:
- Increasing adoption of advanced medical imaging techniques.
- Growing prevalence of chronic diseases requiring advanced diagnostic tools.
- Technological advancements in GPU technology leading to superior image processing and rendering.
- Rising healthcare spending globally.
Key Challenges:
- High initial investment costs associated with advanced medical imaging systems and graphics cards.
- Stringent regulatory approvals and compliance requirements (e.g., FDA approvals).
- Potential supply chain disruptions impacting availability and cost.
- Intense competition amongst established players and emerging market entrants. This leads to price pressures and margins constraints impacting profitability.
Emerging Opportunities in Medical Graphics Card
- Expansion into emerging markets with growing healthcare infrastructure and increased demand for advanced medical imaging.
- Development of specialized graphics cards for specific medical imaging applications (e.g., AI-powered diagnostic tools).
- Integration of graphics cards with cloud-based medical imaging platforms for improved accessibility and data management.
- Growing applications in minimally invasive surgeries and robotic-assisted procedures.
Growth Accelerators in the Medical Graphics Card Industry
The long-term growth of the medical graphics card market will be propelled by continued technological innovation, strategic partnerships between graphics card manufacturers and medical device companies, and expansion into new geographic markets with high growth potential. The increasing adoption of AI and machine learning in medical image analysis will also create significant opportunities for growth.
Key Players Shaping the Medical Graphics Card Market
- EIZO
- Advanced Micro Devices
- Barco
- Nvidia
- Matrox
- JVC Kenwood
- Siemens
- Parity Medical
- ADLINK
- Aetina Corporation
- Onyx Healthcare
- Advantech
- Leadtek
- Sapphire Technology
Notable Milestones in Medical Graphics Card Sector
- 2020: Nvidia releases RTX A6000, a high-performance graphics card optimized for medical imaging.
- 2022: AMD launches Radeon Pro W6800, offering enhanced performance for AI-powered medical image processing.
- 2023: Several partnerships formed between graphics card manufacturers and medical device companies focusing on AI-powered diagnostic tools.
- 2024: Significant investment in research and development to improve image quality and processing speed.
In-Depth Medical Graphics Card Market Outlook
The medical graphics card market is poised for sustained growth over the forecast period, driven by the aforementioned factors. Strategic partnerships, technological innovations, and increasing adoption of advanced medical imaging techniques will be key drivers of this growth. Companies that successfully adapt to the evolving market landscape and leverage emerging technologies such as AI will be best positioned to capitalize on the significant opportunities presented.
Medical Graphics Card Segmentation
-
1. Application
- 1.1. Image Processing Display
- 1.2. Medical Diagnostic Display
- 1.3. Others
-
2. Types
- 2.1. Single-head Graphics Card
- 2.2. Multi-head Graphics Card
Medical Graphics Card Segmentation By Geography
-
1. North America
- 1.1. United States
- 1.2. Canada
- 1.3. Mexico
-
2. South America
- 2.1. Brazil
- 2.2. Argentina
- 2.3. Rest of South America
-
3. Europe
- 3.1. United Kingdom
- 3.2. Germany
- 3.3. France
- 3.4. Italy
- 3.5. Spain
- 3.6. Russia
- 3.7. Benelux
- 3.8. Nordics
- 3.9. Rest of Europe
-
4. Middle East & Africa
- 4.1. Turkey
- 4.2. Israel
- 4.3. GCC
- 4.4. North Africa
- 4.5. South Africa
- 4.6. Rest of Middle East & Africa
-
5. Asia Pacific
- 5.1. China
- 5.2. India
- 5.3. Japan
- 5.4. South Korea
- 5.5. ASEAN
- 5.6. Oceania
- 5.7. Rest of Asia Pacific
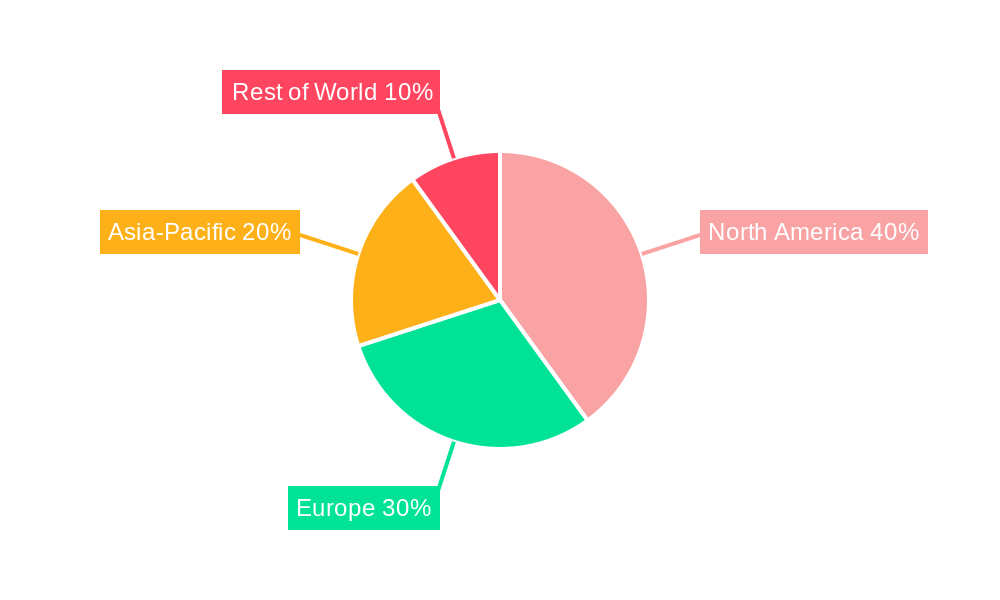
Medical Graphics Card Regional Market Share
Geographic Coverage of Medical Graphics Card
Medical Graphics Card REPORT HIGHLIGHTS
| Aspects | Details |
|---|---|
| Study Period | 2020-2034 |
| Base Year | 2025 |
| Estimated Year | 2026 |
| Forecast Period | 2026-2034 |
| Historical Period | 2020-2025 |
| Growth Rate | CAGR of 32.8% from 2020-2034 |
| Segmentation |
|
Table of Contents
- 1. Introduction
- 1.1. Research Scope
- 1.2. Market Segmentation
- 1.3. Research Methodology
- 1.4. Definitions and Assumptions
- 2. Executive Summary
- 2.1. Introduction
- 3. Market Dynamics
- 3.1. Introduction
- 3.2. Market Drivers
- 3.3. Market Restrains
- 3.4. Market Trends
- 4. Market Factor Analysis
- 4.1. Porters Five Forces
- 4.2. Supply/Value Chain
- 4.3. PESTEL analysis
- 4.4. Market Entropy
- 4.5. Patent/Trademark Analysis
- 5. Global Medical Graphics Card Analysis, Insights and Forecast, 2020-2032
- 5.1. Market Analysis, Insights and Forecast - by Application
- 5.1.1. Image Processing Display
- 5.1.2. Medical Diagnostic Display
- 5.1.3. Others
- 5.2. Market Analysis, Insights and Forecast - by Types
- 5.2.1. Single-head Graphics Card
- 5.2.2. Multi-head Graphics Card
- 5.3. Market Analysis, Insights and Forecast - by Region
- 5.3.1. North America
- 5.3.2. South America
- 5.3.3. Europe
- 5.3.4. Middle East & Africa
- 5.3.5. Asia Pacific
- 5.1. Market Analysis, Insights and Forecast - by Application
- 6. North America Medical Graphics Card Analysis, Insights and Forecast, 2020-2032
- 6.1. Market Analysis, Insights and Forecast - by Application
- 6.1.1. Image Processing Display
- 6.1.2. Medical Diagnostic Display
- 6.1.3. Others
- 6.2. Market Analysis, Insights and Forecast - by Types
- 6.2.1. Single-head Graphics Card
- 6.2.2. Multi-head Graphics Card
- 6.1. Market Analysis, Insights and Forecast - by Application
- 7. South America Medical Graphics Card Analysis, Insights and Forecast, 2020-2032
- 7.1. Market Analysis, Insights and Forecast - by Application
- 7.1.1. Image Processing Display
- 7.1.2. Medical Diagnostic Display
- 7.1.3. Others
- 7.2. Market Analysis, Insights and Forecast - by Types
- 7.2.1. Single-head Graphics Card
- 7.2.2. Multi-head Graphics Card
- 7.1. Market Analysis, Insights and Forecast - by Application
- 8. Europe Medical Graphics Card Analysis, Insights and Forecast, 2020-2032
- 8.1. Market Analysis, Insights and Forecast - by Application
- 8.1.1. Image Processing Display
- 8.1.2. Medical Diagnostic Display
- 8.1.3. Others
- 8.2. Market Analysis, Insights and Forecast - by Types
- 8.2.1. Single-head Graphics Card
- 8.2.2. Multi-head Graphics Card
- 8.1. Market Analysis, Insights and Forecast - by Application
- 9. Middle East & Africa Medical Graphics Card Analysis, Insights and Forecast, 2020-2032
- 9.1. Market Analysis, Insights and Forecast - by Application
- 9.1.1. Image Processing Display
- 9.1.2. Medical Diagnostic Display
- 9.1.3. Others
- 9.2. Market Analysis, Insights and Forecast - by Types
- 9.2.1. Single-head Graphics Card
- 9.2.2. Multi-head Graphics Card
- 9.1. Market Analysis, Insights and Forecast - by Application
- 10. Asia Pacific Medical Graphics Card Analysis, Insights and Forecast, 2020-2032
- 10.1. Market Analysis, Insights and Forecast - by Application
- 10.1.1. Image Processing Display
- 10.1.2. Medical Diagnostic Display
- 10.1.3. Others
- 10.2. Market Analysis, Insights and Forecast - by Types
- 10.2.1. Single-head Graphics Card
- 10.2.2. Multi-head Graphics Card
- 10.1. Market Analysis, Insights and Forecast - by Application
- 11. Competitive Analysis
- 11.1. Global Market Share Analysis 2025
- 11.2. Company Profiles
- 11.2.1 EIZO
- 11.2.1.1. Overview
- 11.2.1.2. Products
- 11.2.1.3. SWOT Analysis
- 11.2.1.4. Recent Developments
- 11.2.1.5. Financials (Based on Availability)
- 11.2.2 Advanced Micro Devices
- 11.2.2.1. Overview
- 11.2.2.2. Products
- 11.2.2.3. SWOT Analysis
- 11.2.2.4. Recent Developments
- 11.2.2.5. Financials (Based on Availability)
- 11.2.3 Barco
- 11.2.3.1. Overview
- 11.2.3.2. Products
- 11.2.3.3. SWOT Analysis
- 11.2.3.4. Recent Developments
- 11.2.3.5. Financials (Based on Availability)
- 11.2.4 Nvidia
- 11.2.4.1. Overview
- 11.2.4.2. Products
- 11.2.4.3. SWOT Analysis
- 11.2.4.4. Recent Developments
- 11.2.4.5. Financials (Based on Availability)
- 11.2.5 Matrox
- 11.2.5.1. Overview
- 11.2.5.2. Products
- 11.2.5.3. SWOT Analysis
- 11.2.5.4. Recent Developments
- 11.2.5.5. Financials (Based on Availability)
- 11.2.6 JVC Kenwood
- 11.2.6.1. Overview
- 11.2.6.2. Products
- 11.2.6.3. SWOT Analysis
- 11.2.6.4. Recent Developments
- 11.2.6.5. Financials (Based on Availability)
- 11.2.7 Siemens
- 11.2.7.1. Overview
- 11.2.7.2. Products
- 11.2.7.3. SWOT Analysis
- 11.2.7.4. Recent Developments
- 11.2.7.5. Financials (Based on Availability)
- 11.2.8 Parity Medical
- 11.2.8.1. Overview
- 11.2.8.2. Products
- 11.2.8.3. SWOT Analysis
- 11.2.8.4. Recent Developments
- 11.2.8.5. Financials (Based on Availability)
- 11.2.9 ADLINK
- 11.2.9.1. Overview
- 11.2.9.2. Products
- 11.2.9.3. SWOT Analysis
- 11.2.9.4. Recent Developments
- 11.2.9.5. Financials (Based on Availability)
- 11.2.10 Aetina Corporation
- 11.2.10.1. Overview
- 11.2.10.2. Products
- 11.2.10.3. SWOT Analysis
- 11.2.10.4. Recent Developments
- 11.2.10.5. Financials (Based on Availability)
- 11.2.11 Onyx Healthcare
- 11.2.11.1. Overview
- 11.2.11.2. Products
- 11.2.11.3. SWOT Analysis
- 11.2.11.4. Recent Developments
- 11.2.11.5. Financials (Based on Availability)
- 11.2.12 Advantech
- 11.2.12.1. Overview
- 11.2.12.2. Products
- 11.2.12.3. SWOT Analysis
- 11.2.12.4. Recent Developments
- 11.2.12.5. Financials (Based on Availability)
- 11.2.13 Leadtek
- 11.2.13.1. Overview
- 11.2.13.2. Products
- 11.2.13.3. SWOT Analysis
- 11.2.13.4. Recent Developments
- 11.2.13.5. Financials (Based on Availability)
- 11.2.14 Sapphire Technology
- 11.2.14.1. Overview
- 11.2.14.2. Products
- 11.2.14.3. SWOT Analysis
- 11.2.14.4. Recent Developments
- 11.2.14.5. Financials (Based on Availability)
- 11.2.1 EIZO
List of Figures
- Figure 1: Global Medical Graphics Card Revenue Breakdown (undefined, %) by Region 2025 & 2033
- Figure 2: North America Medical Graphics Card Revenue (undefined), by Application 2025 & 2033
- Figure 3: North America Medical Graphics Card Revenue Share (%), by Application 2025 & 2033
- Figure 4: North America Medical Graphics Card Revenue (undefined), by Types 2025 & 2033
- Figure 5: North America Medical Graphics Card Revenue Share (%), by Types 2025 & 2033
- Figure 6: North America Medical Graphics Card Revenue (undefined), by Country 2025 & 2033
- Figure 7: North America Medical Graphics Card Revenue Share (%), by Country 2025 & 2033
- Figure 8: South America Medical Graphics Card Revenue (undefined), by Application 2025 & 2033
- Figure 9: South America Medical Graphics Card Revenue Share (%), by Application 2025 & 2033
- Figure 10: South America Medical Graphics Card Revenue (undefined), by Types 2025 & 2033
- Figure 11: South America Medical Graphics Card Revenue Share (%), by Types 2025 & 2033
- Figure 12: South America Medical Graphics Card Revenue (undefined), by Country 2025 & 2033
- Figure 13: South America Medical Graphics Card Revenue Share (%), by Country 2025 & 2033
- Figure 14: Europe Medical Graphics Card Revenue (undefined), by Application 2025 & 2033
- Figure 15: Europe Medical Graphics Card Revenue Share (%), by Application 2025 & 2033
- Figure 16: Europe Medical Graphics Card Revenue (undefined), by Types 2025 & 2033
- Figure 17: Europe Medical Graphics Card Revenue Share (%), by Types 2025 & 2033
- Figure 18: Europe Medical Graphics Card Revenue (undefined), by Country 2025 & 2033
- Figure 19: Europe Medical Graphics Card Revenue Share (%), by Country 2025 & 2033
- Figure 20: Middle East & Africa Medical Graphics Card Revenue (undefined), by Application 2025 & 2033
- Figure 21: Middle East & Africa Medical Graphics Card Revenue Share (%), by Application 2025 & 2033
- Figure 22: Middle East & Africa Medical Graphics Card Revenue (undefined), by Types 2025 & 2033
- Figure 23: Middle East & Africa Medical Graphics Card Revenue Share (%), by Types 2025 & 2033
- Figure 24: Middle East & Africa Medical Graphics Card Revenue (undefined), by Country 2025 & 2033
- Figure 25: Middle East & Africa Medical Graphics Card Revenue Share (%), by Country 2025 & 2033
- Figure 26: Asia Pacific Medical Graphics Card Revenue (undefined), by Application 2025 & 2033
- Figure 27: Asia Pacific Medical Graphics Card Revenue Share (%), by Application 2025 & 2033
- Figure 28: Asia Pacific Medical Graphics Card Revenue (undefined), by Types 2025 & 2033
- Figure 29: Asia Pacific Medical Graphics Card Revenue Share (%), by Types 2025 & 2033
- Figure 30: Asia Pacific Medical Graphics Card Revenue (undefined), by Country 2025 & 2033
- Figure 31: Asia Pacific Medical Graphics Card Revenue Share (%), by Country 2025 & 2033
List of Tables
- Table 1: Global Medical Graphics Card Revenue undefined Forecast, by Application 2020 & 2033
- Table 2: Global Medical Graphics Card Revenue undefined Forecast, by Types 2020 & 2033
- Table 3: Global Medical Graphics Card Revenue undefined Forecast, by Region 2020 & 2033
- Table 4: Global Medical Graphics Card Revenue undefined Forecast, by Application 2020 & 2033
- Table 5: Global Medical Graphics Card Revenue undefined Forecast, by Types 2020 & 2033
- Table 6: Global Medical Graphics Card Revenue undefined Forecast, by Country 2020 & 2033
- Table 7: United States Medical Graphics Card Revenue (undefined) Forecast, by Application 2020 & 2033
- Table 8: Canada Medical Graphics Card Revenue (undefined) Forecast, by Application 2020 & 2033
- Table 9: Mexico Medical Graphics Card Revenue (undefined) Forecast, by Application 2020 & 2033
- Table 10: Global Medical Graphics Card Revenue undefined Forecast, by Application 2020 & 2033
- Table 11: Global Medical Graphics Card Revenue undefined Forecast, by Types 2020 & 2033
- Table 12: Global Medical Graphics Card Revenue undefined Forecast, by Country 2020 & 2033
- Table 13: Brazil Medical Graphics Card Revenue (undefined) Forecast, by Application 2020 & 2033
- Table 14: Argentina Medical Graphics Card Revenue (undefined) Forecast, by Application 2020 & 2033
- Table 15: Rest of South America Medical Graphics Card Revenue (undefined) Forecast, by Application 2020 & 2033
- Table 16: Global Medical Graphics Card Revenue undefined Forecast, by Application 2020 & 2033
- Table 17: Global Medical Graphics Card Revenue undefined Forecast, by Types 2020 & 2033
- Table 18: Global Medical Graphics Card Revenue undefined Forecast, by Country 2020 & 2033
- Table 19: United Kingdom Medical Graphics Card Revenue (undefined) Forecast, by Application 2020 & 2033
- Table 20: Germany Medical Graphics Card Revenue (undefined) Forecast, by Application 2020 & 2033
- Table 21: France Medical Graphics Card Revenue (undefined) Forecast, by Application 2020 & 2033
- Table 22: Italy Medical Graphics Card Revenue (undefined) Forecast, by Application 2020 & 2033
- Table 23: Spain Medical Graphics Card Revenue (undefined) Forecast, by Application 2020 & 2033
- Table 24: Russia Medical Graphics Card Revenue (undefined) Forecast, by Application 2020 & 2033
- Table 25: Benelux Medical Graphics Card Revenue (undefined) Forecast, by Application 2020 & 2033
- Table 26: Nordics Medical Graphics Card Revenue (undefined) Forecast, by Application 2020 & 2033
- Table 27: Rest of Europe Medical Graphics Card Revenue (undefined) Forecast, by Application 2020 & 2033
- Table 28: Global Medical Graphics Card Revenue undefined Forecast, by Application 2020 & 2033
- Table 29: Global Medical Graphics Card Revenue undefined Forecast, by Types 2020 & 2033
- Table 30: Global Medical Graphics Card Revenue undefined Forecast, by Country 2020 & 2033
- Table 31: Turkey Medical Graphics Card Revenue (undefined) Forecast, by Application 2020 & 2033
- Table 32: Israel Medical Graphics Card Revenue (undefined) Forecast, by Application 2020 & 2033
- Table 33: GCC Medical Graphics Card Revenue (undefined) Forecast, by Application 2020 & 2033
- Table 34: North Africa Medical Graphics Card Revenue (undefined) Forecast, by Application 2020 & 2033
- Table 35: South Africa Medical Graphics Card Revenue (undefined) Forecast, by Application 2020 & 2033
- Table 36: Rest of Middle East & Africa Medical Graphics Card Revenue (undefined) Forecast, by Application 2020 & 2033
- Table 37: Global Medical Graphics Card Revenue undefined Forecast, by Application 2020 & 2033
- Table 38: Global Medical Graphics Card Revenue undefined Forecast, by Types 2020 & 2033
- Table 39: Global Medical Graphics Card Revenue undefined Forecast, by Country 2020 & 2033
- Table 40: China Medical Graphics Card Revenue (undefined) Forecast, by Application 2020 & 2033
- Table 41: India Medical Graphics Card Revenue (undefined) Forecast, by Application 2020 & 2033
- Table 42: Japan Medical Graphics Card Revenue (undefined) Forecast, by Application 2020 & 2033
- Table 43: South Korea Medical Graphics Card Revenue (undefined) Forecast, by Application 2020 & 2033
- Table 44: ASEAN Medical Graphics Card Revenue (undefined) Forecast, by Application 2020 & 2033
- Table 45: Oceania Medical Graphics Card Revenue (undefined) Forecast, by Application 2020 & 2033
- Table 46: Rest of Asia Pacific Medical Graphics Card Revenue (undefined) Forecast, by Application 2020 & 2033
Frequently Asked Questions
1. What is the projected Compound Annual Growth Rate (CAGR) of the Medical Graphics Card?
The projected CAGR is approximately 32.8%.
2. Which companies are prominent players in the Medical Graphics Card?
Key companies in the market include EIZO, Advanced Micro Devices, Barco, Nvidia, Matrox, JVC Kenwood, Siemens, Parity Medical, ADLINK, Aetina Corporation, Onyx Healthcare, Advantech, Leadtek, Sapphire Technology.
3. What are the main segments of the Medical Graphics Card?
The market segments include Application, Types.
4. Can you provide details about the market size?
The market size is estimated to be USD XXX N/A as of 2022.
5. What are some drivers contributing to market growth?
N/A
6. What are the notable trends driving market growth?
N/A
7. Are there any restraints impacting market growth?
N/A
8. Can you provide examples of recent developments in the market?
N/A
9. What pricing options are available for accessing the report?
Pricing options include single-user, multi-user, and enterprise licenses priced at USD 2900.00, USD 4350.00, and USD 5800.00 respectively.
10. Is the market size provided in terms of value or volume?
The market size is provided in terms of value, measured in N/A.
11. Are there any specific market keywords associated with the report?
Yes, the market keyword associated with the report is "Medical Graphics Card," which aids in identifying and referencing the specific market segment covered.
12. How do I determine which pricing option suits my needs best?
The pricing options vary based on user requirements and access needs. Individual users may opt for single-user licenses, while businesses requiring broader access may choose multi-user or enterprise licenses for cost-effective access to the report.
13. Are there any additional resources or data provided in the Medical Graphics Card report?
While the report offers comprehensive insights, it's advisable to review the specific contents or supplementary materials provided to ascertain if additional resources or data are available.
14. How can I stay updated on further developments or reports in the Medical Graphics Card?
To stay informed about further developments, trends, and reports in the Medical Graphics Card, consider subscribing to industry newsletters, following relevant companies and organizations, or regularly checking reputable industry news sources and publications.
Methodology
Step 1 - Identification of Relevant Samples Size from Population Database


Step 2 - Approaches for Defining Global Market Size (Value, Volume* & Price*)

Note*: In applicable scenarios
Step 3 - Data Sources
Primary Research
- Web Analytics
- Survey Reports
- Research Institute
- Latest Research Reports
- Opinion Leaders
Secondary Research
- Annual Reports
- White Paper
- Latest Press Release
- Industry Association
- Paid Database
- Investor Presentations

Step 4 - Data Triangulation
Involves using different sources of information in order to increase the validity of a study
These sources are likely to be stakeholders in a program - participants, other researchers, program staff, other community members, and so on.
Then we put all data in single framework & apply various statistical tools to find out the dynamic on the market.
During the analysis stage, feedback from the stakeholder groups would be compared to determine areas of agreement as well as areas of divergence