

Key Insights
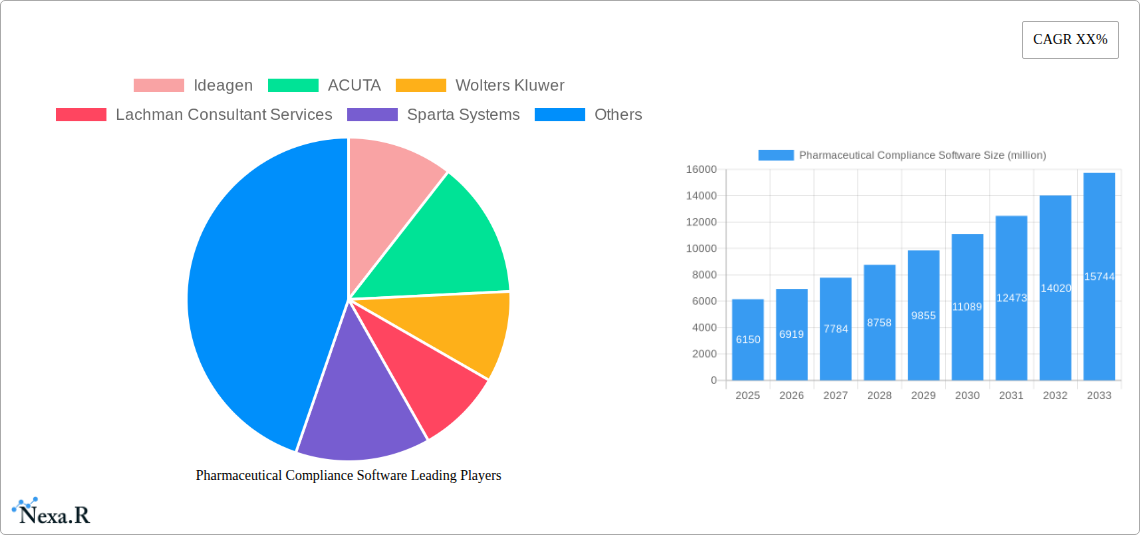
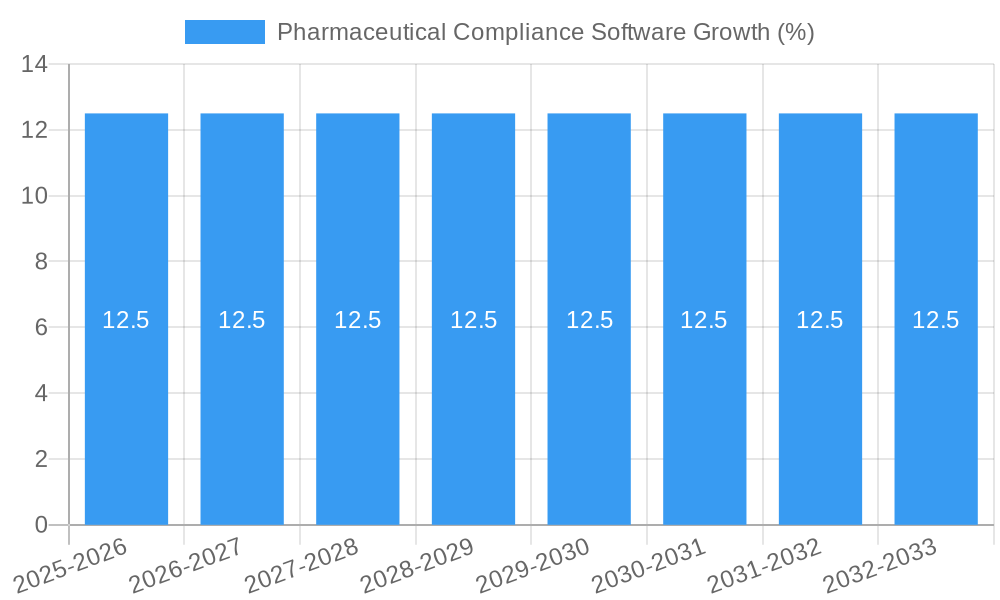
The global Pharmaceutical Compliance Software market is poised for significant expansion, projected to reach an estimated market size of $6,150 million by 2025, with a robust Compound Annual Growth Rate (CAGR) of 12.5% anticipated throughout the forecast period of 2025-2033. This impressive growth is propelled by an increasing regulatory burden faced by pharmaceutical companies worldwide, coupled with the escalating need for streamlined quality management and robust data integrity solutions. The digital transformation within the pharmaceutical sector, driven by advancements in cloud technology and the demand for greater operational efficiency, further fuels this market surge. Key drivers include the growing complexity of drug development and manufacturing processes, stringent adherence requirements for Good Manufacturing Practices (GMP), Good Clinical Practices (GCP), and Good Laboratory Practices (GLP), and the imperative to mitigate risks associated with product recalls and regulatory non-compliance. The increasing focus on patient safety and data security further necessitates the adoption of sophisticated compliance software.
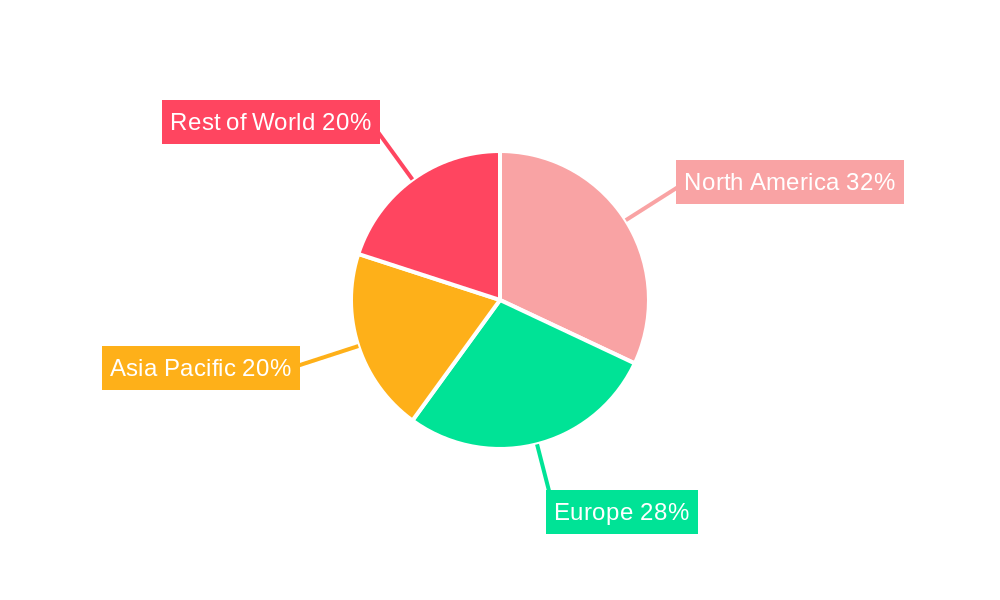
The market is broadly segmented into Product Information Management and Pharmaceutical Electronic Registration for applications, with a clear preference emerging for Cloud-Based Pharmaceutical Compliance Software over its On-Premise counterpart due to its scalability, accessibility, and cost-effectiveness. Leading players such as Ideagen, Wolters Kluwer, Sparta Systems, and MasterControl are actively innovating and expanding their offerings to cater to the evolving needs of the pharmaceutical industry. Geographically, North America and Europe currently dominate the market, owing to their well-established pharmaceutical industries and strict regulatory frameworks. However, the Asia Pacific region is expected to witness the fastest growth, driven by expanding pharmaceutical manufacturing bases, increasing healthcare expenditure, and a growing awareness of compliance requirements. The market anticipates continued consolidation and strategic partnerships as companies strive to offer comprehensive, end-to-end compliance solutions.
Pharmaceutical Compliance Software Market Dynamics & Structure
The pharmaceutical compliance software market is characterized by a moderate concentration, with a few key players like Ideagen, Wolters Kluwer, and MasterControl holding significant shares. Technological innovation, particularly in AI-driven data analytics and automated compliance workflows, acts as a primary driver. Stringent regulatory frameworks, including FDA and EMA guidelines, necessitate robust compliance solutions, influencing product development and adoption. Competitive product substitutes, such as manual processes and less integrated systems, are gradually being phased out by sophisticated software. End-user demographics are dominated by pharmaceutical manufacturers, contract research organizations (CROs), and biotechnology firms, all seeking to streamline regulatory processes and mitigate risks. Merger and acquisition (M&A) trends are active, with companies acquiring smaller, specialized software providers to expand their portfolios and market reach. The volume of M&A deals has been steadily increasing, with an estimated XX deals in the past year. Barriers to innovation include high development costs and the need for continuous adaptation to evolving regulations.
- Market Concentration: Moderate, with key players and emerging innovators.
- Technological Innovation: Driven by AI, automation, and data analytics.
- Regulatory Frameworks: FDA, EMA, and other global health authority mandates are critical.
- Competitive Substitutes: Manual processes, legacy systems.
- End-User Demographics: Pharmaceutical manufacturers, CROs, biotech firms.
- M&A Trends: Active, with strategic acquisitions to enhance capabilities.
Pharmaceutical Compliance Software Growth Trends & Insights
The global pharmaceutical compliance software market is projected for substantial growth, exhibiting a compound annual growth rate (CAGR) of xx% from 2025 to 2033. This robust expansion is underpinned by an increasing awareness of regulatory intricacies and the escalating costs associated with non-compliance. Market penetration for advanced compliance solutions is anticipated to rise from xx% in 2025 to xx% by 2033, reflecting a growing reliance on digital tools. Technological disruptions, such as the integration of blockchain for enhanced data integrity and cloud-based solutions offering scalability and accessibility, are reshaping the market. Consumer behavior shifts, driven by the need for greater transparency and faster drug development cycles, are pushing pharmaceutical companies to adopt more efficient and integrated compliance platforms. The market size, valued at approximately $xx billion in 2025, is expected to reach $xx billion by 2033. This growth trajectory is also influenced by the increasing complexity of global pharmaceutical supply chains and the heightened scrutiny from regulatory bodies worldwide, compelling organizations to invest in comprehensive compliance management systems. The adoption rate of cloud-based solutions is significantly higher than on-premise alternatives due to lower upfront costs and greater flexibility. Furthermore, the rising incidence of product recalls and the associated financial and reputational damage are serving as strong motivators for proactive compliance investments. The digital transformation wave across the healthcare and life sciences industries further amplifies the demand for sophisticated software that can manage the entire lifecycle of pharmaceutical products with strict adherence to regulatory standards.
Dominant Regions, Countries, or Segments in Pharmaceutical Compliance Software
North America, particularly the United States, stands out as the dominant region in the pharmaceutical compliance software market. This dominance is fueled by the presence of a highly developed pharmaceutical industry, stringent regulatory oversight by the Food and Drug Administration (FDA), and a strong emphasis on technological adoption. The Application segment of Product Information Management is a key growth driver within this region, as companies increasingly focus on accurate and efficient management of complex product data for regulatory submissions and marketing. The United States alone accounts for an estimated xx% of the global market share in pharmaceutical compliance software in 2025.
- North America's Dominance: Driven by robust pharmaceutical R&D, strong regulatory bodies like the FDA, and high technology adoption rates.
- United States as a Key Market: Holds a significant portion of the global market share due to a mature pharmaceutical ecosystem and strict compliance requirements.
- Product Information Management (PIM) as a Key Application: Crucial for managing extensive product data, dossier preparation, and global regulatory submissions. This segment is experiencing accelerated adoption.
- Cloud-Based Pharmaceutical Compliance Software: This Type segment is also a significant contributor to growth, offering scalability, flexibility, and cost-effectiveness, aligning with the needs of modern pharmaceutical operations.
- Economic Policies and Infrastructure: Supportive government policies promoting innovation in the life sciences sector and advanced digital infrastructure contribute to market expansion.
- Regulatory Frameworks: The FDA's comprehensive guidelines and enforcement mechanisms necessitate the use of advanced compliance software.
- Growth Potential: The region is expected to maintain its leadership position throughout the forecast period, with an anticipated CAGR of xx% from 2025–2033.
Pharmaceutical Compliance Software Product Landscape
The pharmaceutical compliance software product landscape is rich with innovations designed to address the evolving needs of the industry. Key applications include comprehensive Product Information Management (PIM) systems that streamline the creation, approval, and distribution of product-related documentation, as well as Pharmaceutical Electronic Registration solutions that simplify the complex process of submitting regulatory dossiers to global health authorities. Cloud-Based Pharmaceutical Compliance Software dominates the market due to its scalability, accessibility, and reduced IT overhead, while On-Premise Pharmaceutical Compliance Software remains relevant for organizations with specific data security or integration requirements. Unique selling propositions often revolve around intuitive user interfaces, advanced analytics, automated workflow capabilities, and seamless integration with existing enterprise resource planning (ERP) and laboratory information management systems (LIMS). Technological advancements like AI-powered risk assessment and machine learning for predictive compliance are setting new benchmarks for product performance.
Key Drivers, Barriers & Challenges in Pharmaceutical Compliance Software
The pharmaceutical compliance software market is propelled by several key drivers, including the escalating complexity of global regulatory landscapes, the increasing need for data integrity and traceability, and the growing demand for operational efficiency in drug development and manufacturing. Technological advancements in areas such as AI and automation are also significant drivers, enabling more sophisticated compliance solutions.
- Drivers: Stringent regulatory requirements, data integrity concerns, operational efficiency needs, AI and automation advancements.
Key challenges and restraints in this market include the high cost of implementation and ongoing maintenance of compliance software, the need for continuous adaptation to ever-changing regulations, and the resistance to change within some organizations. Supply chain disruptions and cybersecurity threats also pose significant challenges, potentially impacting data security and system availability.
- Barriers & Challenges: High implementation costs, evolving regulations, organizational resistance to change, cybersecurity threats, supply chain vulnerabilities.
Emerging Opportunities in Pharmaceutical Compliance Software
Emerging opportunities lie in the development of AI-powered predictive compliance analytics that can proactively identify potential regulatory issues, thereby reducing the risk of costly violations. The growing demand for integrated solutions that span the entire pharmaceutical lifecycle, from R&D to post-market surveillance, presents a significant avenue for growth. Furthermore, the expansion of emerging markets in Asia-Pacific and Latin America, coupled with their increasing adoption of stringent pharmaceutical regulations, offers untapped potential for market players. The niche market for specialized compliance software in areas like pharmacovigilance and clinical trial management also presents promising growth prospects.
Growth Accelerators in the Pharmaceutical Compliance Software Industry
Several catalysts are accelerating growth in the pharmaceutical compliance software industry. Technological breakthroughs, such as the integration of blockchain for enhanced data security and traceability, are transforming compliance management. Strategic partnerships between software providers and pharmaceutical companies are fostering innovation and market penetration. Furthermore, market expansion strategies focusing on emerging economies with growing pharmaceutical sectors and evolving regulatory landscapes are creating new avenues for revenue generation. The increasing adoption of cloud-based solutions, offering greater flexibility and cost-effectiveness, is also a significant growth accelerator.
Key Players Shaping the Pharmaceutical Compliance Software Market
- Ideagen
- ACUTA
- Wolters Kluwer
- Lachman Consultant Services
- Sparta Systems
- Intagras
- LogicManager
- LogicGate
- Bwise
- Qordata
- Qualsys
- Axway
- Med-Script
- QUMAS
- MasterControl
Notable Milestones in Pharmaceutical Compliance Software Sector
- 2019: Launch of advanced AI-driven risk assessment modules by leading vendors, enhancing proactive compliance.
- 2020: Increased adoption of cloud-based solutions surged due to remote work mandates, improving accessibility.
- 2021: Major software vendors integrated blockchain technology for enhanced data integrity in clinical trials.
- 2022: Significant M&A activity as larger players acquired specialized compliance solution providers to broaden their offerings.
- 2023: Regulatory bodies like the FDA released updated guidance on digital transformation in the pharmaceutical industry, driving demand for modern compliance tools.
- 2024: Introduction of more sophisticated electronic submission management systems for faster global regulatory approvals.
In-Depth Pharmaceutical Compliance Software Market Outlook
The future outlook for the pharmaceutical compliance software market is exceptionally promising, driven by an ongoing commitment to patient safety and product quality. Growth accelerators, including advanced analytics, AI integration for predictive compliance, and the expanding reach of cloud-based platforms, will continue to shape market dynamics. Strategic partnerships and a focus on emerging markets are poised to unlock significant untapped potential. The market is expected to witness sustained expansion as pharmaceutical organizations globally prioritize robust, efficient, and secure compliance solutions to navigate an increasingly complex regulatory environment and accelerate drug development timelines.
Pharmaceutical Compliance Software Segmentation
-
1. Application
- 1.1. Product Information Management
- 1.2. Pharmaceutical Electronic Registration
-
2. Types
- 2.1. Cloud-Based Pharmaceutical Compliance Software
- 2.2. On-Premise Pharmaceutical Compliance Software
Pharmaceutical Compliance Software Segmentation By Geography
-
1. North America
- 1.1. United States
- 1.2. Canada
- 1.3. Mexico
-
2. South America
- 2.1. Brazil
- 2.2. Argentina
- 2.3. Rest of South America
-
3. Europe
- 3.1. United Kingdom
- 3.2. Germany
- 3.3. France
- 3.4. Italy
- 3.5. Spain
- 3.6. Russia
- 3.7. Benelux
- 3.8. Nordics
- 3.9. Rest of Europe
-
4. Middle East & Africa
- 4.1. Turkey
- 4.2. Israel
- 4.3. GCC
- 4.4. North Africa
- 4.5. South Africa
- 4.6. Rest of Middle East & Africa
-
5. Asia Pacific
- 5.1. China
- 5.2. India
- 5.3. Japan
- 5.4. South Korea
- 5.5. ASEAN
- 5.6. Oceania
- 5.7. Rest of Asia Pacific
Pharmaceutical Compliance Software REPORT HIGHLIGHTS
| Aspects | Details |
|---|---|
| Study Period | 2019-2033 |
| Base Year | 2024 |
| Estimated Year | 2025 |
| Forecast Period | 2025-2033 |
| Historical Period | 2019-2024 |
| Growth Rate | CAGR of XX% from 2019-2033 |
| Segmentation |
|
Table of Contents
- 1. Introduction
- 1.1. Research Scope
- 1.2. Market Segmentation
- 1.3. Research Methodology
- 1.4. Definitions and Assumptions
- 2. Executive Summary
- 2.1. Introduction
- 3. Market Dynamics
- 3.1. Introduction
- 3.2. Market Drivers
- 3.3. Market Restrains
- 3.4. Market Trends
- 4. Market Factor Analysis
- 4.1. Porters Five Forces
- 4.2. Supply/Value Chain
- 4.3. PESTEL analysis
- 4.4. Market Entropy
- 4.5. Patent/Trademark Analysis
- 5. Global Pharmaceutical Compliance Software Analysis, Insights and Forecast, 2019-2031
- 5.1. Market Analysis, Insights and Forecast - by Application
- 5.1.1. Product Information Management
- 5.1.2. Pharmaceutical Electronic Registration
- 5.2. Market Analysis, Insights and Forecast - by Types
- 5.2.1. Cloud-Based Pharmaceutical Compliance Software
- 5.2.2. On-Premise Pharmaceutical Compliance Software
- 5.3. Market Analysis, Insights and Forecast - by Region
- 5.3.1. North America
- 5.3.2. South America
- 5.3.3. Europe
- 5.3.4. Middle East & Africa
- 5.3.5. Asia Pacific
- 5.1. Market Analysis, Insights and Forecast - by Application
- 6. North America Pharmaceutical Compliance Software Analysis, Insights and Forecast, 2019-2031
- 6.1. Market Analysis, Insights and Forecast - by Application
- 6.1.1. Product Information Management
- 6.1.2. Pharmaceutical Electronic Registration
- 6.2. Market Analysis, Insights and Forecast - by Types
- 6.2.1. Cloud-Based Pharmaceutical Compliance Software
- 6.2.2. On-Premise Pharmaceutical Compliance Software
- 6.1. Market Analysis, Insights and Forecast - by Application
- 7. South America Pharmaceutical Compliance Software Analysis, Insights and Forecast, 2019-2031
- 7.1. Market Analysis, Insights and Forecast - by Application
- 7.1.1. Product Information Management
- 7.1.2. Pharmaceutical Electronic Registration
- 7.2. Market Analysis, Insights and Forecast - by Types
- 7.2.1. Cloud-Based Pharmaceutical Compliance Software
- 7.2.2. On-Premise Pharmaceutical Compliance Software
- 7.1. Market Analysis, Insights and Forecast - by Application
- 8. Europe Pharmaceutical Compliance Software Analysis, Insights and Forecast, 2019-2031
- 8.1. Market Analysis, Insights and Forecast - by Application
- 8.1.1. Product Information Management
- 8.1.2. Pharmaceutical Electronic Registration
- 8.2. Market Analysis, Insights and Forecast - by Types
- 8.2.1. Cloud-Based Pharmaceutical Compliance Software
- 8.2.2. On-Premise Pharmaceutical Compliance Software
- 8.1. Market Analysis, Insights and Forecast - by Application
- 9. Middle East & Africa Pharmaceutical Compliance Software Analysis, Insights and Forecast, 2019-2031
- 9.1. Market Analysis, Insights and Forecast - by Application
- 9.1.1. Product Information Management
- 9.1.2. Pharmaceutical Electronic Registration
- 9.2. Market Analysis, Insights and Forecast - by Types
- 9.2.1. Cloud-Based Pharmaceutical Compliance Software
- 9.2.2. On-Premise Pharmaceutical Compliance Software
- 9.1. Market Analysis, Insights and Forecast - by Application
- 10. Asia Pacific Pharmaceutical Compliance Software Analysis, Insights and Forecast, 2019-2031
- 10.1. Market Analysis, Insights and Forecast - by Application
- 10.1.1. Product Information Management
- 10.1.2. Pharmaceutical Electronic Registration
- 10.2. Market Analysis, Insights and Forecast - by Types
- 10.2.1. Cloud-Based Pharmaceutical Compliance Software
- 10.2.2. On-Premise Pharmaceutical Compliance Software
- 10.1. Market Analysis, Insights and Forecast - by Application
- 11. Competitive Analysis
- 11.1. Global Market Share Analysis 2024
- 11.2. Company Profiles
- 11.2.1 Ideagen
- 11.2.1.1. Overview
- 11.2.1.2. Products
- 11.2.1.3. SWOT Analysis
- 11.2.1.4. Recent Developments
- 11.2.1.5. Financials (Based on Availability)
- 11.2.2 ACUTA
- 11.2.2.1. Overview
- 11.2.2.2. Products
- 11.2.2.3. SWOT Analysis
- 11.2.2.4. Recent Developments
- 11.2.2.5. Financials (Based on Availability)
- 11.2.3 Wolters Kluwer
- 11.2.3.1. Overview
- 11.2.3.2. Products
- 11.2.3.3. SWOT Analysis
- 11.2.3.4. Recent Developments
- 11.2.3.5. Financials (Based on Availability)
- 11.2.4 Lachman Consultant Services
- 11.2.4.1. Overview
- 11.2.4.2. Products
- 11.2.4.3. SWOT Analysis
- 11.2.4.4. Recent Developments
- 11.2.4.5. Financials (Based on Availability)
- 11.2.5 Sparta Systems
- 11.2.5.1. Overview
- 11.2.5.2. Products
- 11.2.5.3. SWOT Analysis
- 11.2.5.4. Recent Developments
- 11.2.5.5. Financials (Based on Availability)
- 11.2.6 Intagras
- 11.2.6.1. Overview
- 11.2.6.2. Products
- 11.2.6.3. SWOT Analysis
- 11.2.6.4. Recent Developments
- 11.2.6.5. Financials (Based on Availability)
- 11.2.7 LogicManager
- 11.2.7.1. Overview
- 11.2.7.2. Products
- 11.2.7.3. SWOT Analysis
- 11.2.7.4. Recent Developments
- 11.2.7.5. Financials (Based on Availability)
- 11.2.8 LogicGate
- 11.2.8.1. Overview
- 11.2.8.2. Products
- 11.2.8.3. SWOT Analysis
- 11.2.8.4. Recent Developments
- 11.2.8.5. Financials (Based on Availability)
- 11.2.9 Bwise
- 11.2.9.1. Overview
- 11.2.9.2. Products
- 11.2.9.3. SWOT Analysis
- 11.2.9.4. Recent Developments
- 11.2.9.5. Financials (Based on Availability)
- 11.2.10 Qordata
- 11.2.10.1. Overview
- 11.2.10.2. Products
- 11.2.10.3. SWOT Analysis
- 11.2.10.4. Recent Developments
- 11.2.10.5. Financials (Based on Availability)
- 11.2.11 Qualsys
- 11.2.11.1. Overview
- 11.2.11.2. Products
- 11.2.11.3. SWOT Analysis
- 11.2.11.4. Recent Developments
- 11.2.11.5. Financials (Based on Availability)
- 11.2.12 Axway
- 11.2.12.1. Overview
- 11.2.12.2. Products
- 11.2.12.3. SWOT Analysis
- 11.2.12.4. Recent Developments
- 11.2.12.5. Financials (Based on Availability)
- 11.2.13 Med-Script
- 11.2.13.1. Overview
- 11.2.13.2. Products
- 11.2.13.3. SWOT Analysis
- 11.2.13.4. Recent Developments
- 11.2.13.5. Financials (Based on Availability)
- 11.2.14 QUMAS
- 11.2.14.1. Overview
- 11.2.14.2. Products
- 11.2.14.3. SWOT Analysis
- 11.2.14.4. Recent Developments
- 11.2.14.5. Financials (Based on Availability)
- 11.2.15 MasterControl
- 11.2.15.1. Overview
- 11.2.15.2. Products
- 11.2.15.3. SWOT Analysis
- 11.2.15.4. Recent Developments
- 11.2.15.5. Financials (Based on Availability)
- 11.2.1 Ideagen
List of Figures
- Figure 1: Global Pharmaceutical Compliance Software Revenue Breakdown (million, %) by Region 2024 & 2032
- Figure 2: North America Pharmaceutical Compliance Software Revenue (million), by Application 2024 & 2032
- Figure 3: North America Pharmaceutical Compliance Software Revenue Share (%), by Application 2024 & 2032
- Figure 4: North America Pharmaceutical Compliance Software Revenue (million), by Types 2024 & 2032
- Figure 5: North America Pharmaceutical Compliance Software Revenue Share (%), by Types 2024 & 2032
- Figure 6: North America Pharmaceutical Compliance Software Revenue (million), by Country 2024 & 2032
- Figure 7: North America Pharmaceutical Compliance Software Revenue Share (%), by Country 2024 & 2032
- Figure 8: South America Pharmaceutical Compliance Software Revenue (million), by Application 2024 & 2032
- Figure 9: South America Pharmaceutical Compliance Software Revenue Share (%), by Application 2024 & 2032
- Figure 10: South America Pharmaceutical Compliance Software Revenue (million), by Types 2024 & 2032
- Figure 11: South America Pharmaceutical Compliance Software Revenue Share (%), by Types 2024 & 2032
- Figure 12: South America Pharmaceutical Compliance Software Revenue (million), by Country 2024 & 2032
- Figure 13: South America Pharmaceutical Compliance Software Revenue Share (%), by Country 2024 & 2032
- Figure 14: Europe Pharmaceutical Compliance Software Revenue (million), by Application 2024 & 2032
- Figure 15: Europe Pharmaceutical Compliance Software Revenue Share (%), by Application 2024 & 2032
- Figure 16: Europe Pharmaceutical Compliance Software Revenue (million), by Types 2024 & 2032
- Figure 17: Europe Pharmaceutical Compliance Software Revenue Share (%), by Types 2024 & 2032
- Figure 18: Europe Pharmaceutical Compliance Software Revenue (million), by Country 2024 & 2032
- Figure 19: Europe Pharmaceutical Compliance Software Revenue Share (%), by Country 2024 & 2032
- Figure 20: Middle East & Africa Pharmaceutical Compliance Software Revenue (million), by Application 2024 & 2032
- Figure 21: Middle East & Africa Pharmaceutical Compliance Software Revenue Share (%), by Application 2024 & 2032
- Figure 22: Middle East & Africa Pharmaceutical Compliance Software Revenue (million), by Types 2024 & 2032
- Figure 23: Middle East & Africa Pharmaceutical Compliance Software Revenue Share (%), by Types 2024 & 2032
- Figure 24: Middle East & Africa Pharmaceutical Compliance Software Revenue (million), by Country 2024 & 2032
- Figure 25: Middle East & Africa Pharmaceutical Compliance Software Revenue Share (%), by Country 2024 & 2032
- Figure 26: Asia Pacific Pharmaceutical Compliance Software Revenue (million), by Application 2024 & 2032
- Figure 27: Asia Pacific Pharmaceutical Compliance Software Revenue Share (%), by Application 2024 & 2032
- Figure 28: Asia Pacific Pharmaceutical Compliance Software Revenue (million), by Types 2024 & 2032
- Figure 29: Asia Pacific Pharmaceutical Compliance Software Revenue Share (%), by Types 2024 & 2032
- Figure 30: Asia Pacific Pharmaceutical Compliance Software Revenue (million), by Country 2024 & 2032
- Figure 31: Asia Pacific Pharmaceutical Compliance Software Revenue Share (%), by Country 2024 & 2032
List of Tables
- Table 1: Global Pharmaceutical Compliance Software Revenue million Forecast, by Region 2019 & 2032
- Table 2: Global Pharmaceutical Compliance Software Revenue million Forecast, by Application 2019 & 2032
- Table 3: Global Pharmaceutical Compliance Software Revenue million Forecast, by Types 2019 & 2032
- Table 4: Global Pharmaceutical Compliance Software Revenue million Forecast, by Region 2019 & 2032
- Table 5: Global Pharmaceutical Compliance Software Revenue million Forecast, by Application 2019 & 2032
- Table 6: Global Pharmaceutical Compliance Software Revenue million Forecast, by Types 2019 & 2032
- Table 7: Global Pharmaceutical Compliance Software Revenue million Forecast, by Country 2019 & 2032
- Table 8: United States Pharmaceutical Compliance Software Revenue (million) Forecast, by Application 2019 & 2032
- Table 9: Canada Pharmaceutical Compliance Software Revenue (million) Forecast, by Application 2019 & 2032
- Table 10: Mexico Pharmaceutical Compliance Software Revenue (million) Forecast, by Application 2019 & 2032
- Table 11: Global Pharmaceutical Compliance Software Revenue million Forecast, by Application 2019 & 2032
- Table 12: Global Pharmaceutical Compliance Software Revenue million Forecast, by Types 2019 & 2032
- Table 13: Global Pharmaceutical Compliance Software Revenue million Forecast, by Country 2019 & 2032
- Table 14: Brazil Pharmaceutical Compliance Software Revenue (million) Forecast, by Application 2019 & 2032
- Table 15: Argentina Pharmaceutical Compliance Software Revenue (million) Forecast, by Application 2019 & 2032
- Table 16: Rest of South America Pharmaceutical Compliance Software Revenue (million) Forecast, by Application 2019 & 2032
- Table 17: Global Pharmaceutical Compliance Software Revenue million Forecast, by Application 2019 & 2032
- Table 18: Global Pharmaceutical Compliance Software Revenue million Forecast, by Types 2019 & 2032
- Table 19: Global Pharmaceutical Compliance Software Revenue million Forecast, by Country 2019 & 2032
- Table 20: United Kingdom Pharmaceutical Compliance Software Revenue (million) Forecast, by Application 2019 & 2032
- Table 21: Germany Pharmaceutical Compliance Software Revenue (million) Forecast, by Application 2019 & 2032
- Table 22: France Pharmaceutical Compliance Software Revenue (million) Forecast, by Application 2019 & 2032
- Table 23: Italy Pharmaceutical Compliance Software Revenue (million) Forecast, by Application 2019 & 2032
- Table 24: Spain Pharmaceutical Compliance Software Revenue (million) Forecast, by Application 2019 & 2032
- Table 25: Russia Pharmaceutical Compliance Software Revenue (million) Forecast, by Application 2019 & 2032
- Table 26: Benelux Pharmaceutical Compliance Software Revenue (million) Forecast, by Application 2019 & 2032
- Table 27: Nordics Pharmaceutical Compliance Software Revenue (million) Forecast, by Application 2019 & 2032
- Table 28: Rest of Europe Pharmaceutical Compliance Software Revenue (million) Forecast, by Application 2019 & 2032
- Table 29: Global Pharmaceutical Compliance Software Revenue million Forecast, by Application 2019 & 2032
- Table 30: Global Pharmaceutical Compliance Software Revenue million Forecast, by Types 2019 & 2032
- Table 31: Global Pharmaceutical Compliance Software Revenue million Forecast, by Country 2019 & 2032
- Table 32: Turkey Pharmaceutical Compliance Software Revenue (million) Forecast, by Application 2019 & 2032
- Table 33: Israel Pharmaceutical Compliance Software Revenue (million) Forecast, by Application 2019 & 2032
- Table 34: GCC Pharmaceutical Compliance Software Revenue (million) Forecast, by Application 2019 & 2032
- Table 35: North Africa Pharmaceutical Compliance Software Revenue (million) Forecast, by Application 2019 & 2032
- Table 36: South Africa Pharmaceutical Compliance Software Revenue (million) Forecast, by Application 2019 & 2032
- Table 37: Rest of Middle East & Africa Pharmaceutical Compliance Software Revenue (million) Forecast, by Application 2019 & 2032
- Table 38: Global Pharmaceutical Compliance Software Revenue million Forecast, by Application 2019 & 2032
- Table 39: Global Pharmaceutical Compliance Software Revenue million Forecast, by Types 2019 & 2032
- Table 40: Global Pharmaceutical Compliance Software Revenue million Forecast, by Country 2019 & 2032
- Table 41: China Pharmaceutical Compliance Software Revenue (million) Forecast, by Application 2019 & 2032
- Table 42: India Pharmaceutical Compliance Software Revenue (million) Forecast, by Application 2019 & 2032
- Table 43: Japan Pharmaceutical Compliance Software Revenue (million) Forecast, by Application 2019 & 2032
- Table 44: South Korea Pharmaceutical Compliance Software Revenue (million) Forecast, by Application 2019 & 2032
- Table 45: ASEAN Pharmaceutical Compliance Software Revenue (million) Forecast, by Application 2019 & 2032
- Table 46: Oceania Pharmaceutical Compliance Software Revenue (million) Forecast, by Application 2019 & 2032
- Table 47: Rest of Asia Pacific Pharmaceutical Compliance Software Revenue (million) Forecast, by Application 2019 & 2032
Frequently Asked Questions
1. What is the projected Compound Annual Growth Rate (CAGR) of the Pharmaceutical Compliance Software?
The projected CAGR is approximately XX%.
2. Which companies are prominent players in the Pharmaceutical Compliance Software?
Key companies in the market include Ideagen, ACUTA, Wolters Kluwer, Lachman Consultant Services, Sparta Systems, Intagras, LogicManager, LogicGate, Bwise, Qordata, Qualsys, Axway, Med-Script, QUMAS, MasterControl.
3. What are the main segments of the Pharmaceutical Compliance Software?
The market segments include Application, Types.
4. Can you provide details about the market size?
The market size is estimated to be USD XXX million as of 2022.
5. What are some drivers contributing to market growth?
N/A
6. What are the notable trends driving market growth?
N/A
7. Are there any restraints impacting market growth?
N/A
8. Can you provide examples of recent developments in the market?
N/A
9. What pricing options are available for accessing the report?
Pricing options include single-user, multi-user, and enterprise licenses priced at USD 3350.00, USD 5025.00, and USD 6700.00 respectively.
10. Is the market size provided in terms of value or volume?
The market size is provided in terms of value, measured in million.
11. Are there any specific market keywords associated with the report?
Yes, the market keyword associated with the report is "Pharmaceutical Compliance Software," which aids in identifying and referencing the specific market segment covered.
12. How do I determine which pricing option suits my needs best?
The pricing options vary based on user requirements and access needs. Individual users may opt for single-user licenses, while businesses requiring broader access may choose multi-user or enterprise licenses for cost-effective access to the report.
13. Are there any additional resources or data provided in the Pharmaceutical Compliance Software report?
While the report offers comprehensive insights, it's advisable to review the specific contents or supplementary materials provided to ascertain if additional resources or data are available.
14. How can I stay updated on further developments or reports in the Pharmaceutical Compliance Software?
To stay informed about further developments, trends, and reports in the Pharmaceutical Compliance Software, consider subscribing to industry newsletters, following relevant companies and organizations, or regularly checking reputable industry news sources and publications.
Methodology
Step 1 - Identification of Relevant Samples Size from Population Database


Step 2 - Approaches for Defining Global Market Size (Value, Volume* & Price*)

Note*: In applicable scenarios
Step 3 - Data Sources
Primary Research
- Web Analytics
- Survey Reports
- Research Institute
- Latest Research Reports
- Opinion Leaders
Secondary Research
- Annual Reports
- White Paper
- Latest Press Release
- Industry Association
- Paid Database
- Investor Presentations

Step 4 - Data Triangulation
Involves using different sources of information in order to increase the validity of a study
These sources are likely to be stakeholders in a program - participants, other researchers, program staff, other community members, and so on.
Then we put all data in single framework & apply various statistical tools to find out the dynamic on the market.
During the analysis stage, feedback from the stakeholder groups would be compared to determine areas of agreement as well as areas of divergence
