

Key Insights
The global plastic and paper plate market is experiencing robust growth, driven by increasing demand from the food service industry, particularly fast-food restaurants and caterers. Convenience, affordability, and disposability are key factors fueling this demand. The market is segmented by material type (plastic vs. paper), application (food service, household, events), and region. While plastic plates dominate the market due to their durability and lower cost, the growing awareness of environmental concerns is driving a significant shift towards sustainable alternatives, particularly biodegradable and compostable paper plates. This trend is further amplified by stricter government regulations on plastic waste in several regions. Key players in the market are constantly innovating to meet this demand, focusing on developing eco-friendly materials and improving product aesthetics. The market's growth is also influenced by fluctuations in raw material prices and economic conditions. However, the overall outlook remains positive, with a projected steady increase in market size over the forecast period (2025-2033), driven primarily by the continuous expansion of the food service industry and the adoption of sustainable alternatives.

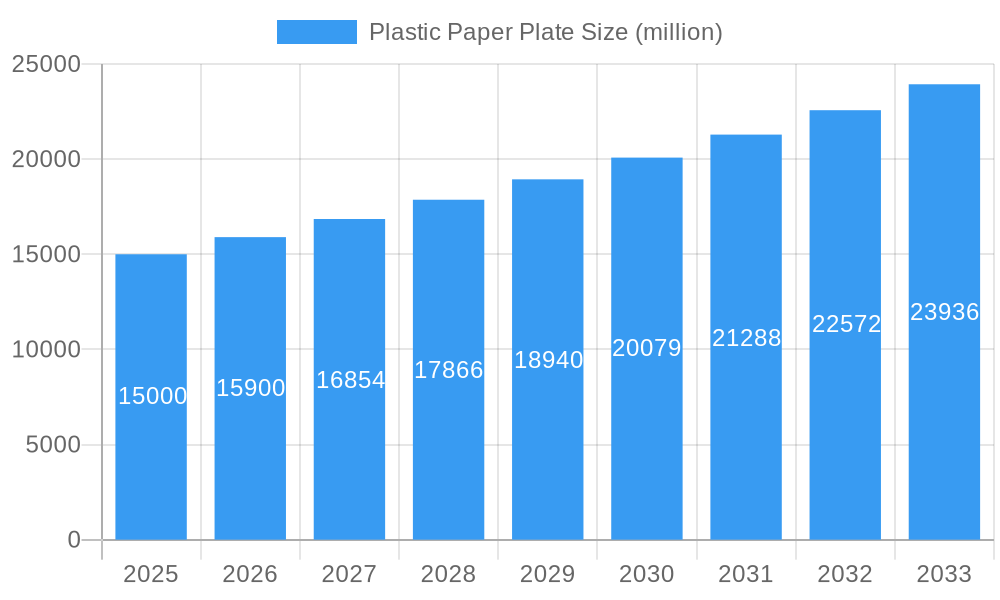
Plastic Paper Plate Market Size (In Billion)
The competitive landscape is characterized by a mix of large multinational corporations and smaller regional players. Major companies like Dart Container Corporation and Huhtamaki Oyj hold significant market share, leveraging their extensive distribution networks and established brand recognition. However, smaller companies are also gaining traction by focusing on niche markets and offering specialized products, such as biodegradable or compostable plates. Future market growth will depend on factors such as technological advancements in material science, consumer preferences for sustainable packaging, and the evolving regulatory landscape surrounding plastic waste. Further growth opportunities exist in developing economies with rapidly expanding food service sectors. Strategic partnerships, mergers and acquisitions, and product diversification will likely be key strategies for companies aiming to maintain a competitive edge. Pricing strategies and product differentiation will also play a vital role in determining market share.
Plastic Paper Plate Company Market Share
Plastic Paper Plate Market Report: 2019-2033
This comprehensive report provides a detailed analysis of the global plastic paper plate market, encompassing market dynamics, growth trends, regional dominance, product landscape, key players, and future outlook. The study period covers 2019-2033, with 2025 serving as the base and estimated year. The forecast period extends from 2025 to 2033, and the historical period analyzed is 2019-2024. This report is crucial for industry professionals, investors, and stakeholders seeking a deep understanding of this dynamic market. The parent market is disposable tableware, and the child market is single-use plates. Market values are presented in million units.
Plastic Paper Plate Market Dynamics & Structure
The global plastic paper plate market is characterized by a moderately concentrated landscape with key players like Dart Container Corporation, Georgia Pacific LLC, Huhtamaki Oyj, and International Paper Company holding significant market share. The market size in 2025 is estimated at xx million units. Technological innovations, particularly in biodegradable and compostable materials, are driving significant change, alongside evolving regulatory frameworks concerning single-use plastics. Competitive substitutes include reusable plates and alternatives made from sustainable materials. End-user demographics show strong demand from the food service, catering, and event planning sectors. M&A activity has been moderate in recent years, with xx deals recorded between 2019 and 2024.
- Market Concentration: Moderately concentrated, with top 5 players holding approximately xx% market share in 2025.
- Technological Innovation: Focus on biodegradable and compostable materials, improved printing techniques, and enhanced durability.
- Regulatory Framework: Increasing restrictions on single-use plastics are impacting market dynamics in several regions.
- Competitive Substitutes: Reusable plates, bamboo plates, and other eco-friendly alternatives pose a competitive threat.
- End-User Demographics: Food service, catering, events, and household consumption are major end-use segments.
- M&A Trends: xx M&A deals recorded between 2019 and 2024, primarily focused on expanding product portfolios and geographical reach.
Plastic Paper Plate Growth Trends & Insights
The global plastic paper plate market exhibited a CAGR of xx% during the historical period (2019-2024). Market size is projected to reach xx million units by 2033, driven by increasing demand from the food service industry and rising disposable incomes in developing economies. The adoption rate of plastic paper plates remains high, particularly in regions with limited access to dishwashing facilities. However, growing environmental concerns are leading to a shift towards eco-friendly alternatives, impacting the growth trajectory of traditional plastic paper plates. Consumer behavior is increasingly influenced by sustainability considerations, leading to a preference for biodegradable and compostable options. Market penetration is expected to reach xx% by 2033. Technological disruptions, such as the introduction of new bioplastics and improved recycling technologies, are shaping the market's future.
Dominant Regions, Countries, or Segments in Plastic Paper Plate
North America and Europe currently dominate the plastic paper plate market, driven by high disposable incomes, robust food service industries, and established distribution networks. However, the Asia-Pacific region is expected to witness significant growth in the forecast period due to rapid urbanization, rising disposable incomes, and increasing demand from the rapidly expanding food service sector. Key drivers include favorable economic policies, expanding infrastructure, and increasing tourism.
- North America: High consumption driven by a large food service industry and established distribution channels. Market share in 2025: xx%.
- Europe: Strong demand from the catering and event industries, coupled with established recycling infrastructure. Market share in 2025: xx%.
- Asia-Pacific: Rapid growth projected due to urbanization, rising disposable incomes, and an expanding food service sector. Market share in 2025: xx%.
- Key Drivers: Economic growth, population increase, tourism, expanding food service sectors.
Plastic Paper Plate Product Landscape
The plastic paper plate market offers a variety of products, ranging from standard disposable plates to premium options with enhanced durability and aesthetic appeal. Innovations include biodegradable and compostable materials, plates with improved printing capabilities for branding purposes, and designs optimized for various food types. Unique selling propositions often focus on sustainability features, convenience, cost-effectiveness, and aesthetic design. Technological advancements are centered on developing more sustainable and recyclable materials.
Key Drivers, Barriers & Challenges in Plastic Paper Plate
Key Drivers:
- Increasing demand from the food service industry.
- Rising disposable incomes in developing economies.
- Convenience and cost-effectiveness.
- Growing popularity of takeaway and delivery services.
Challenges & Restraints:
- Growing environmental concerns and regulations regarding single-use plastics.
- Competition from sustainable alternatives.
- Fluctuations in raw material prices.
- Supply chain disruptions due to geopolitical factors (estimated impact: xx% reduction in supply during [period]).
Emerging Opportunities in Plastic Paper Plate
Emerging opportunities lie in the growing demand for eco-friendly and sustainable alternatives, such as biodegradable and compostable plates. Untapped markets exist in developing economies, while innovative applications, such as specialized plates for catering and events, also offer potential. Evolving consumer preferences toward healthier and more sustainable options present further opportunities for innovation and market expansion.
Growth Accelerators in the Plastic Paper Plate Industry
Long-term growth will be driven by technological breakthroughs in biodegradable materials, strategic partnerships between manufacturers and retailers to expand distribution networks, and market expansion strategies targeting emerging economies. A focus on sustainable packaging solutions will be crucial for maintaining market competitiveness and navigating evolving consumer preferences.
Key Players Shaping the Plastic Paper Plate Market
- Dart Container Corporation
- Georgia Pacific LLC
- Huhtamaki Oyj
- International Paper Company
- Duni AB
- Pactiv LLC
- Genpak LLC
- Lollicup USA Inc.
- Polar Plastic Ltd.
- Go-pak UK Ltd.
Notable Milestones in Plastic Paper Plate Sector
- 2020-03: Introduction of a fully compostable plastic paper plate by [Company Name].
- 2021-11: Dart Container Corporation announces expansion into sustainable packaging.
- 2022-06: Huhtamaki Oyj invests in a new bioplastic production facility.
- 2023-09: New regulations on single-use plastics implemented in [Region].
In-Depth Plastic Paper Plate Market Outlook
The future of the plastic paper plate market hinges on the adoption of sustainable materials and innovative designs. Strategic partnerships, technological advancements, and a focus on catering to evolving consumer preferences will be crucial for long-term success. The market presents significant opportunities for businesses focused on eco-friendly and cost-effective solutions. The potential for growth remains strong, particularly in developing economies and within niche market segments.
Plastic Paper Plate Segmentation
-
1. Type
- 1.1. Plain Plastic Paper Plates
- 1.2. Printed Plastic Paper Plates
- 1.3. Others
-
2. Application
- 2.1. Online Sales
- 2.2. Offline Sales
Plastic Paper Plate Segmentation By Geography
-
1. North America
- 1.1. United States
- 1.2. Canada
- 1.3. Mexico
-
2. South America
- 2.1. Brazil
- 2.2. Argentina
- 2.3. Rest of South America
-
3. Europe
- 3.1. United Kingdom
- 3.2. Germany
- 3.3. France
- 3.4. Italy
- 3.5. Spain
- 3.6. Russia
- 3.7. Benelux
- 3.8. Nordics
- 3.9. Rest of Europe
-
4. Middle East & Africa
- 4.1. Turkey
- 4.2. Israel
- 4.3. GCC
- 4.4. North Africa
- 4.5. South Africa
- 4.6. Rest of Middle East & Africa
-
5. Asia Pacific
- 5.1. China
- 5.2. India
- 5.3. Japan
- 5.4. South Korea
- 5.5. ASEAN
- 5.6. Oceania
- 5.7. Rest of Asia Pacific

Plastic Paper Plate Regional Market Share
Geographic Coverage of Plastic Paper Plate
Plastic Paper Plate REPORT HIGHLIGHTS
| Aspects | Details |
|---|---|
| Study Period | 2020-2034 |
| Base Year | 2025 |
| Estimated Year | 2026 |
| Forecast Period | 2026-2034 |
| Historical Period | 2020-2025 |
| Growth Rate | CAGR of 0.7% from 2020-2034 |
| Segmentation |
|
Table of Contents
- 1. Introduction
- 1.1. Research Scope
- 1.2. Market Segmentation
- 1.3. Research Methodology
- 1.4. Definitions and Assumptions
- 2. Executive Summary
- 2.1. Introduction
- 3. Market Dynamics
- 3.1. Introduction
- 3.2. Market Drivers
- 3.3. Market Restrains
- 3.4. Market Trends
- 4. Market Factor Analysis
- 4.1. Porters Five Forces
- 4.2. Supply/Value Chain
- 4.3. PESTEL analysis
- 4.4. Market Entropy
- 4.5. Patent/Trademark Analysis
- 5. Global Plastic Paper Plate Analysis, Insights and Forecast, 2020-2032
- 5.1. Market Analysis, Insights and Forecast - by Type
- 5.1.1. Plain Plastic Paper Plates
- 5.1.2. Printed Plastic Paper Plates
- 5.1.3. Others
- 5.2. Market Analysis, Insights and Forecast - by Application
- 5.2.1. Online Sales
- 5.2.2. Offline Sales
- 5.3. Market Analysis, Insights and Forecast - by Region
- 5.3.1. North America
- 5.3.2. South America
- 5.3.3. Europe
- 5.3.4. Middle East & Africa
- 5.3.5. Asia Pacific
- 5.1. Market Analysis, Insights and Forecast - by Type
- 6. North America Plastic Paper Plate Analysis, Insights and Forecast, 2020-2032
- 6.1. Market Analysis, Insights and Forecast - by Type
- 6.1.1. Plain Plastic Paper Plates
- 6.1.2. Printed Plastic Paper Plates
- 6.1.3. Others
- 6.2. Market Analysis, Insights and Forecast - by Application
- 6.2.1. Online Sales
- 6.2.2. Offline Sales
- 6.1. Market Analysis, Insights and Forecast - by Type
- 7. South America Plastic Paper Plate Analysis, Insights and Forecast, 2020-2032
- 7.1. Market Analysis, Insights and Forecast - by Type
- 7.1.1. Plain Plastic Paper Plates
- 7.1.2. Printed Plastic Paper Plates
- 7.1.3. Others
- 7.2. Market Analysis, Insights and Forecast - by Application
- 7.2.1. Online Sales
- 7.2.2. Offline Sales
- 7.1. Market Analysis, Insights and Forecast - by Type
- 8. Europe Plastic Paper Plate Analysis, Insights and Forecast, 2020-2032
- 8.1. Market Analysis, Insights and Forecast - by Type
- 8.1.1. Plain Plastic Paper Plates
- 8.1.2. Printed Plastic Paper Plates
- 8.1.3. Others
- 8.2. Market Analysis, Insights and Forecast - by Application
- 8.2.1. Online Sales
- 8.2.2. Offline Sales
- 8.1. Market Analysis, Insights and Forecast - by Type
- 9. Middle East & Africa Plastic Paper Plate Analysis, Insights and Forecast, 2020-2032
- 9.1. Market Analysis, Insights and Forecast - by Type
- 9.1.1. Plain Plastic Paper Plates
- 9.1.2. Printed Plastic Paper Plates
- 9.1.3. Others
- 9.2. Market Analysis, Insights and Forecast - by Application
- 9.2.1. Online Sales
- 9.2.2. Offline Sales
- 9.1. Market Analysis, Insights and Forecast - by Type
- 10. Asia Pacific Plastic Paper Plate Analysis, Insights and Forecast, 2020-2032
- 10.1. Market Analysis, Insights and Forecast - by Type
- 10.1.1. Plain Plastic Paper Plates
- 10.1.2. Printed Plastic Paper Plates
- 10.1.3. Others
- 10.2. Market Analysis, Insights and Forecast - by Application
- 10.2.1. Online Sales
- 10.2.2. Offline Sales
- 10.1. Market Analysis, Insights and Forecast - by Type
- 11. Competitive Analysis
- 11.1. Global Market Share Analysis 2025
- 11.2. Company Profiles
- 11.2.1 Dart Container Corporation
- 11.2.1.1. Overview
- 11.2.1.2. Products
- 11.2.1.3. SWOT Analysis
- 11.2.1.4. Recent Developments
- 11.2.1.5. Financials (Based on Availability)
- 11.2.2 Georgia Pacific LLC
- 11.2.2.1. Overview
- 11.2.2.2. Products
- 11.2.2.3. SWOT Analysis
- 11.2.2.4. Recent Developments
- 11.2.2.5. Financials (Based on Availability)
- 11.2.3 Huhtamaki Oyj
- 11.2.3.1. Overview
- 11.2.3.2. Products
- 11.2.3.3. SWOT Analysis
- 11.2.3.4. Recent Developments
- 11.2.3.5. Financials (Based on Availability)
- 11.2.4 International Paper Company
- 11.2.4.1. Overview
- 11.2.4.2. Products
- 11.2.4.3. SWOT Analysis
- 11.2.4.4. Recent Developments
- 11.2.4.5. Financials (Based on Availability)
- 11.2.5 Duni AB
- 11.2.5.1. Overview
- 11.2.5.2. Products
- 11.2.5.3. SWOT Analysis
- 11.2.5.4. Recent Developments
- 11.2.5.5. Financials (Based on Availability)
- 11.2.6 Pactiv LLC
- 11.2.6.1. Overview
- 11.2.6.2. Products
- 11.2.6.3. SWOT Analysis
- 11.2.6.4. Recent Developments
- 11.2.6.5. Financials (Based on Availability)
- 11.2.7 Genpak LLC
- 11.2.7.1. Overview
- 11.2.7.2. Products
- 11.2.7.3. SWOT Analysis
- 11.2.7.4. Recent Developments
- 11.2.7.5. Financials (Based on Availability)
- 11.2.8 Lollicup USA Inc.
- 11.2.8.1. Overview
- 11.2.8.2. Products
- 11.2.8.3. SWOT Analysis
- 11.2.8.4. Recent Developments
- 11.2.8.5. Financials (Based on Availability)
- 11.2.9 Polar Plastic Ltd.
- 11.2.9.1. Overview
- 11.2.9.2. Products
- 11.2.9.3. SWOT Analysis
- 11.2.9.4. Recent Developments
- 11.2.9.5. Financials (Based on Availability)
- 11.2.10 Go-pak UK Ltd.
- 11.2.10.1. Overview
- 11.2.10.2. Products
- 11.2.10.3. SWOT Analysis
- 11.2.10.4. Recent Developments
- 11.2.10.5. Financials (Based on Availability)
- 11.2.1 Dart Container Corporation
List of Figures
- Figure 1: Global Plastic Paper Plate Revenue Breakdown (undefined, %) by Region 2025 & 2033
- Figure 2: North America Plastic Paper Plate Revenue (undefined), by Type 2025 & 2033
- Figure 3: North America Plastic Paper Plate Revenue Share (%), by Type 2025 & 2033
- Figure 4: North America Plastic Paper Plate Revenue (undefined), by Application 2025 & 2033
- Figure 5: North America Plastic Paper Plate Revenue Share (%), by Application 2025 & 2033
- Figure 6: North America Plastic Paper Plate Revenue (undefined), by Country 2025 & 2033
- Figure 7: North America Plastic Paper Plate Revenue Share (%), by Country 2025 & 2033
- Figure 8: South America Plastic Paper Plate Revenue (undefined), by Type 2025 & 2033
- Figure 9: South America Plastic Paper Plate Revenue Share (%), by Type 2025 & 2033
- Figure 10: South America Plastic Paper Plate Revenue (undefined), by Application 2025 & 2033
- Figure 11: South America Plastic Paper Plate Revenue Share (%), by Application 2025 & 2033
- Figure 12: South America Plastic Paper Plate Revenue (undefined), by Country 2025 & 2033
- Figure 13: South America Plastic Paper Plate Revenue Share (%), by Country 2025 & 2033
- Figure 14: Europe Plastic Paper Plate Revenue (undefined), by Type 2025 & 2033
- Figure 15: Europe Plastic Paper Plate Revenue Share (%), by Type 2025 & 2033
- Figure 16: Europe Plastic Paper Plate Revenue (undefined), by Application 2025 & 2033
- Figure 17: Europe Plastic Paper Plate Revenue Share (%), by Application 2025 & 2033
- Figure 18: Europe Plastic Paper Plate Revenue (undefined), by Country 2025 & 2033
- Figure 19: Europe Plastic Paper Plate Revenue Share (%), by Country 2025 & 2033
- Figure 20: Middle East & Africa Plastic Paper Plate Revenue (undefined), by Type 2025 & 2033
- Figure 21: Middle East & Africa Plastic Paper Plate Revenue Share (%), by Type 2025 & 2033
- Figure 22: Middle East & Africa Plastic Paper Plate Revenue (undefined), by Application 2025 & 2033
- Figure 23: Middle East & Africa Plastic Paper Plate Revenue Share (%), by Application 2025 & 2033
- Figure 24: Middle East & Africa Plastic Paper Plate Revenue (undefined), by Country 2025 & 2033
- Figure 25: Middle East & Africa Plastic Paper Plate Revenue Share (%), by Country 2025 & 2033
- Figure 26: Asia Pacific Plastic Paper Plate Revenue (undefined), by Type 2025 & 2033
- Figure 27: Asia Pacific Plastic Paper Plate Revenue Share (%), by Type 2025 & 2033
- Figure 28: Asia Pacific Plastic Paper Plate Revenue (undefined), by Application 2025 & 2033
- Figure 29: Asia Pacific Plastic Paper Plate Revenue Share (%), by Application 2025 & 2033
- Figure 30: Asia Pacific Plastic Paper Plate Revenue (undefined), by Country 2025 & 2033
- Figure 31: Asia Pacific Plastic Paper Plate Revenue Share (%), by Country 2025 & 2033
List of Tables
- Table 1: Global Plastic Paper Plate Revenue undefined Forecast, by Type 2020 & 2033
- Table 2: Global Plastic Paper Plate Revenue undefined Forecast, by Application 2020 & 2033
- Table 3: Global Plastic Paper Plate Revenue undefined Forecast, by Region 2020 & 2033
- Table 4: Global Plastic Paper Plate Revenue undefined Forecast, by Type 2020 & 2033
- Table 5: Global Plastic Paper Plate Revenue undefined Forecast, by Application 2020 & 2033
- Table 6: Global Plastic Paper Plate Revenue undefined Forecast, by Country 2020 & 2033
- Table 7: United States Plastic Paper Plate Revenue (undefined) Forecast, by Application 2020 & 2033
- Table 8: Canada Plastic Paper Plate Revenue (undefined) Forecast, by Application 2020 & 2033
- Table 9: Mexico Plastic Paper Plate Revenue (undefined) Forecast, by Application 2020 & 2033
- Table 10: Global Plastic Paper Plate Revenue undefined Forecast, by Type 2020 & 2033
- Table 11: Global Plastic Paper Plate Revenue undefined Forecast, by Application 2020 & 2033
- Table 12: Global Plastic Paper Plate Revenue undefined Forecast, by Country 2020 & 2033
- Table 13: Brazil Plastic Paper Plate Revenue (undefined) Forecast, by Application 2020 & 2033
- Table 14: Argentina Plastic Paper Plate Revenue (undefined) Forecast, by Application 2020 & 2033
- Table 15: Rest of South America Plastic Paper Plate Revenue (undefined) Forecast, by Application 2020 & 2033
- Table 16: Global Plastic Paper Plate Revenue undefined Forecast, by Type 2020 & 2033
- Table 17: Global Plastic Paper Plate Revenue undefined Forecast, by Application 2020 & 2033
- Table 18: Global Plastic Paper Plate Revenue undefined Forecast, by Country 2020 & 2033
- Table 19: United Kingdom Plastic Paper Plate Revenue (undefined) Forecast, by Application 2020 & 2033
- Table 20: Germany Plastic Paper Plate Revenue (undefined) Forecast, by Application 2020 & 2033
- Table 21: France Plastic Paper Plate Revenue (undefined) Forecast, by Application 2020 & 2033
- Table 22: Italy Plastic Paper Plate Revenue (undefined) Forecast, by Application 2020 & 2033
- Table 23: Spain Plastic Paper Plate Revenue (undefined) Forecast, by Application 2020 & 2033
- Table 24: Russia Plastic Paper Plate Revenue (undefined) Forecast, by Application 2020 & 2033
- Table 25: Benelux Plastic Paper Plate Revenue (undefined) Forecast, by Application 2020 & 2033
- Table 26: Nordics Plastic Paper Plate Revenue (undefined) Forecast, by Application 2020 & 2033
- Table 27: Rest of Europe Plastic Paper Plate Revenue (undefined) Forecast, by Application 2020 & 2033
- Table 28: Global Plastic Paper Plate Revenue undefined Forecast, by Type 2020 & 2033
- Table 29: Global Plastic Paper Plate Revenue undefined Forecast, by Application 2020 & 2033
- Table 30: Global Plastic Paper Plate Revenue undefined Forecast, by Country 2020 & 2033
- Table 31: Turkey Plastic Paper Plate Revenue (undefined) Forecast, by Application 2020 & 2033
- Table 32: Israel Plastic Paper Plate Revenue (undefined) Forecast, by Application 2020 & 2033
- Table 33: GCC Plastic Paper Plate Revenue (undefined) Forecast, by Application 2020 & 2033
- Table 34: North Africa Plastic Paper Plate Revenue (undefined) Forecast, by Application 2020 & 2033
- Table 35: South Africa Plastic Paper Plate Revenue (undefined) Forecast, by Application 2020 & 2033
- Table 36: Rest of Middle East & Africa Plastic Paper Plate Revenue (undefined) Forecast, by Application 2020 & 2033
- Table 37: Global Plastic Paper Plate Revenue undefined Forecast, by Type 2020 & 2033
- Table 38: Global Plastic Paper Plate Revenue undefined Forecast, by Application 2020 & 2033
- Table 39: Global Plastic Paper Plate Revenue undefined Forecast, by Country 2020 & 2033
- Table 40: China Plastic Paper Plate Revenue (undefined) Forecast, by Application 2020 & 2033
- Table 41: India Plastic Paper Plate Revenue (undefined) Forecast, by Application 2020 & 2033
- Table 42: Japan Plastic Paper Plate Revenue (undefined) Forecast, by Application 2020 & 2033
- Table 43: South Korea Plastic Paper Plate Revenue (undefined) Forecast, by Application 2020 & 2033
- Table 44: ASEAN Plastic Paper Plate Revenue (undefined) Forecast, by Application 2020 & 2033
- Table 45: Oceania Plastic Paper Plate Revenue (undefined) Forecast, by Application 2020 & 2033
- Table 46: Rest of Asia Pacific Plastic Paper Plate Revenue (undefined) Forecast, by Application 2020 & 2033
Frequently Asked Questions
1. What is the projected Compound Annual Growth Rate (CAGR) of the Plastic Paper Plate?
The projected CAGR is approximately 0.7%.
2. Which companies are prominent players in the Plastic Paper Plate?
Key companies in the market include Dart Container Corporation, Georgia Pacific LLC, Huhtamaki Oyj, International Paper Company, Duni AB, Pactiv LLC, Genpak LLC, Lollicup USA Inc., Polar Plastic Ltd., Go-pak UK Ltd..
3. What are the main segments of the Plastic Paper Plate?
The market segments include Type, Application.
4. Can you provide details about the market size?
The market size is estimated to be USD XXX N/A as of 2022.
5. What are some drivers contributing to market growth?
N/A
6. What are the notable trends driving market growth?
N/A
7. Are there any restraints impacting market growth?
N/A
8. Can you provide examples of recent developments in the market?
N/A
9. What pricing options are available for accessing the report?
Pricing options include single-user, multi-user, and enterprise licenses priced at USD 4900.00, USD 7350.00, and USD 9800.00 respectively.
10. Is the market size provided in terms of value or volume?
The market size is provided in terms of value, measured in N/A.
11. Are there any specific market keywords associated with the report?
Yes, the market keyword associated with the report is "Plastic Paper Plate," which aids in identifying and referencing the specific market segment covered.
12. How do I determine which pricing option suits my needs best?
The pricing options vary based on user requirements and access needs. Individual users may opt for single-user licenses, while businesses requiring broader access may choose multi-user or enterprise licenses for cost-effective access to the report.
13. Are there any additional resources or data provided in the Plastic Paper Plate report?
While the report offers comprehensive insights, it's advisable to review the specific contents or supplementary materials provided to ascertain if additional resources or data are available.
14. How can I stay updated on further developments or reports in the Plastic Paper Plate?
To stay informed about further developments, trends, and reports in the Plastic Paper Plate, consider subscribing to industry newsletters, following relevant companies and organizations, or regularly checking reputable industry news sources and publications.
Methodology
Step 1 - Identification of Relevant Samples Size from Population Database


Step 2 - Approaches for Defining Global Market Size (Value, Volume* & Price*)

Note*: In applicable scenarios
Step 3 - Data Sources
Primary Research
- Web Analytics
- Survey Reports
- Research Institute
- Latest Research Reports
- Opinion Leaders
Secondary Research
- Annual Reports
- White Paper
- Latest Press Release
- Industry Association
- Paid Database
- Investor Presentations

Step 4 - Data Triangulation
Involves using different sources of information in order to increase the validity of a study
These sources are likely to be stakeholders in a program - participants, other researchers, program staff, other community members, and so on.
Then we put all data in single framework & apply various statistical tools to find out the dynamic on the market.
During the analysis stage, feedback from the stakeholder groups would be compared to determine areas of agreement as well as areas of divergence