

Key Insights
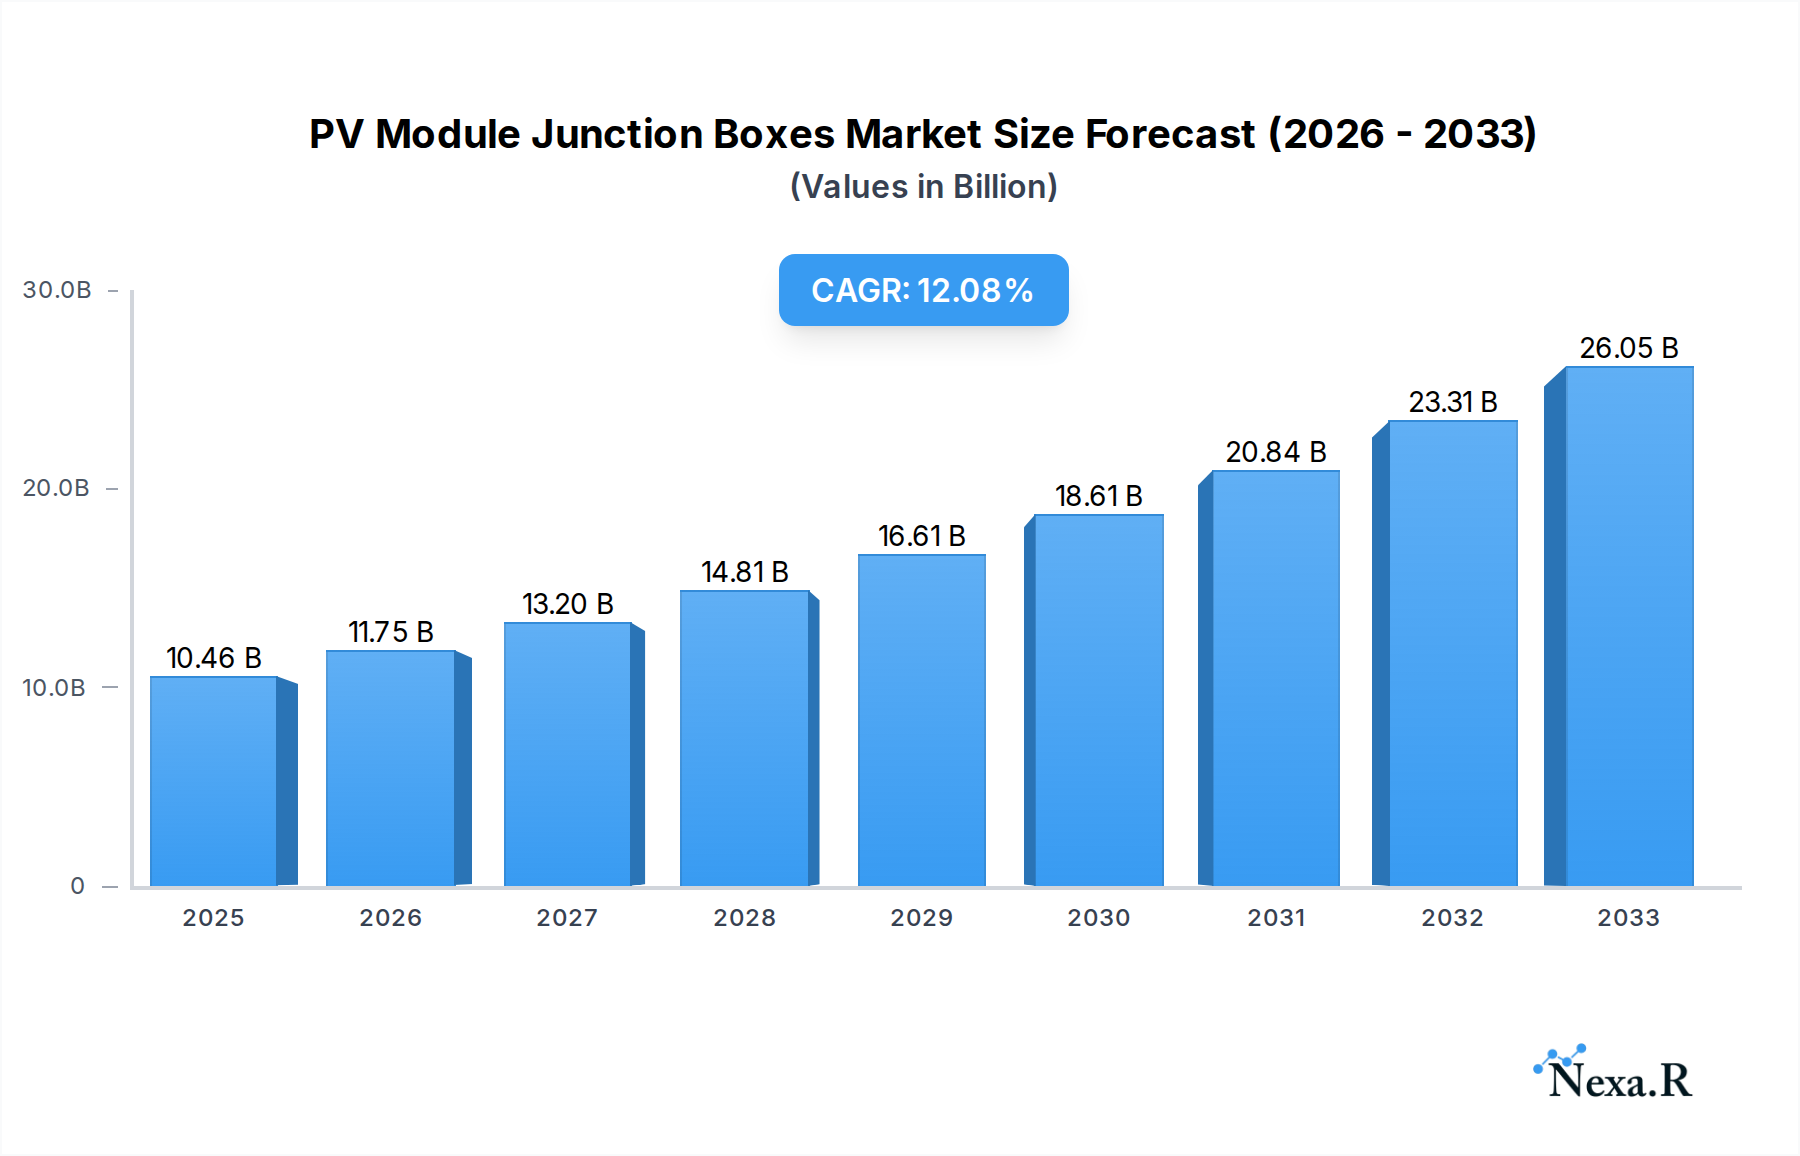
The global market for PV Module Junction Boxes is experiencing robust growth, projected to reach an estimated $10.46 billion in 2025. This expansion is driven by the accelerating adoption of solar energy worldwide, fueled by increasing government incentives, favorable policies, and a growing awareness of the environmental benefits of renewable energy. The CAGR of 12.15% underscores the significant upward trajectory of this market. Key drivers include the rising demand for energy-efficient and reliable photovoltaic systems, crucial for the optimal performance and longevity of solar panels. The market is broadly segmented by application into Residential, Commercial, and Industrial sectors, with the Residential segment showing strong uptake due to decentralized energy generation trends. By type, Crystalline Silicon Junction Boxes dominate, owing to their widespread use in mainstream solar panel manufacturing, while Amorphous Silicon Junction Boxes cater to niche applications. Major players like TE Connectivity, Stäubli Electrical Connectors, and DuPont are actively innovating and expanding their product portfolios to meet the evolving demands of this dynamic market.

PV Module Junction Boxes Market Size (In Billion)
Looking ahead, the forecast period from 2025 to 2033 anticipates continued strong performance for the PV Module Junction Box market. Emerging trends such as the development of smart junction boxes with advanced monitoring and diagnostic capabilities, and the increasing integration of junction boxes into building-integrated photovoltaics (BIPV) systems, are expected to further stimulate market expansion. Despite the overarching positive outlook, the market may face moderate restraints, including fluctuating raw material prices and intense competition among manufacturers, which could impact profit margins. However, the persistent global push towards decarbonization and the continuous decline in solar energy costs are powerful counterbalances. The Asia Pacific region, particularly China and India, is anticipated to remain the largest and fastest-growing market, driven by substantial solar power installations and supportive manufacturing ecosystems. North America and Europe also represent significant markets with ongoing investments in renewable energy infrastructure.
PV Module Junction Boxes Company Market Share
This in-depth report provides a critical analysis of the global PV Module Junction Boxes market, meticulously examining its dynamics, growth trajectories, and future outlook. Leveraging extensive research covering the historical period (2019-2024), base year (2025), and forecast period (2025-2033), this report offers actionable insights for industry stakeholders. It delves into market segmentation by application (Residential, Commercial, Industrial) and type (Crystalline Silicon Junction Box, Amorphous Silicon Junction Box), providing a granular understanding of regional and global trends. The report is designed to be a definitive resource for manufacturers, suppliers, investors, and policymakers seeking to navigate the evolving landscape of solar energy component manufacturing.
PV Module Junction Boxes Market Dynamics & Structure
The global PV module junction box market exhibits a moderate to high concentration, driven by the dominance of a few key players. Technological innovation remains a primary driver, with advancements in materials, sealing technologies, and integrated bypass diodes enhancing efficiency, durability, and safety. Regulatory frameworks, particularly those pertaining to renewable energy mandates and electrical safety standards (e.g., IEC, UL certifications), are shaping product development and market entry. Competitive product substitutes, though limited, include direct wiring solutions in certain niche applications. End-user demographics are shifting towards greater demand for highly reliable and long-lasting solutions, influenced by decreasing solar LCOE and increasing adoption in diverse climates. Mergers and acquisitions (M&A) trends indicate a strategic consolidation aimed at expanding product portfolios, geographic reach, and technological capabilities.
- Market Concentration: Dominated by a mix of established global players and emerging regional manufacturers.
- Technological Innovation Drivers: Focus on improved IP ratings, higher voltage tolerance, reduced thermal stress, and integration of smart functionalities.
- Regulatory Frameworks: Strict adherence to international safety standards and certifications is paramount for market access.
- Competitive Product Substitutes: Limited but present in off-grid or highly specialized systems.
- End-User Demographics: Growing demand from utility-scale projects and residential prosumers emphasizing reliability and performance warranties.
- M&A Trends: Strategic acquisitions by larger entities to gain market share and technological expertise, with an estimated volume of 5-8 significant deals annually within the study period.
PV Module Junction Boxes Growth Trends & Insights
The PV module junction boxes market is projected for substantial growth, fueled by the accelerating global transition towards renewable energy sources. The estimated market size for junction boxes in 2025 is projected to reach approximately $2.5 billion, with an anticipated Compound Annual Growth Rate (CAGR) of around 7.5% during the forecast period (2025-2033). This robust expansion is underpinned by increasing solar PV installations across residential, commercial, and industrial sectors, driven by supportive government policies, declining solar component costs, and rising environmental consciousness. Technological disruptions, such as the development of higher efficiency solar cells and bifacial modules, necessitate enhanced junction box designs to manage increased power outputs and operational stresses. Consumer behavior is increasingly favoring integrated solutions offering greater reliability, extended lifespan, and simplified installation, thereby driving innovation in junction box features like enhanced surge protection and rapid shutdown capabilities. The market penetration of advanced junction box technologies is expected to rise significantly as manufacturers focus on premium, high-performance products to cater to the evolving demands of the solar industry.
Dominant Regions, Countries, or Segments in PV Module Junction Boxes
The Commercial application segment is identified as a dominant growth driver for the PV module junction box market. This segment's expansion is propelled by substantial investments in solar power for commercial buildings, including retail spaces, manufacturing facilities, and office complexes, driven by the need for cost savings, energy independence, and corporate sustainability goals. Furthermore, countries within the Asia-Pacific region, particularly China, continue to lead in manufacturing and deployment, significantly influencing global market dynamics. Key drivers in this region include strong government support for solar energy, extensive manufacturing infrastructure, and a rapidly growing demand for electricity.
- Dominant Application Segment: Commercial - driven by large-scale solar installations for businesses seeking to reduce operational costs and meet ESG targets.
- Leading Region: Asia-Pacific - due to extensive manufacturing capabilities, supportive government policies, and high solar deployment rates.
- Key Drivers in Asia-Pacific:
- Aggressive renewable energy targets and subsidies.
- Low-cost manufacturing ecosystem for solar components.
- Rapid industrialization and increasing energy demand.
- Growing awareness of climate change and the need for sustainable energy.
- Market Share & Growth Potential: The Commercial segment is expected to account for approximately 45% of the total market share in 2025, with a projected CAGR of 8.0% during the forecast period. Asia-Pacific's market share is estimated to be over 60% in 2025, showcasing its continued influence.
PV Module Junction Boxes Product Landscape
The PV module junction box product landscape is characterized by continuous innovation focused on enhancing performance, reliability, and safety. Key advancements include the development of junction boxes with improved ingress protection (IP) ratings, offering superior resistance to dust and water, critical for long-term outdoor performance. Materials science plays a crucial role, with the adoption of high-temperature resistant and UV-stable plastics to ensure longevity in harsh environmental conditions. Furthermore, the integration of advanced bypass diodes is becoming standard, mitigating the impact of shading and hot spots, thereby maximizing energy yield and preventing module damage. The emergence of smart junction boxes with integrated monitoring and communication capabilities is also a significant trend, enabling remote diagnostics and performance optimization.
Key Drivers, Barriers & Challenges in PV Module Junction Boxes
Key Drivers:
- Growing Global Solar PV Installations: The exponential increase in solar energy adoption worldwide is the primary growth driver.
- Technological Advancements: Continuous innovation in materials, design, and integrated functionalities enhances efficiency and durability.
- Supportive Government Policies & Incentives: Favorable regulations and financial incentives for renewable energy projects globally.
- Declining Solar Component Costs: Making solar energy more accessible and economically viable across all sectors.
Barriers & Challenges:
- Supply Chain Volatility: Fluctuations in raw material prices and availability can impact production costs and lead times.
- Intense Competition & Price Pressure: A highly competitive market can lead to price erosion, affecting profit margins for manufacturers.
- Stringent Quality & Certification Requirements: Meeting diverse international safety and performance standards can be complex and costly.
- Technological Obsolescence: Rapid advancements necessitate continuous investment in R&D to stay competitive.
- Counterfeit Products: The presence of substandard and counterfeit junction boxes can damage market reputation and compromise system safety, with an estimated impact on market value of around 3-5%.
Emerging Opportunities in PV Module Junction Boxes
Emerging opportunities in the PV module junction box market lie in the development of highly integrated, smart junction boxes capable of advanced monitoring, predictive maintenance, and grid synchronization. The growing demand for customized solutions for diverse PV applications, including floating solar farms and building-integrated photovoltaics (BIPV), presents significant untapped potential. Furthermore, the increasing focus on circular economy principles and sustainable manufacturing practices offers opportunities for companies developing eco-friendly and recyclable junction box materials. The expansion of solar energy into emerging economies with less developed infrastructure also presents a substantial opportunity for manufacturers offering robust and easily deployable solutions.
Growth Accelerators in the PV Module Junction Boxes Industry
The PV module junction box industry is experiencing significant growth acceleration driven by several key catalysts. Technological breakthroughs in polymer science and encapsulation techniques are leading to more durable and weather-resistant junction boxes, extending module lifespans and reducing long-term maintenance costs. Strategic partnerships between junction box manufacturers and leading solar module producers are fostering co-development and optimization, ensuring seamless integration and enhanced performance. Market expansion strategies, particularly targeting utility-scale projects and emerging renewable energy markets, are further fueling demand. The increasing adoption of bifacial solar modules, which require junction boxes capable of handling higher power outputs and bidirectional current flow, is another critical growth accelerator.
Key Players Shaping the PV Module Junction Boxes Market
- TE Connectivity
- Stäubli Electrical Connectors
- Targray
- Geesys Technologies
- DuPont
- LEONI Studer AG
- Renhe Solar (Zhejiang Renhe Photovoltaic Technology Co.,Ltd.)
- Amphenol Industrial Products
- Ningbo GZX PV Technology CO.,LTD.
- Sunter
- Yitong Solar
- Ningbo ChuangYuan PV Technology Co.,Ltd
- QC Solar (Suzhou) Corporation
- Linyang Renewable
- LEATEC Fine Ceramics
- Jiangsu Tonglin Electric Co.,Ltd.
Notable Milestones in PV Module Junction Boxes Sector
- 2019/08: Launch of new series of high-voltage tolerant junction boxes designed for emerging large-format solar modules.
- 2020/03: Strategic acquisition of a specialized connector manufacturer by a leading junction box supplier to expand product offerings.
- 2021/01: Introduction of advanced bypass diode technology with improved thermal management capabilities.
- 2022/06: Significant investment in automated manufacturing processes to enhance production efficiency and product consistency.
- 2023/04: Development of a novel, fully-recyclable junction box material as part of sustainability initiatives.
- 2024/02: Partnership announced for the integration of IoT sensors within junction boxes for enhanced module monitoring.
In-Depth PV Module Junction Boxes Market Outlook
The future outlook for the PV module junction box market is exceptionally positive, driven by the accelerating global shift towards renewable energy and continuous technological advancements. Growth accelerators, including enhanced product reliability, smart functionalities, and sustainable material innovations, are poised to shape the market trajectory. Strategic partnerships and market expansion into emerging geographies will be crucial for sustained growth. The market is expected to witness further consolidation and specialization, with a growing emphasis on high-performance, cost-effective, and environmentally conscious solutions. The overall market potential remains robust, with significant opportunities for innovation and market leadership.
PV Module Junction Boxes Segmentation
-
1. Application
- 1.1. Residential
- 1.2. Commercial
- 1.3. Industrial
-
2. Types
- 2.1. Crystalline Silicon Junction Box
- 2.2. Amorphous Silicon Junction Box
PV Module Junction Boxes Segmentation By Geography
-
1. North America
- 1.1. United States
- 1.2. Canada
- 1.3. Mexico
-
2. South America
- 2.1. Brazil
- 2.2. Argentina
- 2.3. Rest of South America
-
3. Europe
- 3.1. United Kingdom
- 3.2. Germany
- 3.3. France
- 3.4. Italy
- 3.5. Spain
- 3.6. Russia
- 3.7. Benelux
- 3.8. Nordics
- 3.9. Rest of Europe
-
4. Middle East & Africa
- 4.1. Turkey
- 4.2. Israel
- 4.3. GCC
- 4.4. North Africa
- 4.5. South Africa
- 4.6. Rest of Middle East & Africa
-
5. Asia Pacific
- 5.1. China
- 5.2. India
- 5.3. Japan
- 5.4. South Korea
- 5.5. ASEAN
- 5.6. Oceania
- 5.7. Rest of Asia Pacific
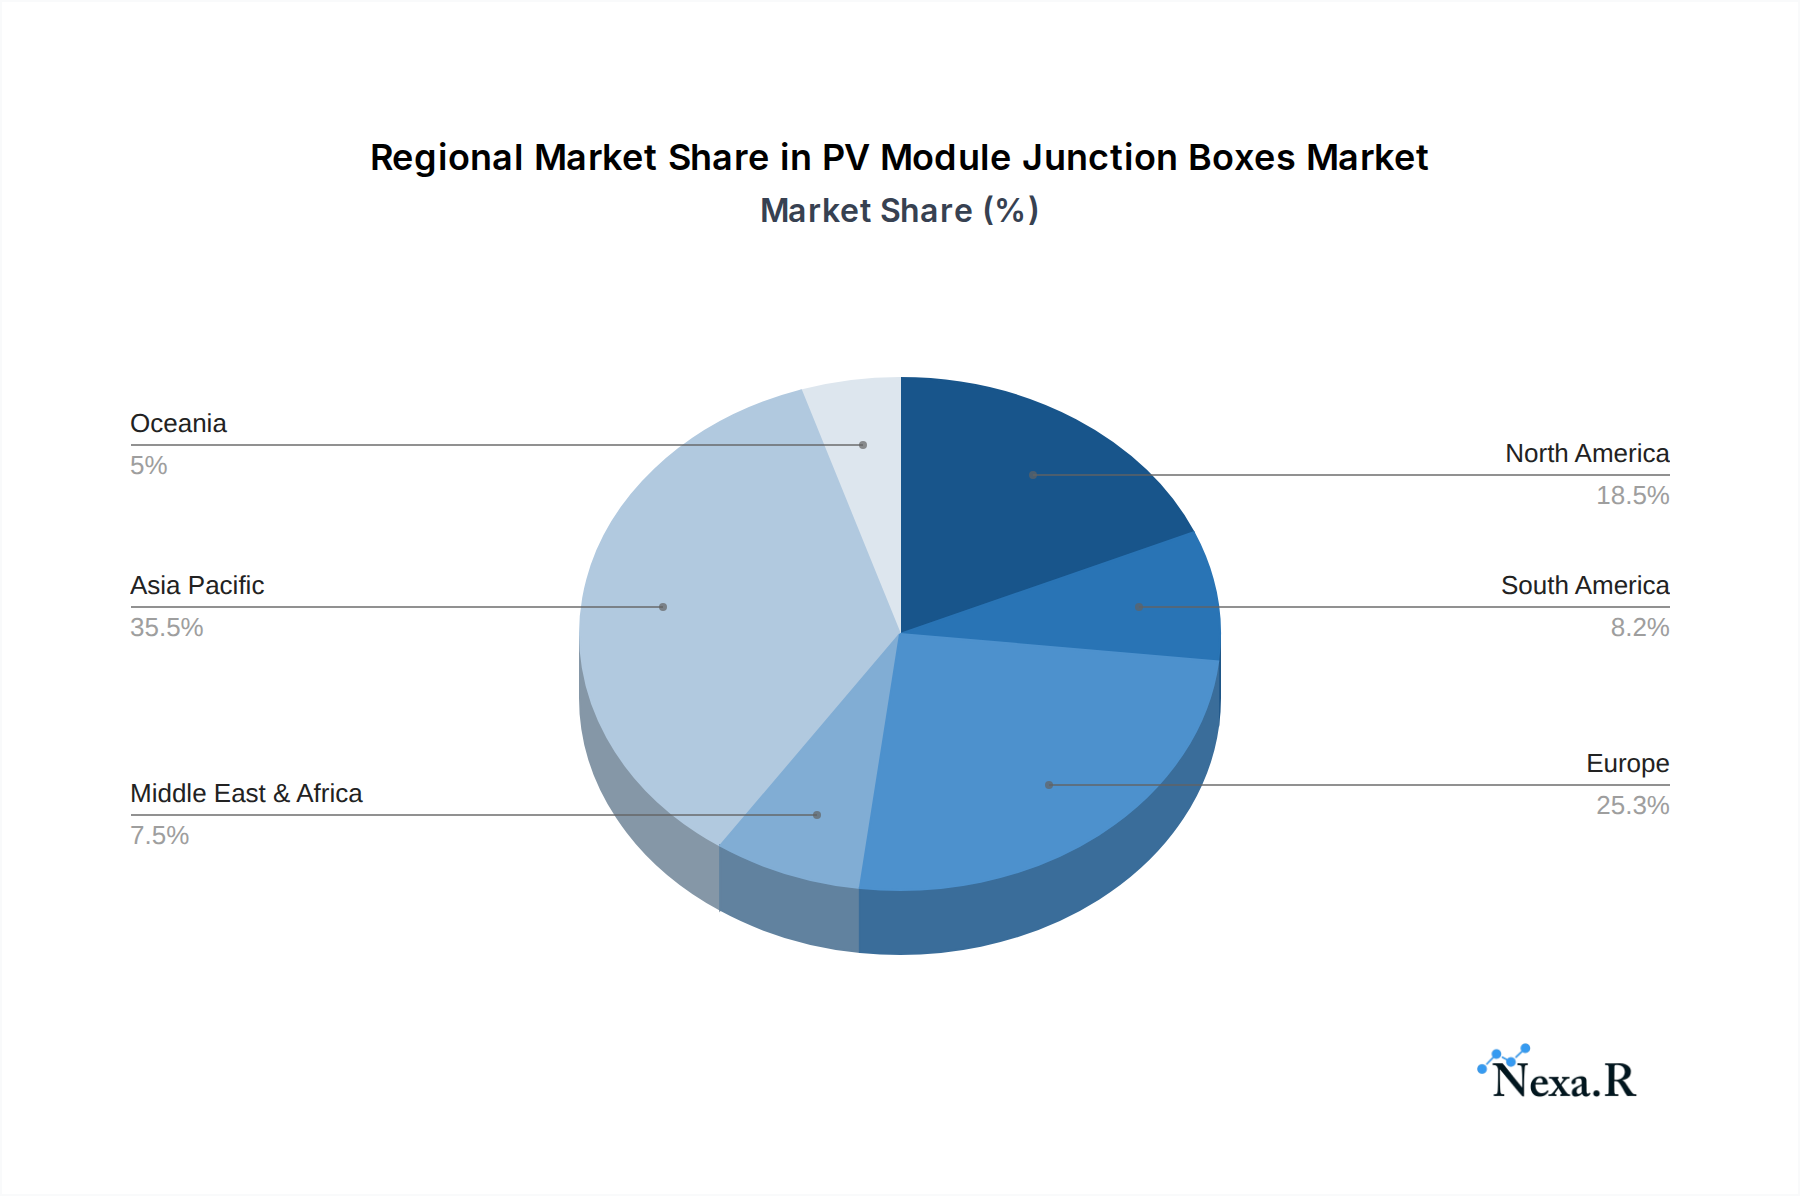
PV Module Junction Boxes Regional Market Share
Geographic Coverage of PV Module Junction Boxes
PV Module Junction Boxes REPORT HIGHLIGHTS
| Aspects | Details |
|---|---|
| Study Period | 2020-2034 |
| Base Year | 2025 |
| Estimated Year | 2026 |
| Forecast Period | 2026-2034 |
| Historical Period | 2020-2025 |
| Growth Rate | CAGR of 12.15% from 2020-2034 |
| Segmentation |
|
Table of Contents
- 1. Introduction
- 1.1. Research Scope
- 1.2. Market Segmentation
- 1.3. Research Methodology
- 1.4. Definitions and Assumptions
- 2. Executive Summary
- 2.1. Introduction
- 3. Market Dynamics
- 3.1. Introduction
- 3.2. Market Drivers
- 3.3. Market Restrains
- 3.4. Market Trends
- 4. Market Factor Analysis
- 4.1. Porters Five Forces
- 4.2. Supply/Value Chain
- 4.3. PESTEL analysis
- 4.4. Market Entropy
- 4.5. Patent/Trademark Analysis
- 5. Global PV Module Junction Boxes Analysis, Insights and Forecast, 2020-2032
- 5.1. Market Analysis, Insights and Forecast - by Application
- 5.1.1. Residential
- 5.1.2. Commercial
- 5.1.3. Industrial
- 5.2. Market Analysis, Insights and Forecast - by Types
- 5.2.1. Crystalline Silicon Junction Box
- 5.2.2. Amorphous Silicon Junction Box
- 5.3. Market Analysis, Insights and Forecast - by Region
- 5.3.1. North America
- 5.3.2. South America
- 5.3.3. Europe
- 5.3.4. Middle East & Africa
- 5.3.5. Asia Pacific
- 5.1. Market Analysis, Insights and Forecast - by Application
- 6. North America PV Module Junction Boxes Analysis, Insights and Forecast, 2020-2032
- 6.1. Market Analysis, Insights and Forecast - by Application
- 6.1.1. Residential
- 6.1.2. Commercial
- 6.1.3. Industrial
- 6.2. Market Analysis, Insights and Forecast - by Types
- 6.2.1. Crystalline Silicon Junction Box
- 6.2.2. Amorphous Silicon Junction Box
- 6.1. Market Analysis, Insights and Forecast - by Application
- 7. South America PV Module Junction Boxes Analysis, Insights and Forecast, 2020-2032
- 7.1. Market Analysis, Insights and Forecast - by Application
- 7.1.1. Residential
- 7.1.2. Commercial
- 7.1.3. Industrial
- 7.2. Market Analysis, Insights and Forecast - by Types
- 7.2.1. Crystalline Silicon Junction Box
- 7.2.2. Amorphous Silicon Junction Box
- 7.1. Market Analysis, Insights and Forecast - by Application
- 8. Europe PV Module Junction Boxes Analysis, Insights and Forecast, 2020-2032
- 8.1. Market Analysis, Insights and Forecast - by Application
- 8.1.1. Residential
- 8.1.2. Commercial
- 8.1.3. Industrial
- 8.2. Market Analysis, Insights and Forecast - by Types
- 8.2.1. Crystalline Silicon Junction Box
- 8.2.2. Amorphous Silicon Junction Box
- 8.1. Market Analysis, Insights and Forecast - by Application
- 9. Middle East & Africa PV Module Junction Boxes Analysis, Insights and Forecast, 2020-2032
- 9.1. Market Analysis, Insights and Forecast - by Application
- 9.1.1. Residential
- 9.1.2. Commercial
- 9.1.3. Industrial
- 9.2. Market Analysis, Insights and Forecast - by Types
- 9.2.1. Crystalline Silicon Junction Box
- 9.2.2. Amorphous Silicon Junction Box
- 9.1. Market Analysis, Insights and Forecast - by Application
- 10. Asia Pacific PV Module Junction Boxes Analysis, Insights and Forecast, 2020-2032
- 10.1. Market Analysis, Insights and Forecast - by Application
- 10.1.1. Residential
- 10.1.2. Commercial
- 10.1.3. Industrial
- 10.2. Market Analysis, Insights and Forecast - by Types
- 10.2.1. Crystalline Silicon Junction Box
- 10.2.2. Amorphous Silicon Junction Box
- 10.1. Market Analysis, Insights and Forecast - by Application
- 11. Competitive Analysis
- 11.1. Global Market Share Analysis 2025
- 11.2. Company Profiles
- 11.2.1 TE Connectivity
- 11.2.1.1. Overview
- 11.2.1.2. Products
- 11.2.1.3. SWOT Analysis
- 11.2.1.4. Recent Developments
- 11.2.1.5. Financials (Based on Availability)
- 11.2.2 Stäubli Electrical Connectors
- 11.2.2.1. Overview
- 11.2.2.2. Products
- 11.2.2.3. SWOT Analysis
- 11.2.2.4. Recent Developments
- 11.2.2.5. Financials (Based on Availability)
- 11.2.3 Targray
- 11.2.3.1. Overview
- 11.2.3.2. Products
- 11.2.3.3. SWOT Analysis
- 11.2.3.4. Recent Developments
- 11.2.3.5. Financials (Based on Availability)
- 11.2.4 Geesys Technologies
- 11.2.4.1. Overview
- 11.2.4.2. Products
- 11.2.4.3. SWOT Analysis
- 11.2.4.4. Recent Developments
- 11.2.4.5. Financials (Based on Availability)
- 11.2.5 DuPont
- 11.2.5.1. Overview
- 11.2.5.2. Products
- 11.2.5.3. SWOT Analysis
- 11.2.5.4. Recent Developments
- 11.2.5.5. Financials (Based on Availability)
- 11.2.6 LEONI Studer AG
- 11.2.6.1. Overview
- 11.2.6.2. Products
- 11.2.6.3. SWOT Analysis
- 11.2.6.4. Recent Developments
- 11.2.6.5. Financials (Based on Availability)
- 11.2.7 Renhe Solar(Zhejiang Renhe Photovoltaic Technology Co.
- 11.2.7.1. Overview
- 11.2.7.2. Products
- 11.2.7.3. SWOT Analysis
- 11.2.7.4. Recent Developments
- 11.2.7.5. Financials (Based on Availability)
- 11.2.8 Ltd.)
- 11.2.8.1. Overview
- 11.2.8.2. Products
- 11.2.8.3. SWOT Analysis
- 11.2.8.4. Recent Developments
- 11.2.8.5. Financials (Based on Availability)
- 11.2.9 Amphenol Industrial Products
- 11.2.9.1. Overview
- 11.2.9.2. Products
- 11.2.9.3. SWOT Analysis
- 11.2.9.4. Recent Developments
- 11.2.9.5. Financials (Based on Availability)
- 11.2.10 Ningbo GZX PV Technology CO.
- 11.2.10.1. Overview
- 11.2.10.2. Products
- 11.2.10.3. SWOT Analysis
- 11.2.10.4. Recent Developments
- 11.2.10.5. Financials (Based on Availability)
- 11.2.11 LTD.
- 11.2.11.1. Overview
- 11.2.11.2. Products
- 11.2.11.3. SWOT Analysis
- 11.2.11.4. Recent Developments
- 11.2.11.5. Financials (Based on Availability)
- 11.2.12 Sunter
- 11.2.12.1. Overview
- 11.2.12.2. Products
- 11.2.12.3. SWOT Analysis
- 11.2.12.4. Recent Developments
- 11.2.12.5. Financials (Based on Availability)
- 11.2.13 Yitong Solar
- 11.2.13.1. Overview
- 11.2.13.2. Products
- 11.2.13.3. SWOT Analysis
- 11.2.13.4. Recent Developments
- 11.2.13.5. Financials (Based on Availability)
- 11.2.14 Ningbo ChuangYuan PV Technology Co.
- 11.2.14.1. Overview
- 11.2.14.2. Products
- 11.2.14.3. SWOT Analysis
- 11.2.14.4. Recent Developments
- 11.2.14.5. Financials (Based on Availability)
- 11.2.15 Ltd
- 11.2.15.1. Overview
- 11.2.15.2. Products
- 11.2.15.3. SWOT Analysis
- 11.2.15.4. Recent Developments
- 11.2.15.5. Financials (Based on Availability)
- 11.2.16 QC Solar (Suzhou) Corporation
- 11.2.16.1. Overview
- 11.2.16.2. Products
- 11.2.16.3. SWOT Analysis
- 11.2.16.4. Recent Developments
- 11.2.16.5. Financials (Based on Availability)
- 11.2.17 Linyang Renewable
- 11.2.17.1. Overview
- 11.2.17.2. Products
- 11.2.17.3. SWOT Analysis
- 11.2.17.4. Recent Developments
- 11.2.17.5. Financials (Based on Availability)
- 11.2.18 LEATEC Fine Ceramics
- 11.2.18.1. Overview
- 11.2.18.2. Products
- 11.2.18.3. SWOT Analysis
- 11.2.18.4. Recent Developments
- 11.2.18.5. Financials (Based on Availability)
- 11.2.19 Jiangsu Tonglin Electric Co.
- 11.2.19.1. Overview
- 11.2.19.2. Products
- 11.2.19.3. SWOT Analysis
- 11.2.19.4. Recent Developments
- 11.2.19.5. Financials (Based on Availability)
- 11.2.20 Ltd.
- 11.2.20.1. Overview
- 11.2.20.2. Products
- 11.2.20.3. SWOT Analysis
- 11.2.20.4. Recent Developments
- 11.2.20.5. Financials (Based on Availability)
- 11.2.1 TE Connectivity
List of Figures
- Figure 1: Global PV Module Junction Boxes Revenue Breakdown (billion, %) by Region 2025 & 2033
- Figure 2: Global PV Module Junction Boxes Volume Breakdown (K, %) by Region 2025 & 2033
- Figure 3: North America PV Module Junction Boxes Revenue (billion), by Application 2025 & 2033
- Figure 4: North America PV Module Junction Boxes Volume (K), by Application 2025 & 2033
- Figure 5: North America PV Module Junction Boxes Revenue Share (%), by Application 2025 & 2033
- Figure 6: North America PV Module Junction Boxes Volume Share (%), by Application 2025 & 2033
- Figure 7: North America PV Module Junction Boxes Revenue (billion), by Types 2025 & 2033
- Figure 8: North America PV Module Junction Boxes Volume (K), by Types 2025 & 2033
- Figure 9: North America PV Module Junction Boxes Revenue Share (%), by Types 2025 & 2033
- Figure 10: North America PV Module Junction Boxes Volume Share (%), by Types 2025 & 2033
- Figure 11: North America PV Module Junction Boxes Revenue (billion), by Country 2025 & 2033
- Figure 12: North America PV Module Junction Boxes Volume (K), by Country 2025 & 2033
- Figure 13: North America PV Module Junction Boxes Revenue Share (%), by Country 2025 & 2033
- Figure 14: North America PV Module Junction Boxes Volume Share (%), by Country 2025 & 2033
- Figure 15: South America PV Module Junction Boxes Revenue (billion), by Application 2025 & 2033
- Figure 16: South America PV Module Junction Boxes Volume (K), by Application 2025 & 2033
- Figure 17: South America PV Module Junction Boxes Revenue Share (%), by Application 2025 & 2033
- Figure 18: South America PV Module Junction Boxes Volume Share (%), by Application 2025 & 2033
- Figure 19: South America PV Module Junction Boxes Revenue (billion), by Types 2025 & 2033
- Figure 20: South America PV Module Junction Boxes Volume (K), by Types 2025 & 2033
- Figure 21: South America PV Module Junction Boxes Revenue Share (%), by Types 2025 & 2033
- Figure 22: South America PV Module Junction Boxes Volume Share (%), by Types 2025 & 2033
- Figure 23: South America PV Module Junction Boxes Revenue (billion), by Country 2025 & 2033
- Figure 24: South America PV Module Junction Boxes Volume (K), by Country 2025 & 2033
- Figure 25: South America PV Module Junction Boxes Revenue Share (%), by Country 2025 & 2033
- Figure 26: South America PV Module Junction Boxes Volume Share (%), by Country 2025 & 2033
- Figure 27: Europe PV Module Junction Boxes Revenue (billion), by Application 2025 & 2033
- Figure 28: Europe PV Module Junction Boxes Volume (K), by Application 2025 & 2033
- Figure 29: Europe PV Module Junction Boxes Revenue Share (%), by Application 2025 & 2033
- Figure 30: Europe PV Module Junction Boxes Volume Share (%), by Application 2025 & 2033
- Figure 31: Europe PV Module Junction Boxes Revenue (billion), by Types 2025 & 2033
- Figure 32: Europe PV Module Junction Boxes Volume (K), by Types 2025 & 2033
- Figure 33: Europe PV Module Junction Boxes Revenue Share (%), by Types 2025 & 2033
- Figure 34: Europe PV Module Junction Boxes Volume Share (%), by Types 2025 & 2033
- Figure 35: Europe PV Module Junction Boxes Revenue (billion), by Country 2025 & 2033
- Figure 36: Europe PV Module Junction Boxes Volume (K), by Country 2025 & 2033
- Figure 37: Europe PV Module Junction Boxes Revenue Share (%), by Country 2025 & 2033
- Figure 38: Europe PV Module Junction Boxes Volume Share (%), by Country 2025 & 2033
- Figure 39: Middle East & Africa PV Module Junction Boxes Revenue (billion), by Application 2025 & 2033
- Figure 40: Middle East & Africa PV Module Junction Boxes Volume (K), by Application 2025 & 2033
- Figure 41: Middle East & Africa PV Module Junction Boxes Revenue Share (%), by Application 2025 & 2033
- Figure 42: Middle East & Africa PV Module Junction Boxes Volume Share (%), by Application 2025 & 2033
- Figure 43: Middle East & Africa PV Module Junction Boxes Revenue (billion), by Types 2025 & 2033
- Figure 44: Middle East & Africa PV Module Junction Boxes Volume (K), by Types 2025 & 2033
- Figure 45: Middle East & Africa PV Module Junction Boxes Revenue Share (%), by Types 2025 & 2033
- Figure 46: Middle East & Africa PV Module Junction Boxes Volume Share (%), by Types 2025 & 2033
- Figure 47: Middle East & Africa PV Module Junction Boxes Revenue (billion), by Country 2025 & 2033
- Figure 48: Middle East & Africa PV Module Junction Boxes Volume (K), by Country 2025 & 2033
- Figure 49: Middle East & Africa PV Module Junction Boxes Revenue Share (%), by Country 2025 & 2033
- Figure 50: Middle East & Africa PV Module Junction Boxes Volume Share (%), by Country 2025 & 2033
- Figure 51: Asia Pacific PV Module Junction Boxes Revenue (billion), by Application 2025 & 2033
- Figure 52: Asia Pacific PV Module Junction Boxes Volume (K), by Application 2025 & 2033
- Figure 53: Asia Pacific PV Module Junction Boxes Revenue Share (%), by Application 2025 & 2033
- Figure 54: Asia Pacific PV Module Junction Boxes Volume Share (%), by Application 2025 & 2033
- Figure 55: Asia Pacific PV Module Junction Boxes Revenue (billion), by Types 2025 & 2033
- Figure 56: Asia Pacific PV Module Junction Boxes Volume (K), by Types 2025 & 2033
- Figure 57: Asia Pacific PV Module Junction Boxes Revenue Share (%), by Types 2025 & 2033
- Figure 58: Asia Pacific PV Module Junction Boxes Volume Share (%), by Types 2025 & 2033
- Figure 59: Asia Pacific PV Module Junction Boxes Revenue (billion), by Country 2025 & 2033
- Figure 60: Asia Pacific PV Module Junction Boxes Volume (K), by Country 2025 & 2033
- Figure 61: Asia Pacific PV Module Junction Boxes Revenue Share (%), by Country 2025 & 2033
- Figure 62: Asia Pacific PV Module Junction Boxes Volume Share (%), by Country 2025 & 2033
List of Tables
- Table 1: Global PV Module Junction Boxes Revenue billion Forecast, by Application 2020 & 2033
- Table 2: Global PV Module Junction Boxes Volume K Forecast, by Application 2020 & 2033
- Table 3: Global PV Module Junction Boxes Revenue billion Forecast, by Types 2020 & 2033
- Table 4: Global PV Module Junction Boxes Volume K Forecast, by Types 2020 & 2033
- Table 5: Global PV Module Junction Boxes Revenue billion Forecast, by Region 2020 & 2033
- Table 6: Global PV Module Junction Boxes Volume K Forecast, by Region 2020 & 2033
- Table 7: Global PV Module Junction Boxes Revenue billion Forecast, by Application 2020 & 2033
- Table 8: Global PV Module Junction Boxes Volume K Forecast, by Application 2020 & 2033
- Table 9: Global PV Module Junction Boxes Revenue billion Forecast, by Types 2020 & 2033
- Table 10: Global PV Module Junction Boxes Volume K Forecast, by Types 2020 & 2033
- Table 11: Global PV Module Junction Boxes Revenue billion Forecast, by Country 2020 & 2033
- Table 12: Global PV Module Junction Boxes Volume K Forecast, by Country 2020 & 2033
- Table 13: United States PV Module Junction Boxes Revenue (billion) Forecast, by Application 2020 & 2033
- Table 14: United States PV Module Junction Boxes Volume (K) Forecast, by Application 2020 & 2033
- Table 15: Canada PV Module Junction Boxes Revenue (billion) Forecast, by Application 2020 & 2033
- Table 16: Canada PV Module Junction Boxes Volume (K) Forecast, by Application 2020 & 2033
- Table 17: Mexico PV Module Junction Boxes Revenue (billion) Forecast, by Application 2020 & 2033
- Table 18: Mexico PV Module Junction Boxes Volume (K) Forecast, by Application 2020 & 2033
- Table 19: Global PV Module Junction Boxes Revenue billion Forecast, by Application 2020 & 2033
- Table 20: Global PV Module Junction Boxes Volume K Forecast, by Application 2020 & 2033
- Table 21: Global PV Module Junction Boxes Revenue billion Forecast, by Types 2020 & 2033
- Table 22: Global PV Module Junction Boxes Volume K Forecast, by Types 2020 & 2033
- Table 23: Global PV Module Junction Boxes Revenue billion Forecast, by Country 2020 & 2033
- Table 24: Global PV Module Junction Boxes Volume K Forecast, by Country 2020 & 2033
- Table 25: Brazil PV Module Junction Boxes Revenue (billion) Forecast, by Application 2020 & 2033
- Table 26: Brazil PV Module Junction Boxes Volume (K) Forecast, by Application 2020 & 2033
- Table 27: Argentina PV Module Junction Boxes Revenue (billion) Forecast, by Application 2020 & 2033
- Table 28: Argentina PV Module Junction Boxes Volume (K) Forecast, by Application 2020 & 2033
- Table 29: Rest of South America PV Module Junction Boxes Revenue (billion) Forecast, by Application 2020 & 2033
- Table 30: Rest of South America PV Module Junction Boxes Volume (K) Forecast, by Application 2020 & 2033
- Table 31: Global PV Module Junction Boxes Revenue billion Forecast, by Application 2020 & 2033
- Table 32: Global PV Module Junction Boxes Volume K Forecast, by Application 2020 & 2033
- Table 33: Global PV Module Junction Boxes Revenue billion Forecast, by Types 2020 & 2033
- Table 34: Global PV Module Junction Boxes Volume K Forecast, by Types 2020 & 2033
- Table 35: Global PV Module Junction Boxes Revenue billion Forecast, by Country 2020 & 2033
- Table 36: Global PV Module Junction Boxes Volume K Forecast, by Country 2020 & 2033
- Table 37: United Kingdom PV Module Junction Boxes Revenue (billion) Forecast, by Application 2020 & 2033
- Table 38: United Kingdom PV Module Junction Boxes Volume (K) Forecast, by Application 2020 & 2033
- Table 39: Germany PV Module Junction Boxes Revenue (billion) Forecast, by Application 2020 & 2033
- Table 40: Germany PV Module Junction Boxes Volume (K) Forecast, by Application 2020 & 2033
- Table 41: France PV Module Junction Boxes Revenue (billion) Forecast, by Application 2020 & 2033
- Table 42: France PV Module Junction Boxes Volume (K) Forecast, by Application 2020 & 2033
- Table 43: Italy PV Module Junction Boxes Revenue (billion) Forecast, by Application 2020 & 2033
- Table 44: Italy PV Module Junction Boxes Volume (K) Forecast, by Application 2020 & 2033
- Table 45: Spain PV Module Junction Boxes Revenue (billion) Forecast, by Application 2020 & 2033
- Table 46: Spain PV Module Junction Boxes Volume (K) Forecast, by Application 2020 & 2033
- Table 47: Russia PV Module Junction Boxes Revenue (billion) Forecast, by Application 2020 & 2033
- Table 48: Russia PV Module Junction Boxes Volume (K) Forecast, by Application 2020 & 2033
- Table 49: Benelux PV Module Junction Boxes Revenue (billion) Forecast, by Application 2020 & 2033
- Table 50: Benelux PV Module Junction Boxes Volume (K) Forecast, by Application 2020 & 2033
- Table 51: Nordics PV Module Junction Boxes Revenue (billion) Forecast, by Application 2020 & 2033
- Table 52: Nordics PV Module Junction Boxes Volume (K) Forecast, by Application 2020 & 2033
- Table 53: Rest of Europe PV Module Junction Boxes Revenue (billion) Forecast, by Application 2020 & 2033
- Table 54: Rest of Europe PV Module Junction Boxes Volume (K) Forecast, by Application 2020 & 2033
- Table 55: Global PV Module Junction Boxes Revenue billion Forecast, by Application 2020 & 2033
- Table 56: Global PV Module Junction Boxes Volume K Forecast, by Application 2020 & 2033
- Table 57: Global PV Module Junction Boxes Revenue billion Forecast, by Types 2020 & 2033
- Table 58: Global PV Module Junction Boxes Volume K Forecast, by Types 2020 & 2033
- Table 59: Global PV Module Junction Boxes Revenue billion Forecast, by Country 2020 & 2033
- Table 60: Global PV Module Junction Boxes Volume K Forecast, by Country 2020 & 2033
- Table 61: Turkey PV Module Junction Boxes Revenue (billion) Forecast, by Application 2020 & 2033
- Table 62: Turkey PV Module Junction Boxes Volume (K) Forecast, by Application 2020 & 2033
- Table 63: Israel PV Module Junction Boxes Revenue (billion) Forecast, by Application 2020 & 2033
- Table 64: Israel PV Module Junction Boxes Volume (K) Forecast, by Application 2020 & 2033
- Table 65: GCC PV Module Junction Boxes Revenue (billion) Forecast, by Application 2020 & 2033
- Table 66: GCC PV Module Junction Boxes Volume (K) Forecast, by Application 2020 & 2033
- Table 67: North Africa PV Module Junction Boxes Revenue (billion) Forecast, by Application 2020 & 2033
- Table 68: North Africa PV Module Junction Boxes Volume (K) Forecast, by Application 2020 & 2033
- Table 69: South Africa PV Module Junction Boxes Revenue (billion) Forecast, by Application 2020 & 2033
- Table 70: South Africa PV Module Junction Boxes Volume (K) Forecast, by Application 2020 & 2033
- Table 71: Rest of Middle East & Africa PV Module Junction Boxes Revenue (billion) Forecast, by Application 2020 & 2033
- Table 72: Rest of Middle East & Africa PV Module Junction Boxes Volume (K) Forecast, by Application 2020 & 2033
- Table 73: Global PV Module Junction Boxes Revenue billion Forecast, by Application 2020 & 2033
- Table 74: Global PV Module Junction Boxes Volume K Forecast, by Application 2020 & 2033
- Table 75: Global PV Module Junction Boxes Revenue billion Forecast, by Types 2020 & 2033
- Table 76: Global PV Module Junction Boxes Volume K Forecast, by Types 2020 & 2033
- Table 77: Global PV Module Junction Boxes Revenue billion Forecast, by Country 2020 & 2033
- Table 78: Global PV Module Junction Boxes Volume K Forecast, by Country 2020 & 2033
- Table 79: China PV Module Junction Boxes Revenue (billion) Forecast, by Application 2020 & 2033
- Table 80: China PV Module Junction Boxes Volume (K) Forecast, by Application 2020 & 2033
- Table 81: India PV Module Junction Boxes Revenue (billion) Forecast, by Application 2020 & 2033
- Table 82: India PV Module Junction Boxes Volume (K) Forecast, by Application 2020 & 2033
- Table 83: Japan PV Module Junction Boxes Revenue (billion) Forecast, by Application 2020 & 2033
- Table 84: Japan PV Module Junction Boxes Volume (K) Forecast, by Application 2020 & 2033
- Table 85: South Korea PV Module Junction Boxes Revenue (billion) Forecast, by Application 2020 & 2033
- Table 86: South Korea PV Module Junction Boxes Volume (K) Forecast, by Application 2020 & 2033
- Table 87: ASEAN PV Module Junction Boxes Revenue (billion) Forecast, by Application 2020 & 2033
- Table 88: ASEAN PV Module Junction Boxes Volume (K) Forecast, by Application 2020 & 2033
- Table 89: Oceania PV Module Junction Boxes Revenue (billion) Forecast, by Application 2020 & 2033
- Table 90: Oceania PV Module Junction Boxes Volume (K) Forecast, by Application 2020 & 2033
- Table 91: Rest of Asia Pacific PV Module Junction Boxes Revenue (billion) Forecast, by Application 2020 & 2033
- Table 92: Rest of Asia Pacific PV Module Junction Boxes Volume (K) Forecast, by Application 2020 & 2033
Frequently Asked Questions
1. What is the projected Compound Annual Growth Rate (CAGR) of the PV Module Junction Boxes?
The projected CAGR is approximately 12.15%.
2. Which companies are prominent players in the PV Module Junction Boxes?
Key companies in the market include TE Connectivity, Stäubli Electrical Connectors, Targray, Geesys Technologies, DuPont, LEONI Studer AG, Renhe Solar(Zhejiang Renhe Photovoltaic Technology Co., Ltd.), Amphenol Industrial Products, Ningbo GZX PV Technology CO., LTD., Sunter, Yitong Solar, Ningbo ChuangYuan PV Technology Co., Ltd, QC Solar (Suzhou) Corporation, Linyang Renewable, LEATEC Fine Ceramics, Jiangsu Tonglin Electric Co., Ltd..
3. What are the main segments of the PV Module Junction Boxes?
The market segments include Application, Types.
4. Can you provide details about the market size?
The market size is estimated to be USD 10.46 billion as of 2022.
5. What are some drivers contributing to market growth?
N/A
6. What are the notable trends driving market growth?
N/A
7. Are there any restraints impacting market growth?
N/A
8. Can you provide examples of recent developments in the market?
N/A
9. What pricing options are available for accessing the report?
Pricing options include single-user, multi-user, and enterprise licenses priced at USD 3950.00, USD 5925.00, and USD 7900.00 respectively.
10. Is the market size provided in terms of value or volume?
The market size is provided in terms of value, measured in billion and volume, measured in K.
11. Are there any specific market keywords associated with the report?
Yes, the market keyword associated with the report is "PV Module Junction Boxes," which aids in identifying and referencing the specific market segment covered.
12. How do I determine which pricing option suits my needs best?
The pricing options vary based on user requirements and access needs. Individual users may opt for single-user licenses, while businesses requiring broader access may choose multi-user or enterprise licenses for cost-effective access to the report.
13. Are there any additional resources or data provided in the PV Module Junction Boxes report?
While the report offers comprehensive insights, it's advisable to review the specific contents or supplementary materials provided to ascertain if additional resources or data are available.
14. How can I stay updated on further developments or reports in the PV Module Junction Boxes?
To stay informed about further developments, trends, and reports in the PV Module Junction Boxes, consider subscribing to industry newsletters, following relevant companies and organizations, or regularly checking reputable industry news sources and publications.
Methodology
Step 1 - Identification of Relevant Samples Size from Population Database


Step 2 - Approaches for Defining Global Market Size (Value, Volume* & Price*)

Note*: In applicable scenarios
Step 3 - Data Sources
Primary Research
- Web Analytics
- Survey Reports
- Research Institute
- Latest Research Reports
- Opinion Leaders
Secondary Research
- Annual Reports
- White Paper
- Latest Press Release
- Industry Association
- Paid Database
- Investor Presentations

Step 4 - Data Triangulation
Involves using different sources of information in order to increase the validity of a study
These sources are likely to be stakeholders in a program - participants, other researchers, program staff, other community members, and so on.
Then we put all data in single framework & apply various statistical tools to find out the dynamic on the market.
During the analysis stage, feedback from the stakeholder groups would be compared to determine areas of agreement as well as areas of divergence