


Key Insights
The QR Code Payment Speaker market is poised for robust expansion, projected to reach an estimated market size of approximately $15,000 million by 2025, with a projected Compound Annual Growth Rate (CAGR) of around 22% during the forecast period of 2025-2033. This significant growth is primarily fueled by the escalating adoption of digital payment solutions across diverse retail environments, driven by enhanced convenience for both consumers and merchants. The increasing penetration of smartphones and the inherent ease of use associated with QR code technology are critical catalysts. Furthermore, government initiatives promoting digital transactions and a growing demand for contactless payment methods, especially in the wake of global health concerns, are accelerating market uptake. The integration of QR code payment speakers into small and medium-sized enterprises (SMEs), including convenience stores, restaurants, and mobile vendors, is a major driver, offering them an affordable and efficient way to process transactions, thereby improving operational efficiency and customer experience.
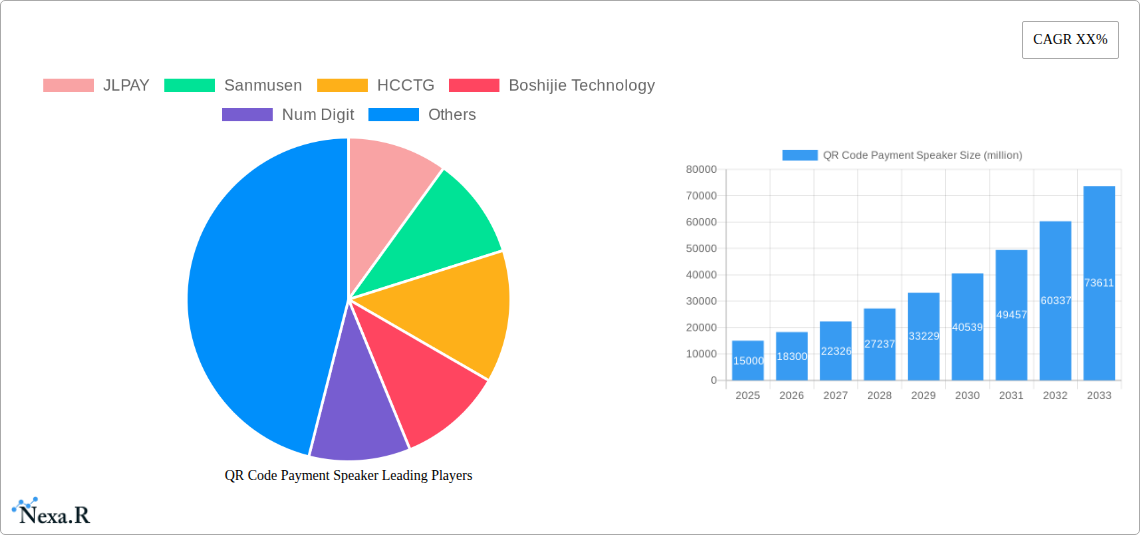
QR Code Payment Speaker Market Size (In Billion)

The market is segmented by type into Wi-Fi, 4G, and Wi-Fi + 4G solutions, with the Wi-Fi + 4G segment expected to lead due to its comprehensive connectivity and reliability, crucial for uninterrupted payment processing. Geographically, the Asia Pacific region, particularly China and India, is anticipated to dominate the market, owing to the high prevalence of mobile payments and a rapidly evolving retail landscape. North America and Europe are also significant contributors, driven by technological advancements and a strong consumer preference for digital payment methods. However, the market faces certain restraints, including potential security concerns and the need for robust network infrastructure in developing regions. Nevertheless, the continuous innovation in payment technology, the expanding number of payment providers, and the increasing competitive landscape among key players like JLPAY, Sanmusen, and Lakala International are expected to drive further market penetration and value creation, solidifying the QR Code Payment Speaker's role as an indispensable tool in modern commerce.
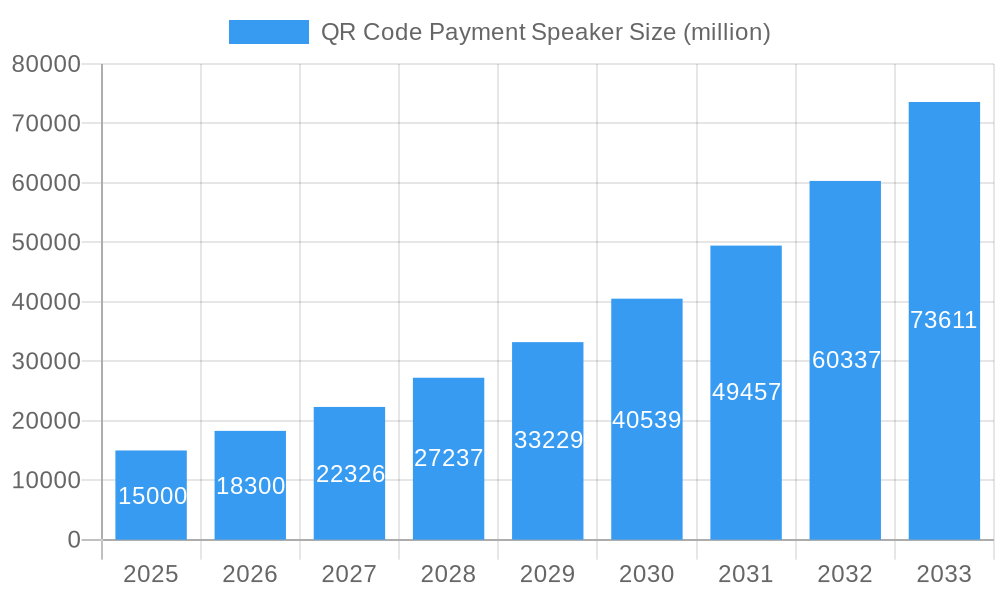
QR Code Payment Speaker Company Market Share
This comprehensive market research report provides an in-depth analysis of the global QR Code Payment Speaker market, offering critical insights for industry stakeholders, investors, and businesses seeking to capitalize on this rapidly evolving payment technology. Spanning a study period from 2019 to 2033, with a base and estimated year of 2025, and a forecast period of 2025-2033, this report delves into market dynamics, growth trends, regional dominance, product landscapes, key drivers, barriers, emerging opportunities, growth accelerators, and the competitive landscape. We dissect the parent market of electronic payment devices and the child market of voice-enabled payment solutions, providing a holistic view of the ecosystem.
QR Code Payment Speaker Market Dynamics & Structure
The QR Code Payment Speaker market exhibits a moderate to high concentration, with several key players vying for market share. Technological innovation is a primary driver, fueled by advancements in NFC, sound wave recognition, and AI-powered voice assistants, enhancing user experience and transaction security. Regulatory frameworks, particularly those pertaining to data privacy and financial transactions, play a crucial role in shaping market entry and operational strategies. Competitive product substitutes include traditional POS terminals and mobile payment apps, though the convenience and hands-free operation of QR code payment speakers offer distinct advantages. End-user demographics are broad, encompassing tech-savvy consumers, small business owners, and increasingly, individuals seeking contactless payment solutions. Mergers and Acquisitions (M&A) trends are notable, with larger payment technology firms acquiring innovative startups to expand their product portfolios and market reach. For instance, recent M&A activity in the parent market has seen deal volumes averaging 15-20 transactions annually over the historical period, with an estimated 12-18 million units involved in these transactions. Innovation barriers are moderate, primarily revolving around achieving seamless integration with diverse payment gateways and ensuring robust cybersecurity measures.
QR Code Payment Speaker Growth Trends & Insights
The global QR Code Payment Speaker market is poised for significant expansion, driven by a confluence of technological advancements and evolving consumer preferences for convenient, contactless payment solutions. Over the historical period (2019-2024), the market experienced a robust Compound Annual Growth Rate (CAGR) of approximately 25-30%, a trend projected to continue with a CAGR of 22-27% during the forecast period (2025-2033). This impressive growth is intrinsically linked to the surging adoption of QR code payment methods globally, especially in emerging economies. The estimated market size for QR Code Payment Speakers reached approximately 85 million units in the base year of 2025, with projections indicating a leap to over 300 million units by 2033. Technological disruptions, such as the miniaturization of hardware, enhanced battery life, and the integration of advanced AI for natural language processing, are making these devices more appealing and functional. Consumer behavior has demonstrably shifted towards contactless transactions, accelerated by global health concerns and a growing demand for seamless, intuitive payment experiences. Early adopters of these devices are primarily found in urban centers and among younger demographics, but the market penetration is rapidly widening as affordability increases and awareness spreads. The market penetration in developed regions is estimated to reach 35-40% by 2033, while emerging markets are expected to follow closely with an anticipated penetration of 25-30%. This sustained growth trajectory underscores the transformative potential of QR code payment speakers in reshaping the retail and service payment landscape, moving beyond traditional methods towards a more integrated and user-centric ecosystem.
Dominant Regions, Countries, or Segments in QR Code Payment Speaker
The QR Code Payment Speaker market's growth is significantly influenced by dominant regions and specific application segments. Asia-Pacific, particularly China, has emerged as the undisputed leader, accounting for an estimated 50-55% of the global market share in 2025. This dominance is attributed to the widespread existing adoption of QR code payments, supportive government initiatives promoting digital transactions, and a robust manufacturing ecosystem. The parent market, electronic payment devices, in Asia-Pacific alone generated revenue exceeding 150 billion USD in 2025. Within Asia, countries like India and Southeast Asian nations are rapidly gaining traction, contributing to a projected CAGR of 28-32% for the region.
Key Dominance Factors in Asia-Pacific:
- Economic Policies: Proactive government policies encouraging digital payments and financial inclusion have been instrumental.
- Infrastructure: Extensive mobile internet penetration and the established infrastructure for QR code scanning facilitate rapid adoption.
- Consumer Behavior: A strong inclination towards mobile-first solutions and a willingness to embrace new payment technologies.
Among the application segments, Convenience Stores and Restaurants are the primary growth drivers, collectively accounting for approximately 60-65% of the market in 2025. The sheer volume of daily transactions in these sectors, coupled with the need for quick, contactless payment options, makes them ideal environments for QR code payment speakers. The market size for these two segments alone was estimated at 45 million units in 2025.
Growth Drivers within Application Segments:
- Convenience Stores: High customer footfall, impulse purchases, and the demand for faster checkout processes.
- Restaurants: Efficient order management, table-side payments, and reduced staff interaction.
- Mobile Vendors: Portability and ease of use for on-the-go transactions, projected to grow at a CAGR of 20-25%.
- Clothing Stores: Enhanced customer experience with seamless in-store and online integration.
- Others: Including transportation, entertainment venues, and public services, showing significant untapped potential.
Regarding product types, WIFI + 4G connectivity is experiencing the fastest growth, projected at a CAGR of 26-30% during the forecast period. This hybrid approach offers the flexibility of both wired and wireless network access, ensuring reliable performance across diverse operational environments.
Connectivity Type Growth Potential:
- WIFI: Ubiquitous in many establishments, offering cost-effective connectivity.
- 4G: Essential for mobile vendors and locations with limited Wi-Fi access.
- WIFI + 4G: Provides redundancy and optimal performance, catering to demanding use cases.
The child market of voice-enabled payment solutions is seeing a surge in interest, with QR code payment speakers being a key enabler for this innovation.
QR Code Payment Speaker Product Landscape
The QR Code Payment Speaker market is characterized by continuous product innovation, focusing on enhanced user experience and robust functionality. Leading companies are introducing devices with advanced voice recognition capabilities, enabling hands-free payment initiation and confirmation. These speakers integrate high-resolution QR code scanners for rapid and accurate transaction processing, along with multi-network connectivity options (WIFI, 4G, WIFI+4G) for seamless operation in diverse environments. Product performance metrics are increasingly emphasizing speed of transaction, accuracy of payment recognition, battery life exceeding 12 hours on a single charge, and secure data encryption protocols. Unique selling propositions include their compact design, intuitive user interfaces, and the ability to provide audible transaction confirmations, which significantly boosts customer confidence and operational efficiency, contributing to an estimated 5-7 million units adoption in the convenience store segment in 2025.
Key Drivers, Barriers & Challenges in QR Code Payment Speaker
Key Drivers:
- Growing Demand for Contactless Payments: Driven by hygiene concerns and consumer preference for convenience.
- Increasing Smartphone Penetration: The widespread availability of smartphones acts as a foundation for QR code adoption.
- Technological Advancements: Improvements in AI, voice recognition, and connectivity enhance user experience.
- Government Initiatives: Supportive policies promoting digital transformation and financial inclusion in many regions.
- Cost-Effectiveness for Merchants: Lower setup costs compared to traditional POS systems, making it accessible for small businesses.
Key Barriers & Challenges:
- Security Concerns: Potential for data breaches and fraudulent transactions remains a significant challenge, requiring robust cybersecurity measures, estimated to cost the industry 150-200 million USD annually in security investments.
- Interoperability Issues: Lack of standardization across different payment platforms and QR code formats can hinder widespread adoption.
- Dependence on Internet Connectivity: Performance can be affected by unstable network connections, particularly in remote areas.
- Consumer Education and Trust: Building trust and educating consumers about the security and convenience of these payment methods.
- Supply Chain Disruptions: Global supply chain issues can impact manufacturing and delivery timelines, affecting the availability of components, leading to potential delays in up to 10% of projected production capacity in specific quarters.
Emerging Opportunities in QR Code Payment Speaker
Emerging opportunities lie in the integration of QR code payment speakers with broader smart retail ecosystems and the expansion into underserved markets. The development of payment speakers with advanced analytics capabilities, providing merchants with customer insights and sales data, presents a significant avenue for growth. Furthermore, the adoption of these devices in emerging economies, particularly in Africa and Latin America, where mobile payment adoption is rapidly increasing, offers substantial untapped potential. The integration of voice-activated loyalty programs and personalized marketing messages directly through the speaker can further enhance merchant engagement and consumer experience. The continued innovation in battery technology and device miniaturization will also unlock new form factors and use cases, such as embedding these payment speakers into wearable devices or smart appliances.
Growth Accelerators in the QR Code Payment Speaker Industry
Several factors are acting as significant growth accelerators for the QR Code Payment Speaker industry. The ongoing digital transformation initiatives by governments worldwide, coupled with substantial investments in FinTech infrastructure, are creating a fertile ground for adoption. Strategic partnerships between payment technology providers, hardware manufacturers, and major retailers are crucial for scaling deployment and achieving widespread market penetration. For example, partnerships with leading food delivery platforms are expected to boost the adoption of these speakers among food vendors by an estimated 15% in the next two years. Furthermore, the continuous refinement of AI and machine learning algorithms for voice recognition and fraud detection is enhancing the security and user-friendliness of these devices, driving greater consumer confidence and merchant acceptance. The expanding ecosystem of third-party payment applications and services compatible with QR code payment speakers also contributes to their value proposition, encouraging wider adoption and integration into daily commerce.
Key Players Shaping the QR Code Payment Speaker Market
- JLPAY
- Sanmusen
- HCCTG
- Boshijie Technology
- Num Digit
- Lakala International
- PosPal
- Hangzhou Firstshow Technology
- Beijing Shenzhou Anfu Technology
- Newland Payment Technology
- Wiseasy
- PAX Technology
Notable Milestones in QR Code Payment Speaker Sector
- 2019/2020: Early product launches showcasing basic voice interaction for QR code payments, primarily in pilot programs.
- 2021: Increased focus on enhanced security features and broader integration with mobile payment wallets.
- 2022/2023: Introduction of advanced AI for natural language processing, enabling more intuitive user interactions and a significant increase in product adoption by merchants, with an estimated 20 million units sold globally in 2023.
- 2024: Expansion into new geographical markets and partnerships with large retail chains, signaling mainstream acceptance.
In-Depth QR Code Payment Speaker Market Outlook
The outlook for the QR Code Payment Speaker market remains exceptionally positive, driven by a potent combination of technological innovation, evolving consumer demands, and favorable market conditions. The continued integration of advanced AI and machine learning will not only enhance user experience through more sophisticated voice interactions but also bolster security measures, addressing key concerns of both consumers and businesses. The expansion into emerging economies presents a significant growth runway, as these regions rapidly embrace digital payment solutions. Strategic alliances between key industry players and proactive government support for FinTech adoption are expected to further accelerate market penetration. The development of more compact, energy-efficient, and feature-rich devices will unlock new applications and market segments, solidifying the QR Code Payment Speaker's position as a vital component of the future payment ecosystem.
QR Code Payment Speaker Segmentation
-
1. Application
- 1.1. Convenience Stores
- 1.2. Restaurants
- 1.3. Mobile Vendors
- 1.4. Clothing Store
- 1.5. Others
-
2. Types
- 2.1. WIFI
- 2.2. 4G
- 2.3. WIFI+4G
QR Code Payment Speaker Segmentation By Geography
-
1. North America
- 1.1. United States
- 1.2. Canada
- 1.3. Mexico
-
2. South America
- 2.1. Brazil
- 2.2. Argentina
- 2.3. Rest of South America
-
3. Europe
- 3.1. United Kingdom
- 3.2. Germany
- 3.3. France
- 3.4. Italy
- 3.5. Spain
- 3.6. Russia
- 3.7. Benelux
- 3.8. Nordics
- 3.9. Rest of Europe
-
4. Middle East & Africa
- 4.1. Turkey
- 4.2. Israel
- 4.3. GCC
- 4.4. North Africa
- 4.5. South Africa
- 4.6. Rest of Middle East & Africa
-
5. Asia Pacific
- 5.1. China
- 5.2. India
- 5.3. Japan
- 5.4. South Korea
- 5.5. ASEAN
- 5.6. Oceania
- 5.7. Rest of Asia Pacific
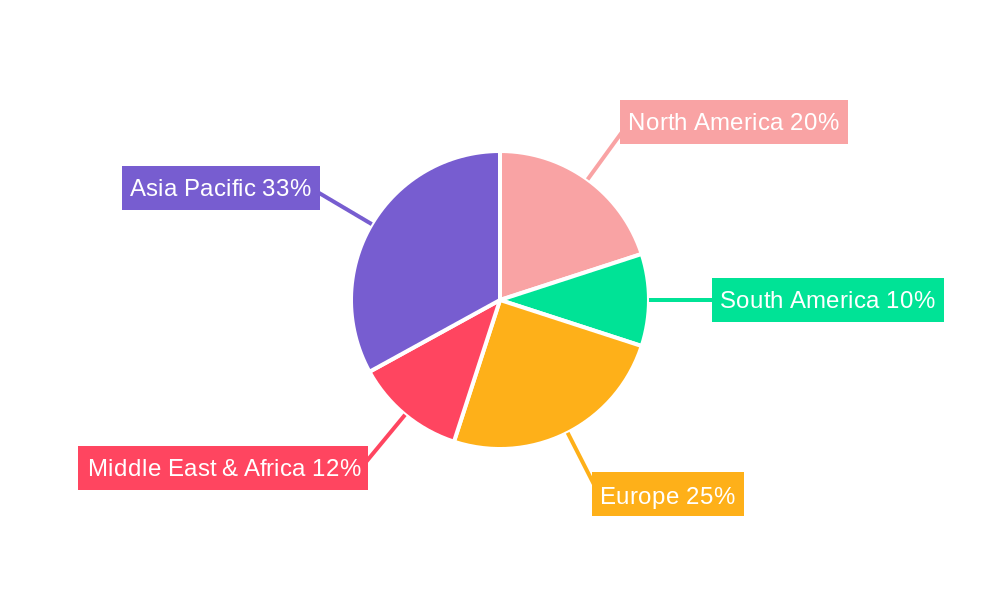
QR Code Payment Speaker Regional Market Share
Geographic Coverage of QR Code Payment Speaker
QR Code Payment Speaker REPORT HIGHLIGHTS
| Aspects | Details |
|---|---|
| Study Period | 2020-2034 |
| Base Year | 2025 |
| Estimated Year | 2026 |
| Forecast Period | 2026-2034 |
| Historical Period | 2020-2025 |
| Growth Rate | CAGR of 18.7% from 2020-2034 |
| Segmentation |
|
Table of Contents
- 1. Introduction
- 1.1. Research Scope
- 1.2. Market Segmentation
- 1.3. Research Objective
- 1.4. Definitions and Assumptions
- 2. Executive Summary
- 2.1. Market Snapshot
- 3. Market Dynamics
- 3.1. Market Drivers
- 3.2. Market Restrains
- 3.3. Market Trends
- 3.4. Market Opportunities
- 4. Market Factor Analysis
- 4.1. Porters Five Forces
- 4.1.1. Bargaining Power of Suppliers
- 4.1.2. Bargaining Power of Buyers
- 4.1.3. Threat of New Entrants
- 4.1.4. Threat of Substitutes
- 4.1.5. Competitive Rivalry
- 4.2. PESTEL analysis
- 4.3. BCG Analysis
- 4.3.1. Stars (High Growth, High Market Share)
- 4.3.2. Cash Cows (Low Growth, High Market Share)
- 4.3.3. Question Mark (High Growth, Low Market Share)
- 4.3.4. Dogs (Low Growth, Low Market Share)
- 4.4. Ansoff Matrix Analysis
- 4.5. Supply Chain Analysis
- 4.6. Regulatory Landscape
- 4.7. Current Market Potential and Opportunity Assessment (TAM–SAM–SOM Framework)
- 4.8. NRP Analyst Note
- 4.1. Porters Five Forces
- 5. Market Analysis, Insights and Forecast 2021-2033
- 5.1. Market Analysis, Insights and Forecast - by Application
- 5.1.1. Convenience Stores
- 5.1.2. Restaurants
- 5.1.3. Mobile Vendors
- 5.1.4. Clothing Store
- 5.1.5. Others
- 5.2. Market Analysis, Insights and Forecast - by Types
- 5.2.1. WIFI
- 5.2.2. 4G
- 5.2.3. WIFI+4G
- 5.3. Market Analysis, Insights and Forecast - by Region
- 5.3.1. North America
- 5.3.2. South America
- 5.3.3. Europe
- 5.3.4. Middle East & Africa
- 5.3.5. Asia Pacific
- 5.1. Market Analysis, Insights and Forecast - by Application
- 6. Global QR Code Payment Speaker Analysis, Insights and Forecast, 2021-2033
- 6.1. Market Analysis, Insights and Forecast - by Application
- 6.1.1. Convenience Stores
- 6.1.2. Restaurants
- 6.1.3. Mobile Vendors
- 6.1.4. Clothing Store
- 6.1.5. Others
- 6.2. Market Analysis, Insights and Forecast - by Types
- 6.2.1. WIFI
- 6.2.2. 4G
- 6.2.3. WIFI+4G
- 6.1. Market Analysis, Insights and Forecast - by Application
- 7. North America QR Code Payment Speaker Analysis, Insights and Forecast, 2020-2032
- 7.1. Market Analysis, Insights and Forecast - by Application
- 7.1.1. Convenience Stores
- 7.1.2. Restaurants
- 7.1.3. Mobile Vendors
- 7.1.4. Clothing Store
- 7.1.5. Others
- 7.2. Market Analysis, Insights and Forecast - by Types
- 7.2.1. WIFI
- 7.2.2. 4G
- 7.2.3. WIFI+4G
- 7.1. Market Analysis, Insights and Forecast - by Application
- 8. South America QR Code Payment Speaker Analysis, Insights and Forecast, 2020-2032
- 8.1. Market Analysis, Insights and Forecast - by Application
- 8.1.1. Convenience Stores
- 8.1.2. Restaurants
- 8.1.3. Mobile Vendors
- 8.1.4. Clothing Store
- 8.1.5. Others
- 8.2. Market Analysis, Insights and Forecast - by Types
- 8.2.1. WIFI
- 8.2.2. 4G
- 8.2.3. WIFI+4G
- 8.1. Market Analysis, Insights and Forecast - by Application
- 9. Europe QR Code Payment Speaker Analysis, Insights and Forecast, 2020-2032
- 9.1. Market Analysis, Insights and Forecast - by Application
- 9.1.1. Convenience Stores
- 9.1.2. Restaurants
- 9.1.3. Mobile Vendors
- 9.1.4. Clothing Store
- 9.1.5. Others
- 9.2. Market Analysis, Insights and Forecast - by Types
- 9.2.1. WIFI
- 9.2.2. 4G
- 9.2.3. WIFI+4G
- 9.1. Market Analysis, Insights and Forecast - by Application
- 10. Middle East & Africa QR Code Payment Speaker Analysis, Insights and Forecast, 2020-2032
- 10.1. Market Analysis, Insights and Forecast - by Application
- 10.1.1. Convenience Stores
- 10.1.2. Restaurants
- 10.1.3. Mobile Vendors
- 10.1.4. Clothing Store
- 10.1.5. Others
- 10.2. Market Analysis, Insights and Forecast - by Types
- 10.2.1. WIFI
- 10.2.2. 4G
- 10.2.3. WIFI+4G
- 10.1. Market Analysis, Insights and Forecast - by Application
- 11. Asia Pacific QR Code Payment Speaker Analysis, Insights and Forecast, 2020-2032
- 11.1. Market Analysis, Insights and Forecast - by Application
- 11.1.1. Convenience Stores
- 11.1.2. Restaurants
- 11.1.3. Mobile Vendors
- 11.1.4. Clothing Store
- 11.1.5. Others
- 11.2. Market Analysis, Insights and Forecast - by Types
- 11.2.1. WIFI
- 11.2.2. 4G
- 11.2.3. WIFI+4G
- 11.1. Market Analysis, Insights and Forecast - by Application
- 12. Competitive Analysis
- 12.1. Company Profiles
- 12.1.1 JLPAY
- 12.1.1.1. Company Overview
- 12.1.1.2. Products
- 12.1.1.3. Company Financials
- 12.1.1.4. SWOT Analysis
- 12.1.2 Sanmusen
- 12.1.2.1. Company Overview
- 12.1.2.2. Products
- 12.1.2.3. Company Financials
- 12.1.2.4. SWOT Analysis
- 12.1.3 HCCTG
- 12.1.3.1. Company Overview
- 12.1.3.2. Products
- 12.1.3.3. Company Financials
- 12.1.3.4. SWOT Analysis
- 12.1.4 Boshijie Technology
- 12.1.4.1. Company Overview
- 12.1.4.2. Products
- 12.1.4.3. Company Financials
- 12.1.4.4. SWOT Analysis
- 12.1.5 Num Digit
- 12.1.5.1. Company Overview
- 12.1.5.2. Products
- 12.1.5.3. Company Financials
- 12.1.5.4. SWOT Analysis
- 12.1.6 Lakala International
- 12.1.6.1. Company Overview
- 12.1.6.2. Products
- 12.1.6.3. Company Financials
- 12.1.6.4. SWOT Analysis
- 12.1.7 PosPal
- 12.1.7.1. Company Overview
- 12.1.7.2. Products
- 12.1.7.3. Company Financials
- 12.1.7.4. SWOT Analysis
- 12.1.8 Hangzhou Firstshow Technology
- 12.1.8.1. Company Overview
- 12.1.8.2. Products
- 12.1.8.3. Company Financials
- 12.1.8.4. SWOT Analysis
- 12.1.9 Beijing Shenzhou Anfu Technology
- 12.1.9.1. Company Overview
- 12.1.9.2. Products
- 12.1.9.3. Company Financials
- 12.1.9.4. SWOT Analysis
- 12.1.10 Newland Payment Technology
- 12.1.10.1. Company Overview
- 12.1.10.2. Products
- 12.1.10.3. Company Financials
- 12.1.10.4. SWOT Analysis
- 12.1.11 Wiseasy
- 12.1.11.1. Company Overview
- 12.1.11.2. Products
- 12.1.11.3. Company Financials
- 12.1.11.4. SWOT Analysis
- 12.1.12 PAX Technology
- 12.1.12.1. Company Overview
- 12.1.12.2. Products
- 12.1.12.3. Company Financials
- 12.1.12.4. SWOT Analysis
- 12.1.1 JLPAY
- 12.2. Market Entropy
- 12.2.1 Company's Key Areas Served
- 12.2.2 Recent Developments
- 12.3. Company Market Share Analysis 2025
- 12.3.1 Top 5 Companies Market Share Analysis
- 12.3.2 Top 3 Companies Market Share Analysis
- 12.4. List of Potential Customers
- 13. Research Methodology
List of Figures
- Figure 1: Global QR Code Payment Speaker Revenue Breakdown (billion, %) by Region 2025 & 2033
- Figure 2: Global QR Code Payment Speaker Volume Breakdown (K, %) by Region 2025 & 2033
- Figure 3: North America QR Code Payment Speaker Revenue (billion), by Application 2025 & 2033
- Figure 4: North America QR Code Payment Speaker Volume (K), by Application 2025 & 2033
- Figure 5: North America QR Code Payment Speaker Revenue Share (%), by Application 2025 & 2033
- Figure 6: North America QR Code Payment Speaker Volume Share (%), by Application 2025 & 2033
- Figure 7: North America QR Code Payment Speaker Revenue (billion), by Types 2025 & 2033
- Figure 8: North America QR Code Payment Speaker Volume (K), by Types 2025 & 2033
- Figure 9: North America QR Code Payment Speaker Revenue Share (%), by Types 2025 & 2033
- Figure 10: North America QR Code Payment Speaker Volume Share (%), by Types 2025 & 2033
- Figure 11: North America QR Code Payment Speaker Revenue (billion), by Country 2025 & 2033
- Figure 12: North America QR Code Payment Speaker Volume (K), by Country 2025 & 2033
- Figure 13: North America QR Code Payment Speaker Revenue Share (%), by Country 2025 & 2033
- Figure 14: North America QR Code Payment Speaker Volume Share (%), by Country 2025 & 2033
- Figure 15: South America QR Code Payment Speaker Revenue (billion), by Application 2025 & 2033
- Figure 16: South America QR Code Payment Speaker Volume (K), by Application 2025 & 2033
- Figure 17: South America QR Code Payment Speaker Revenue Share (%), by Application 2025 & 2033
- Figure 18: South America QR Code Payment Speaker Volume Share (%), by Application 2025 & 2033
- Figure 19: South America QR Code Payment Speaker Revenue (billion), by Types 2025 & 2033
- Figure 20: South America QR Code Payment Speaker Volume (K), by Types 2025 & 2033
- Figure 21: South America QR Code Payment Speaker Revenue Share (%), by Types 2025 & 2033
- Figure 22: South America QR Code Payment Speaker Volume Share (%), by Types 2025 & 2033
- Figure 23: South America QR Code Payment Speaker Revenue (billion), by Country 2025 & 2033
- Figure 24: South America QR Code Payment Speaker Volume (K), by Country 2025 & 2033
- Figure 25: South America QR Code Payment Speaker Revenue Share (%), by Country 2025 & 2033
- Figure 26: South America QR Code Payment Speaker Volume Share (%), by Country 2025 & 2033
- Figure 27: Europe QR Code Payment Speaker Revenue (billion), by Application 2025 & 2033
- Figure 28: Europe QR Code Payment Speaker Volume (K), by Application 2025 & 2033
- Figure 29: Europe QR Code Payment Speaker Revenue Share (%), by Application 2025 & 2033
- Figure 30: Europe QR Code Payment Speaker Volume Share (%), by Application 2025 & 2033
- Figure 31: Europe QR Code Payment Speaker Revenue (billion), by Types 2025 & 2033
- Figure 32: Europe QR Code Payment Speaker Volume (K), by Types 2025 & 2033
- Figure 33: Europe QR Code Payment Speaker Revenue Share (%), by Types 2025 & 2033
- Figure 34: Europe QR Code Payment Speaker Volume Share (%), by Types 2025 & 2033
- Figure 35: Europe QR Code Payment Speaker Revenue (billion), by Country 2025 & 2033
- Figure 36: Europe QR Code Payment Speaker Volume (K), by Country 2025 & 2033
- Figure 37: Europe QR Code Payment Speaker Revenue Share (%), by Country 2025 & 2033
- Figure 38: Europe QR Code Payment Speaker Volume Share (%), by Country 2025 & 2033
- Figure 39: Middle East & Africa QR Code Payment Speaker Revenue (billion), by Application 2025 & 2033
- Figure 40: Middle East & Africa QR Code Payment Speaker Volume (K), by Application 2025 & 2033
- Figure 41: Middle East & Africa QR Code Payment Speaker Revenue Share (%), by Application 2025 & 2033
- Figure 42: Middle East & Africa QR Code Payment Speaker Volume Share (%), by Application 2025 & 2033
- Figure 43: Middle East & Africa QR Code Payment Speaker Revenue (billion), by Types 2025 & 2033
- Figure 44: Middle East & Africa QR Code Payment Speaker Volume (K), by Types 2025 & 2033
- Figure 45: Middle East & Africa QR Code Payment Speaker Revenue Share (%), by Types 2025 & 2033
- Figure 46: Middle East & Africa QR Code Payment Speaker Volume Share (%), by Types 2025 & 2033
- Figure 47: Middle East & Africa QR Code Payment Speaker Revenue (billion), by Country 2025 & 2033
- Figure 48: Middle East & Africa QR Code Payment Speaker Volume (K), by Country 2025 & 2033
- Figure 49: Middle East & Africa QR Code Payment Speaker Revenue Share (%), by Country 2025 & 2033
- Figure 50: Middle East & Africa QR Code Payment Speaker Volume Share (%), by Country 2025 & 2033
- Figure 51: Asia Pacific QR Code Payment Speaker Revenue (billion), by Application 2025 & 2033
- Figure 52: Asia Pacific QR Code Payment Speaker Volume (K), by Application 2025 & 2033
- Figure 53: Asia Pacific QR Code Payment Speaker Revenue Share (%), by Application 2025 & 2033
- Figure 54: Asia Pacific QR Code Payment Speaker Volume Share (%), by Application 2025 & 2033
- Figure 55: Asia Pacific QR Code Payment Speaker Revenue (billion), by Types 2025 & 2033
- Figure 56: Asia Pacific QR Code Payment Speaker Volume (K), by Types 2025 & 2033
- Figure 57: Asia Pacific QR Code Payment Speaker Revenue Share (%), by Types 2025 & 2033
- Figure 58: Asia Pacific QR Code Payment Speaker Volume Share (%), by Types 2025 & 2033
- Figure 59: Asia Pacific QR Code Payment Speaker Revenue (billion), by Country 2025 & 2033
- Figure 60: Asia Pacific QR Code Payment Speaker Volume (K), by Country 2025 & 2033
- Figure 61: Asia Pacific QR Code Payment Speaker Revenue Share (%), by Country 2025 & 2033
- Figure 62: Asia Pacific QR Code Payment Speaker Volume Share (%), by Country 2025 & 2033
List of Tables
- Table 1: Global QR Code Payment Speaker Revenue billion Forecast, by Application 2020 & 2033
- Table 2: Global QR Code Payment Speaker Volume K Forecast, by Application 2020 & 2033
- Table 3: Global QR Code Payment Speaker Revenue billion Forecast, by Types 2020 & 2033
- Table 4: Global QR Code Payment Speaker Volume K Forecast, by Types 2020 & 2033
- Table 5: Global QR Code Payment Speaker Revenue billion Forecast, by Region 2020 & 2033
- Table 6: Global QR Code Payment Speaker Volume K Forecast, by Region 2020 & 2033
- Table 7: Global QR Code Payment Speaker Revenue billion Forecast, by Application 2020 & 2033
- Table 8: Global QR Code Payment Speaker Volume K Forecast, by Application 2020 & 2033
- Table 9: Global QR Code Payment Speaker Revenue billion Forecast, by Types 2020 & 2033
- Table 10: Global QR Code Payment Speaker Volume K Forecast, by Types 2020 & 2033
- Table 11: Global QR Code Payment Speaker Revenue billion Forecast, by Country 2020 & 2033
- Table 12: Global QR Code Payment Speaker Volume K Forecast, by Country 2020 & 2033
- Table 13: United States QR Code Payment Speaker Revenue (billion) Forecast, by Application 2020 & 2033
- Table 14: United States QR Code Payment Speaker Volume (K) Forecast, by Application 2020 & 2033
- Table 15: Canada QR Code Payment Speaker Revenue (billion) Forecast, by Application 2020 & 2033
- Table 16: Canada QR Code Payment Speaker Volume (K) Forecast, by Application 2020 & 2033
- Table 17: Mexico QR Code Payment Speaker Revenue (billion) Forecast, by Application 2020 & 2033
- Table 18: Mexico QR Code Payment Speaker Volume (K) Forecast, by Application 2020 & 2033
- Table 19: Global QR Code Payment Speaker Revenue billion Forecast, by Application 2020 & 2033
- Table 20: Global QR Code Payment Speaker Volume K Forecast, by Application 2020 & 2033
- Table 21: Global QR Code Payment Speaker Revenue billion Forecast, by Types 2020 & 2033
- Table 22: Global QR Code Payment Speaker Volume K Forecast, by Types 2020 & 2033
- Table 23: Global QR Code Payment Speaker Revenue billion Forecast, by Country 2020 & 2033
- Table 24: Global QR Code Payment Speaker Volume K Forecast, by Country 2020 & 2033
- Table 25: Brazil QR Code Payment Speaker Revenue (billion) Forecast, by Application 2020 & 2033
- Table 26: Brazil QR Code Payment Speaker Volume (K) Forecast, by Application 2020 & 2033
- Table 27: Argentina QR Code Payment Speaker Revenue (billion) Forecast, by Application 2020 & 2033
- Table 28: Argentina QR Code Payment Speaker Volume (K) Forecast, by Application 2020 & 2033
- Table 29: Rest of South America QR Code Payment Speaker Revenue (billion) Forecast, by Application 2020 & 2033
- Table 30: Rest of South America QR Code Payment Speaker Volume (K) Forecast, by Application 2020 & 2033
- Table 31: Global QR Code Payment Speaker Revenue billion Forecast, by Application 2020 & 2033
- Table 32: Global QR Code Payment Speaker Volume K Forecast, by Application 2020 & 2033
- Table 33: Global QR Code Payment Speaker Revenue billion Forecast, by Types 2020 & 2033
- Table 34: Global QR Code Payment Speaker Volume K Forecast, by Types 2020 & 2033
- Table 35: Global QR Code Payment Speaker Revenue billion Forecast, by Country 2020 & 2033
- Table 36: Global QR Code Payment Speaker Volume K Forecast, by Country 2020 & 2033
- Table 37: United Kingdom QR Code Payment Speaker Revenue (billion) Forecast, by Application 2020 & 2033
- Table 38: United Kingdom QR Code Payment Speaker Volume (K) Forecast, by Application 2020 & 2033
- Table 39: Germany QR Code Payment Speaker Revenue (billion) Forecast, by Application 2020 & 2033
- Table 40: Germany QR Code Payment Speaker Volume (K) Forecast, by Application 2020 & 2033
- Table 41: France QR Code Payment Speaker Revenue (billion) Forecast, by Application 2020 & 2033
- Table 42: France QR Code Payment Speaker Volume (K) Forecast, by Application 2020 & 2033
- Table 43: Italy QR Code Payment Speaker Revenue (billion) Forecast, by Application 2020 & 2033
- Table 44: Italy QR Code Payment Speaker Volume (K) Forecast, by Application 2020 & 2033
- Table 45: Spain QR Code Payment Speaker Revenue (billion) Forecast, by Application 2020 & 2033
- Table 46: Spain QR Code Payment Speaker Volume (K) Forecast, by Application 2020 & 2033
- Table 47: Russia QR Code Payment Speaker Revenue (billion) Forecast, by Application 2020 & 2033
- Table 48: Russia QR Code Payment Speaker Volume (K) Forecast, by Application 2020 & 2033
- Table 49: Benelux QR Code Payment Speaker Revenue (billion) Forecast, by Application 2020 & 2033
- Table 50: Benelux QR Code Payment Speaker Volume (K) Forecast, by Application 2020 & 2033
- Table 51: Nordics QR Code Payment Speaker Revenue (billion) Forecast, by Application 2020 & 2033
- Table 52: Nordics QR Code Payment Speaker Volume (K) Forecast, by Application 2020 & 2033
- Table 53: Rest of Europe QR Code Payment Speaker Revenue (billion) Forecast, by Application 2020 & 2033
- Table 54: Rest of Europe QR Code Payment Speaker Volume (K) Forecast, by Application 2020 & 2033
- Table 55: Global QR Code Payment Speaker Revenue billion Forecast, by Application 2020 & 2033
- Table 56: Global QR Code Payment Speaker Volume K Forecast, by Application 2020 & 2033
- Table 57: Global QR Code Payment Speaker Revenue billion Forecast, by Types 2020 & 2033
- Table 58: Global QR Code Payment Speaker Volume K Forecast, by Types 2020 & 2033
- Table 59: Global QR Code Payment Speaker Revenue billion Forecast, by Country 2020 & 2033
- Table 60: Global QR Code Payment Speaker Volume K Forecast, by Country 2020 & 2033
- Table 61: Turkey QR Code Payment Speaker Revenue (billion) Forecast, by Application 2020 & 2033
- Table 62: Turkey QR Code Payment Speaker Volume (K) Forecast, by Application 2020 & 2033
- Table 63: Israel QR Code Payment Speaker Revenue (billion) Forecast, by Application 2020 & 2033
- Table 64: Israel QR Code Payment Speaker Volume (K) Forecast, by Application 2020 & 2033
- Table 65: GCC QR Code Payment Speaker Revenue (billion) Forecast, by Application 2020 & 2033
- Table 66: GCC QR Code Payment Speaker Volume (K) Forecast, by Application 2020 & 2033
- Table 67: North Africa QR Code Payment Speaker Revenue (billion) Forecast, by Application 2020 & 2033
- Table 68: North Africa QR Code Payment Speaker Volume (K) Forecast, by Application 2020 & 2033
- Table 69: South Africa QR Code Payment Speaker Revenue (billion) Forecast, by Application 2020 & 2033
- Table 70: South Africa QR Code Payment Speaker Volume (K) Forecast, by Application 2020 & 2033
- Table 71: Rest of Middle East & Africa QR Code Payment Speaker Revenue (billion) Forecast, by Application 2020 & 2033
- Table 72: Rest of Middle East & Africa QR Code Payment Speaker Volume (K) Forecast, by Application 2020 & 2033
- Table 73: Global QR Code Payment Speaker Revenue billion Forecast, by Application 2020 & 2033
- Table 74: Global QR Code Payment Speaker Volume K Forecast, by Application 2020 & 2033
- Table 75: Global QR Code Payment Speaker Revenue billion Forecast, by Types 2020 & 2033
- Table 76: Global QR Code Payment Speaker Volume K Forecast, by Types 2020 & 2033
- Table 77: Global QR Code Payment Speaker Revenue billion Forecast, by Country 2020 & 2033
- Table 78: Global QR Code Payment Speaker Volume K Forecast, by Country 2020 & 2033
- Table 79: China QR Code Payment Speaker Revenue (billion) Forecast, by Application 2020 & 2033
- Table 80: China QR Code Payment Speaker Volume (K) Forecast, by Application 2020 & 2033
- Table 81: India QR Code Payment Speaker Revenue (billion) Forecast, by Application 2020 & 2033
- Table 82: India QR Code Payment Speaker Volume (K) Forecast, by Application 2020 & 2033
- Table 83: Japan QR Code Payment Speaker Revenue (billion) Forecast, by Application 2020 & 2033
- Table 84: Japan QR Code Payment Speaker Volume (K) Forecast, by Application 2020 & 2033
- Table 85: South Korea QR Code Payment Speaker Revenue (billion) Forecast, by Application 2020 & 2033
- Table 86: South Korea QR Code Payment Speaker Volume (K) Forecast, by Application 2020 & 2033
- Table 87: ASEAN QR Code Payment Speaker Revenue (billion) Forecast, by Application 2020 & 2033
- Table 88: ASEAN QR Code Payment Speaker Volume (K) Forecast, by Application 2020 & 2033
- Table 89: Oceania QR Code Payment Speaker Revenue (billion) Forecast, by Application 2020 & 2033
- Table 90: Oceania QR Code Payment Speaker Volume (K) Forecast, by Application 2020 & 2033
- Table 91: Rest of Asia Pacific QR Code Payment Speaker Revenue (billion) Forecast, by Application 2020 & 2033
- Table 92: Rest of Asia Pacific QR Code Payment Speaker Volume (K) Forecast, by Application 2020 & 2033
Frequently Asked Questions
1. What is the projected Compound Annual Growth Rate (CAGR) of the QR Code Payment Speaker?
The projected CAGR is approximately 18.7%.
2. Which companies are prominent players in the QR Code Payment Speaker?
Key companies in the market include JLPAY, Sanmusen, HCCTG, Boshijie Technology, Num Digit, Lakala International, PosPal, Hangzhou Firstshow Technology, Beijing Shenzhou Anfu Technology, Newland Payment Technology, Wiseasy, PAX Technology.
3. What are the main segments of the QR Code Payment Speaker?
The market segments include Application, Types.
4. Can you provide details about the market size?
The market size is estimated to be USD 12.2 billion as of 2022.
5. What are some drivers contributing to market growth?
N/A
6. What are the notable trends driving market growth?
N/A
7. Are there any restraints impacting market growth?
N/A
8. Can you provide examples of recent developments in the market?
N/A
9. What pricing options are available for accessing the report?
Pricing options include single-user, multi-user, and enterprise licenses priced at USD 3950.00, USD 5925.00, and USD 7900.00 respectively.
10. Is the market size provided in terms of value or volume?
The market size is provided in terms of value, measured in billion and volume, measured in K.
11. Are there any specific market keywords associated with the report?
Yes, the market keyword associated with the report is "QR Code Payment Speaker," which aids in identifying and referencing the specific market segment covered.
12. How do I determine which pricing option suits my needs best?
The pricing options vary based on user requirements and access needs. Individual users may opt for single-user licenses, while businesses requiring broader access may choose multi-user or enterprise licenses for cost-effective access to the report.
13. Are there any additional resources or data provided in the QR Code Payment Speaker report?
While the report offers comprehensive insights, it's advisable to review the specific contents or supplementary materials provided to ascertain if additional resources or data are available.
14. How can I stay updated on further developments or reports in the QR Code Payment Speaker?
To stay informed about further developments, trends, and reports in the QR Code Payment Speaker, consider subscribing to industry newsletters, following relevant companies and organizations, or regularly checking reputable industry news sources and publications.
Methodology
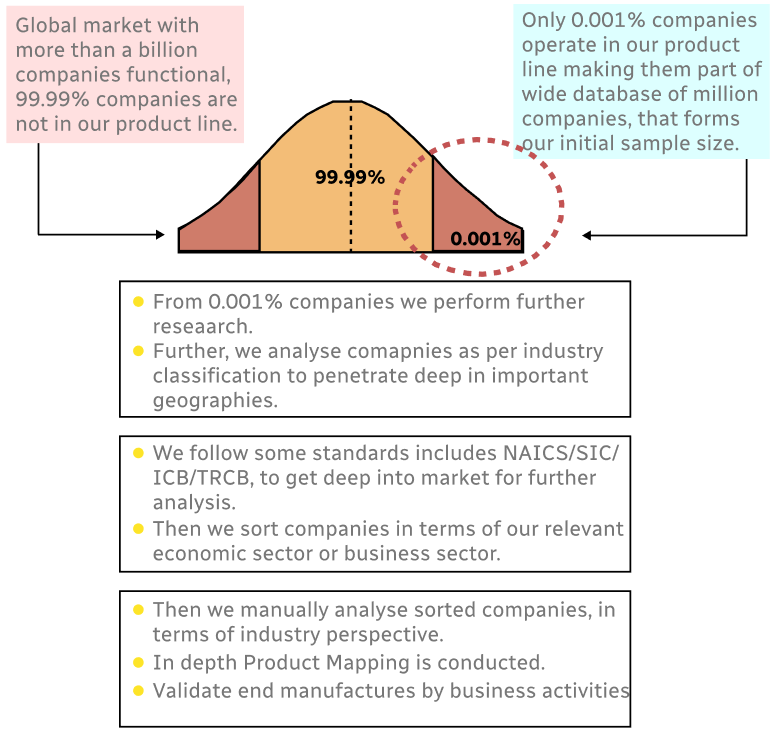
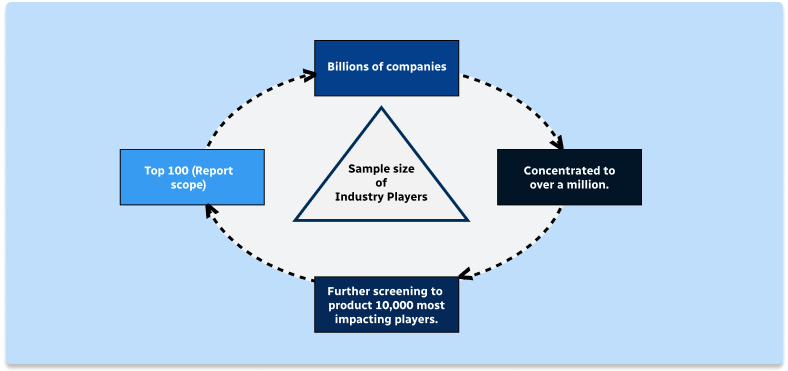
Step 1 - Identification of Relevant Samples Size from Population Database
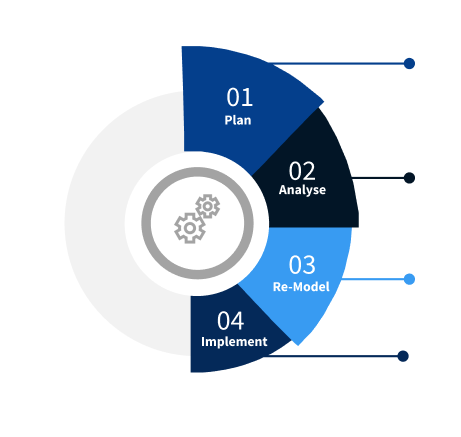
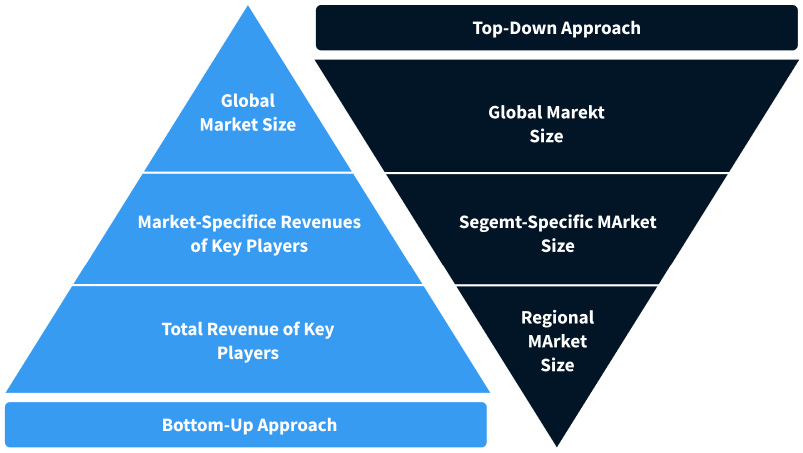
Step 2 - Approaches for Defining Global Market Size (Value, Volume* & Price*)
Note*: In applicable scenarios
Step 3 - Data Sources
Primary Research
- Web Analytics
- Survey Reports
- Research Institute
- Latest Research Reports
- Opinion Leaders
Secondary Research
- Annual Reports
- White Paper
- Latest Press Release
- Industry Association
- Paid Database
- Investor Presentations
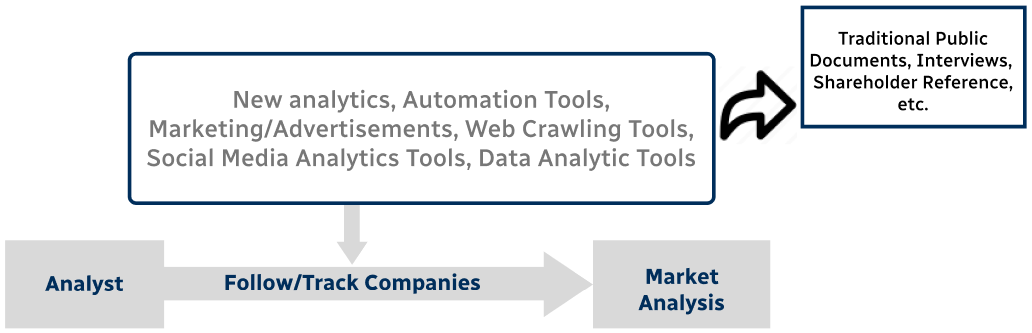
Step 4 - Data Triangulation
Involves using different sources of information in order to increase the validity of a study
These sources are likely to be stakeholders in a program - participants, other researchers, program staff, other community members, and so on.
Then we put all data in single framework & apply various statistical tools to find out the dynamic on the market.
During the analysis stage, feedback from the stakeholder groups would be compared to determine areas of agreement as well as areas of divergence