

Key Insights
The global rugged PDA market is projected for substantial growth, driven by the increasing adoption of advanced mobile computing solutions across diverse industries. With an estimated market size of 3.5 billion in 2024, the sector is expected to experience robust expansion, reaching a projected 4.8 by 2033. This growth trajectory is underpinned by a Compound Annual Growth Rate (CAGR) of approximately 4.8% over the forecast period (2024-2033). Key growth drivers include the escalating demand for enhanced data accuracy, real-time information access, and improved operational efficiency in demanding environments. Industries such as logistics and transportation, manufacturing, and government are increasingly investing in ruggedized devices to withstand harsh conditions, thereby reducing downtime and boosting productivity. The integration of advanced features like enhanced connectivity, superior battery life, and robust data security further fuels market expansion.
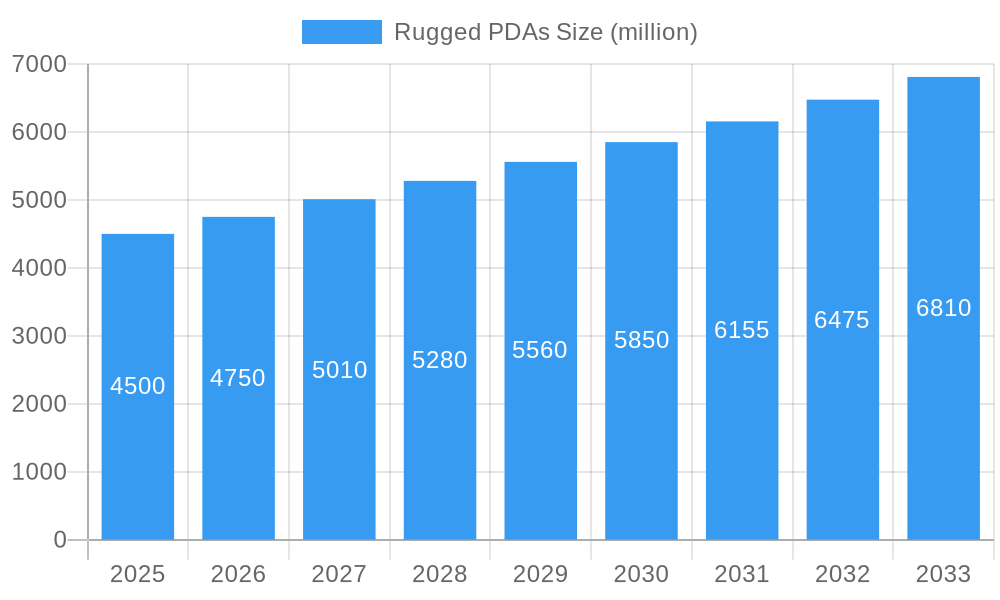
Rugged PDAs Market Size (In Billion)
The market is characterized by a strong emphasis on mobile workforce enablement, where rugged PDAs are instrumental in streamlining field operations. While the Android operating system dominates due to its flexibility and extensive application ecosystem, Windows-based rugged PDAs continue to serve specialized enterprise needs. Restraints, such as the higher initial cost of rugged devices compared to consumer-grade alternatives, are being offset by the demonstrable long-term return on investment through reduced maintenance and extended lifespan. Emerging trends include the integration of IoT capabilities, advanced scanning technologies, and a growing focus on devices with enhanced environmental resilience. Geographically, North America and Europe currently lead the market, with the Asia Pacific region, particularly China and India, expected to witness substantial growth due to rapid industrialization and increasing digitization efforts.
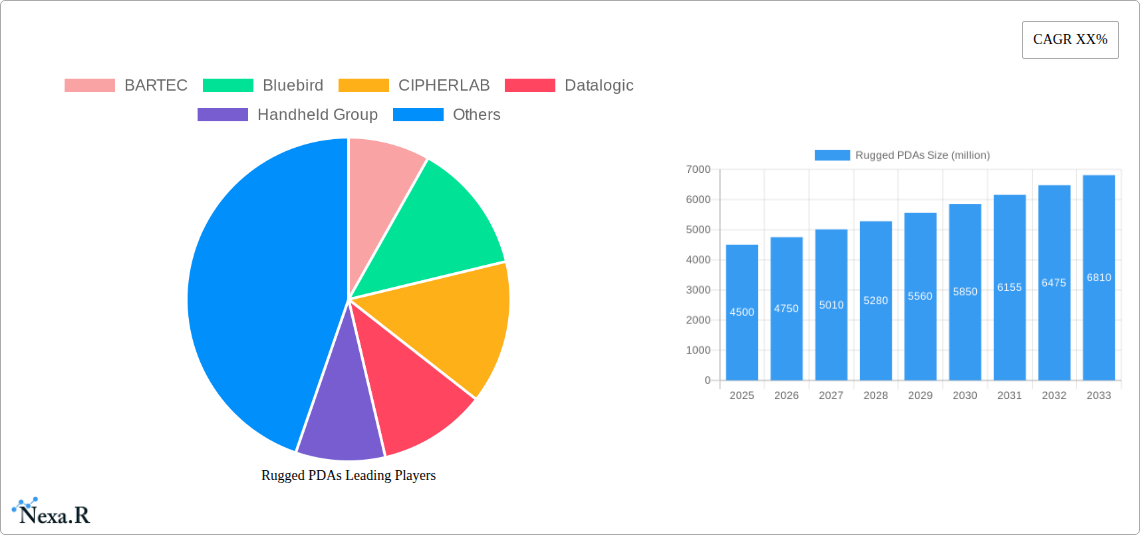
Rugged PDAs Company Market Share
Rugged PDAs Market Report: Unlocking Future Growth and Performance
This comprehensive rugged PDAs market report provides an in-depth analysis of the global landscape from 2019–2033, with a base year of 2025 and a forecast period of 2025–2033. Delving into Android and Windows rugged PDAs, this study covers critical segments including Industrial / Manufacturing, Logistics/Transport, Government, Retail, and Other applications. We dissect market dynamics, growth trends, regional dominance, product innovations, key drivers, barriers, challenges, emerging opportunities, growth accelerators, and the strategic roles of major players. Gain actionable insights into the enterprise mobile computing, field service management, and industrial data collection sectors.
Rugged PDAs Market Dynamics & Structure
The global rugged PDAs market exhibits a moderately consolidated structure, with a few key players like Honeywell International, Zebra Technologies, and Datalogic holding significant market share. Technological innovation remains a primary driver, fueled by advancements in Android OS rugged devices and the increasing demand for robust, reliable mobile computers for harsh environments. Regulatory frameworks, particularly concerning data security and worker safety in industries like logistics/transport and government, are shaping product development and adoption. Competitive product substitutes, such as consumer-grade tablets with rugged cases, present a challenge, but specialized features and durability of purpose-built rugged PDAs continue to command a premium. End-user demographics are shifting towards a younger, tech-savvy workforce in sectors like retail and industrial/manufacturing, demanding intuitive interfaces and seamless integration with existing enterprise systems. Mergers and acquisitions (M&A) trends are moderate, driven by companies seeking to expand their product portfolios and geographical reach. For instance, the acquisition of Getac Technology by a consortium aimed at strengthening its position in the defense sector highlights this trend. Key innovation barriers include the high cost of R&D for specialized hardware and the longer product development cycles required for military-grade certifications.
- Market Concentration: Moderately consolidated, with leading players focusing on innovation and market expansion.
- Technological Innovation Drivers: Demand for faster processing, enhanced connectivity (5G), longer battery life, and improved data capture capabilities.
- Regulatory Frameworks: Strict data security mandates and worker safety regulations in critical sectors.
- Competitive Product Substitutes: Consumer-grade devices with protective casings, though lacking specialized ruggedization.
- End-User Demographics: Growing demand from younger, digitally native workforces in diverse industries.
- M&A Trends: Strategic acquisitions to broaden product offerings and market penetration.
- Innovation Barriers: High R&D investment, stringent testing and certification processes.
Rugged PDAs Growth Trends & Insights
The rugged PDAs market size is projected for robust expansion throughout the forecast period. Fueled by increasing digitalization across industries and the persistent need for reliable data capture and communication in challenging environments, the market is expected to witness a healthy Compound Annual Growth Rate (CAGR). The adoption rates for Windows rugged PDAs are gradually declining as Android rugged devices gain traction due to their open-source nature, flexibility, and lower total cost of ownership. Technological disruptions are playing a pivotal role, with the integration of advanced features such as enhanced barcode scanning capabilities, RFID technology, and IoT connectivity becoming standard. This evolution addresses the growing demand for real-time data processing and enhanced operational efficiency in sectors like logistics/transport and industrial/manufacturing. Consumer behavior shifts, influenced by the familiarity with consumer smartphones, are driving demand for user-friendly interfaces and intuitive operating systems on rugged devices. Companies are increasingly recognizing the total cost of ownership benefits of investing in ruggedized solutions over their commercial counterparts, leading to higher market penetration. The projected rugged PDAs market value in 2025 is approximately $5,500 million units, expected to grow to over $8,000 million units by 2033.
Dominant Regions, Countries, or Segments in Rugged PDAs
The Industrial / Manufacturing segment stands out as a dominant force in the rugged PDAs market, driven by the imperative for operational efficiency, safety, and precision in demanding production environments. This sector's reliance on real-time data collection for inventory management, quality control, and predictive maintenance makes rugged PDAs indispensable. The increasing automation and adoption of Industry 4.0 technologies further amplify this demand. Within this segment, Android rugged PDAs are experiencing significant market share growth due to their adaptability and the extensive app ecosystem. Geographically, North America is a leading region, propelled by advanced technological adoption, robust manufacturing infrastructure, and stringent safety regulations that necessitate durable mobile solutions. The United States specifically, with its significant industrial base and investments in supply chain modernization, plays a crucial role. The Logistics/Transport segment also exhibits strong growth, with companies like Bluebird and CIPHERLAB heavily invested in providing solutions for warehouse management, fleet tracking, and last-mile delivery. Economic policies encouraging infrastructure development and streamlined supply chains further bolster demand. The Government sector, encompassing defense, public safety, and field service operations, represents a substantial and consistent market, with stringent reliability and security requirements favoring specialized rugged devices from manufacturers like BARTEC and Honeywell International.
- Dominant Segment: Industrial / Manufacturing – requiring high durability for data capture in production lines and hazardous conditions.
- Leading Region: North America – characterized by advanced technological integration and stringent safety standards.
- Key Country: United States – strong industrial base and supply chain modernization efforts.
- Growth Drivers in Industrial/Manufacturing: Industry 4.0 adoption, automation, real-time data analytics, and worker safety.
- Growth Drivers in Logistics/Transport: E-commerce boom, need for efficient supply chain management, and real-time tracking.
- Growth Drivers in Government: Defense applications, public safety, and field operations demanding ruggedness and reliability.
- Android's Ascendancy: Flexibility, cost-effectiveness, and extensive app support driving adoption across segments.
Rugged PDAs Product Landscape
The rugged PDAs product landscape is characterized by continuous innovation focused on enhancing durability, performance, and user experience. Manufacturers like Handheld Group and Janam Technologies are introducing devices with advanced scanning engines, longer-lasting batteries, and brighter, more responsive touchscreens suitable for outdoor and low-light conditions. Integration of the latest Android and Windows operating systems ensures compatibility with a wide range of enterprise software. Key product innovations include integrated RFID readers, high-resolution cameras for inspection tasks, and robust connectivity options like 5G and Wi-Fi 6 for seamless data transfer. Performance metrics are consistently improving, with faster processors, increased memory, and ruggedized components designed to withstand drops, dust, and water ingress (IP ratings). Unique selling propositions often revolve around MIL-STD-810G/H certifications, extended temperature ranges, and specialized accessories for specific industry needs.
Key Drivers, Barriers & Challenges in Rugged PDAs
Key Drivers:
- Industry 4.0 and Digital Transformation: The widespread adoption of smart manufacturing, IoT, and AI necessitates reliable data collection in harsh industrial settings.
- Growth of E-commerce and Logistics: Increased demand for efficient supply chain management and last-mile delivery solutions.
- Worker Safety and Productivity: Governments and industries are increasingly prioritizing worker safety, leading to the adoption of rugged devices that reduce errors and improve efficiency.
- Technological Advancements: Integration of 5G, enhanced scanning technologies, and improved battery life.
- Need for Durability and Reliability: Industries with extreme operating conditions require devices that can withstand drops, dust, water, and extreme temperatures.
Barriers & Challenges:
- High Initial Cost: Rugged PDAs often have a higher upfront cost compared to consumer-grade devices, impacting adoption for smaller businesses.
- Technological Obsolescence: Rapid advancements in technology can lead to shorter product lifecycles, requiring frequent upgrades.
- Supply Chain Disruptions: Global supply chain issues can impact the availability of components and lead to extended lead times.
- Integration Complexity: Integrating new rugged PDA systems with existing legacy IT infrastructure can be challenging and time-consuming.
- Competition from Consumer Devices: The increasing ruggedness of consumer-grade devices, coupled with lower prices, poses a competitive threat.
Emerging Opportunities in Rugged PDAs
Emerging opportunities in the rugged PDAs sector lie in the expansion of Internet of Things (IoT) integration, allowing devices to act as data collection hubs for a wider network of sensors and machinery. The increasing demand for specialized devices in sectors like agriculture technology (AgTech), renewable energy field services, and intelligent transportation systems presents untapped markets. Furthermore, the development of more intuitive user interfaces and enhanced augmented reality (AR) capabilities for field technicians and maintenance personnel offers significant growth potential. The ongoing shift towards cloud-based solutions also opens avenues for integrated software and hardware offerings, providing end-to-end mobile workforce management solutions.
Growth Accelerators in the Rugged PDAs Industry
Catalysts driving long-term growth in the rugged PDAs industry include relentless technological innovation, particularly in battery technology for extended operational uptime and miniaturization of components for sleeker designs. Strategic partnerships between hardware manufacturers and software developers are creating more comprehensive and industry-specific solutions. Furthermore, the growing global emphasis on operational efficiency and data-driven decision-making across all sectors is a continuous growth accelerator, pushing businesses to invest in reliable mobile computing solutions. Expansion into developing economies with burgeoning industrial and logistical sectors also presents significant growth potential.
Key Players Shaping the Rugged PDAs Market
- BARTEC
- Bluebird
- CIPHERLAB
- Datalogic
- Handheld Group
- Honeywell International
- Janam Technologies
- Unitech Electronics
- Zebra Technologies
- Getac Technology
- Leonardo DRS
- Panasonic
- XPLORE
- Aeroqual
- Crowcon Detection Instruments
- E Instruments International
- Fieldpiece Instruments
- FLUKE
- PCE
- Testo
- TSI
Notable Milestones in Rugged PDAs Sector
- 2019: Introduction of 5G capabilities in select rugged PDAs, enhancing real-time data transmission.
- 2020: Increased adoption of Android as the preferred OS for rugged devices, signaling a shift from Windows CE/Mobile.
- 2021: Growing emphasis on integrated RFID and advanced barcode scanning technologies for warehouse and inventory management.
- 2022: Focus on enhanced cybersecurity features and data protection in rugged PDA designs for government and defense applications.
- 2023: Innovations in battery technology leading to significantly longer operating times, reducing downtime for field workers.
- 2024: Increased demand for rugged tablets with AR capabilities to assist in complex maintenance and repair tasks.
In-Depth Rugged PDAs Market Outlook
The future outlook for the rugged PDAs market remains exceptionally strong, driven by the sustained digital transformation across critical industries and the unwavering need for reliable, high-performance mobile computing solutions. Growth accelerators, including the integration of advanced IoT capabilities, the expansion into new application verticals like smart agriculture, and the continuous pursuit of enhanced user experience through intuitive interfaces and AR support, will propel market expansion. Strategic collaborations between hardware manufacturers and software providers will continue to foster the development of comprehensive, end-to-end solutions, addressing the evolving demands of the mobile workforce. The ongoing investment in infrastructure and technology in emerging economies also presents a significant opportunity for market penetration, solidifying the rugged PDAs sector's position as a vital component of modern enterprise operations.
Rugged PDAs Segmentation
-
1. Application
- 1.1. Industrial / Manufacturing
- 1.2. Logistics/Transport
- 1.3. Government
- 1.4. Retail
- 1.5. Other
-
2. Types
- 2.1. Android
- 2.2. Windows
Rugged PDAs Segmentation By Geography
-
1. North America
- 1.1. United States
- 1.2. Canada
- 1.3. Mexico
-
2. South America
- 2.1. Brazil
- 2.2. Argentina
- 2.3. Rest of South America
-
3. Europe
- 3.1. United Kingdom
- 3.2. Germany
- 3.3. France
- 3.4. Italy
- 3.5. Spain
- 3.6. Russia
- 3.7. Benelux
- 3.8. Nordics
- 3.9. Rest of Europe
-
4. Middle East & Africa
- 4.1. Turkey
- 4.2. Israel
- 4.3. GCC
- 4.4. North Africa
- 4.5. South Africa
- 4.6. Rest of Middle East & Africa
-
5. Asia Pacific
- 5.1. China
- 5.2. India
- 5.3. Japan
- 5.4. South Korea
- 5.5. ASEAN
- 5.6. Oceania
- 5.7. Rest of Asia Pacific
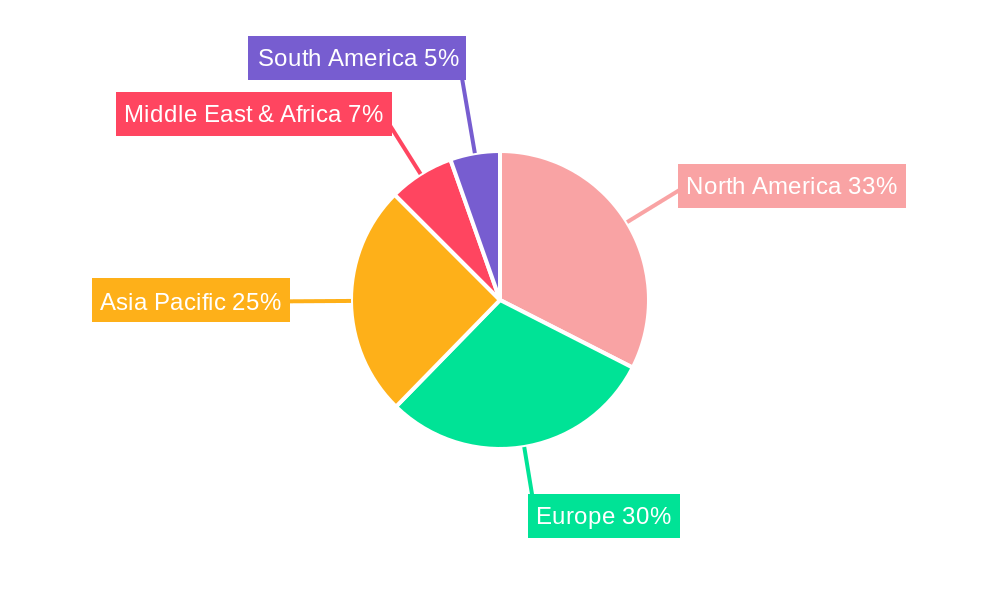
Rugged PDAs Regional Market Share
Geographic Coverage of Rugged PDAs
Rugged PDAs REPORT HIGHLIGHTS
| Aspects | Details |
|---|---|
| Study Period | 2020-2034 |
| Base Year | 2025 |
| Estimated Year | 2026 |
| Forecast Period | 2026-2034 |
| Historical Period | 2020-2025 |
| Growth Rate | CAGR of 4.8% from 2020-2034 |
| Segmentation |
|
Table of Contents
- 1. Introduction
- 1.1. Research Scope
- 1.2. Market Segmentation
- 1.3. Research Methodology
- 1.4. Definitions and Assumptions
- 2. Executive Summary
- 2.1. Introduction
- 3. Market Dynamics
- 3.1. Introduction
- 3.2. Market Drivers
- 3.3. Market Restrains
- 3.4. Market Trends
- 4. Market Factor Analysis
- 4.1. Porters Five Forces
- 4.2. Supply/Value Chain
- 4.3. PESTEL analysis
- 4.4. Market Entropy
- 4.5. Patent/Trademark Analysis
- 5. Global Rugged PDAs Analysis, Insights and Forecast, 2020-2032
- 5.1. Market Analysis, Insights and Forecast - by Application
- 5.1.1. Industrial / Manufacturing
- 5.1.2. Logistics/Transport
- 5.1.3. Government
- 5.1.4. Retail
- 5.1.5. Other
- 5.2. Market Analysis, Insights and Forecast - by Types
- 5.2.1. Android
- 5.2.2. Windows
- 5.3. Market Analysis, Insights and Forecast - by Region
- 5.3.1. North America
- 5.3.2. South America
- 5.3.3. Europe
- 5.3.4. Middle East & Africa
- 5.3.5. Asia Pacific
- 5.1. Market Analysis, Insights and Forecast - by Application
- 6. North America Rugged PDAs Analysis, Insights and Forecast, 2020-2032
- 6.1. Market Analysis, Insights and Forecast - by Application
- 6.1.1. Industrial / Manufacturing
- 6.1.2. Logistics/Transport
- 6.1.3. Government
- 6.1.4. Retail
- 6.1.5. Other
- 6.2. Market Analysis, Insights and Forecast - by Types
- 6.2.1. Android
- 6.2.2. Windows
- 6.1. Market Analysis, Insights and Forecast - by Application
- 7. South America Rugged PDAs Analysis, Insights and Forecast, 2020-2032
- 7.1. Market Analysis, Insights and Forecast - by Application
- 7.1.1. Industrial / Manufacturing
- 7.1.2. Logistics/Transport
- 7.1.3. Government
- 7.1.4. Retail
- 7.1.5. Other
- 7.2. Market Analysis, Insights and Forecast - by Types
- 7.2.1. Android
- 7.2.2. Windows
- 7.1. Market Analysis, Insights and Forecast - by Application
- 8. Europe Rugged PDAs Analysis, Insights and Forecast, 2020-2032
- 8.1. Market Analysis, Insights and Forecast - by Application
- 8.1.1. Industrial / Manufacturing
- 8.1.2. Logistics/Transport
- 8.1.3. Government
- 8.1.4. Retail
- 8.1.5. Other
- 8.2. Market Analysis, Insights and Forecast - by Types
- 8.2.1. Android
- 8.2.2. Windows
- 8.1. Market Analysis, Insights and Forecast - by Application
- 9. Middle East & Africa Rugged PDAs Analysis, Insights and Forecast, 2020-2032
- 9.1. Market Analysis, Insights and Forecast - by Application
- 9.1.1. Industrial / Manufacturing
- 9.1.2. Logistics/Transport
- 9.1.3. Government
- 9.1.4. Retail
- 9.1.5. Other
- 9.2. Market Analysis, Insights and Forecast - by Types
- 9.2.1. Android
- 9.2.2. Windows
- 9.1. Market Analysis, Insights and Forecast - by Application
- 10. Asia Pacific Rugged PDAs Analysis, Insights and Forecast, 2020-2032
- 10.1. Market Analysis, Insights and Forecast - by Application
- 10.1.1. Industrial / Manufacturing
- 10.1.2. Logistics/Transport
- 10.1.3. Government
- 10.1.4. Retail
- 10.1.5. Other
- 10.2. Market Analysis, Insights and Forecast - by Types
- 10.2.1. Android
- 10.2.2. Windows
- 10.1. Market Analysis, Insights and Forecast - by Application
- 11. Competitive Analysis
- 11.1. Global Market Share Analysis 2025
- 11.2. Company Profiles
- 11.2.1 BARTEC
- 11.2.1.1. Overview
- 11.2.1.2. Products
- 11.2.1.3. SWOT Analysis
- 11.2.1.4. Recent Developments
- 11.2.1.5. Financials (Based on Availability)
- 11.2.2 Bluebird
- 11.2.2.1. Overview
- 11.2.2.2. Products
- 11.2.2.3. SWOT Analysis
- 11.2.2.4. Recent Developments
- 11.2.2.5. Financials (Based on Availability)
- 11.2.3 CIPHERLAB
- 11.2.3.1. Overview
- 11.2.3.2. Products
- 11.2.3.3. SWOT Analysis
- 11.2.3.4. Recent Developments
- 11.2.3.5. Financials (Based on Availability)
- 11.2.4 Datalogic
- 11.2.4.1. Overview
- 11.2.4.2. Products
- 11.2.4.3. SWOT Analysis
- 11.2.4.4. Recent Developments
- 11.2.4.5. Financials (Based on Availability)
- 11.2.5 Handheld Group
- 11.2.5.1. Overview
- 11.2.5.2. Products
- 11.2.5.3. SWOT Analysis
- 11.2.5.4. Recent Developments
- 11.2.5.5. Financials (Based on Availability)
- 11.2.6 Honeywell International
- 11.2.6.1. Overview
- 11.2.6.2. Products
- 11.2.6.3. SWOT Analysis
- 11.2.6.4. Recent Developments
- 11.2.6.5. Financials (Based on Availability)
- 11.2.7 Janam Technologies
- 11.2.7.1. Overview
- 11.2.7.2. Products
- 11.2.7.3. SWOT Analysis
- 11.2.7.4. Recent Developments
- 11.2.7.5. Financials (Based on Availability)
- 11.2.8 Unitech Electronics
- 11.2.8.1. Overview
- 11.2.8.2. Products
- 11.2.8.3. SWOT Analysis
- 11.2.8.4. Recent Developments
- 11.2.8.5. Financials (Based on Availability)
- 11.2.9 Zebra Technologies
- 11.2.9.1. Overview
- 11.2.9.2. Products
- 11.2.9.3. SWOT Analysis
- 11.2.9.4. Recent Developments
- 11.2.9.5. Financials (Based on Availability)
- 11.2.10 Getac Technology
- 11.2.10.1. Overview
- 11.2.10.2. Products
- 11.2.10.3. SWOT Analysis
- 11.2.10.4. Recent Developments
- 11.2.10.5. Financials (Based on Availability)
- 11.2.11 Handheld Group
- 11.2.11.1. Overview
- 11.2.11.2. Products
- 11.2.11.3. SWOT Analysis
- 11.2.11.4. Recent Developments
- 11.2.11.5. Financials (Based on Availability)
- 11.2.12 Leonardo DRS
- 11.2.12.1. Overview
- 11.2.12.2. Products
- 11.2.12.3. SWOT Analysis
- 11.2.12.4. Recent Developments
- 11.2.12.5. Financials (Based on Availability)
- 11.2.13 Panasonic
- 11.2.13.1. Overview
- 11.2.13.2. Products
- 11.2.13.3. SWOT Analysis
- 11.2.13.4. Recent Developments
- 11.2.13.5. Financials (Based on Availability)
- 11.2.14 XPLORE
- 11.2.14.1. Overview
- 11.2.14.2. Products
- 11.2.14.3. SWOT Analysis
- 11.2.14.4. Recent Developments
- 11.2.14.5. Financials (Based on Availability)
- 11.2.15 Datalogic
- 11.2.15.1. Overview
- 11.2.15.2. Products
- 11.2.15.3. SWOT Analysis
- 11.2.15.4. Recent Developments
- 11.2.15.5. Financials (Based on Availability)
- 11.2.16 Aeroqual
- 11.2.16.1. Overview
- 11.2.16.2. Products
- 11.2.16.3. SWOT Analysis
- 11.2.16.4. Recent Developments
- 11.2.16.5. Financials (Based on Availability)
- 11.2.17 Crowcon Detection Instruments
- 11.2.17.1. Overview
- 11.2.17.2. Products
- 11.2.17.3. SWOT Analysis
- 11.2.17.4. Recent Developments
- 11.2.17.5. Financials (Based on Availability)
- 11.2.18 E Instruments International
- 11.2.18.1. Overview
- 11.2.18.2. Products
- 11.2.18.3. SWOT Analysis
- 11.2.18.4. Recent Developments
- 11.2.18.5. Financials (Based on Availability)
- 11.2.19 Fieldpiece Instruments
- 11.2.19.1. Overview
- 11.2.19.2. Products
- 11.2.19.3. SWOT Analysis
- 11.2.19.4. Recent Developments
- 11.2.19.5. Financials (Based on Availability)
- 11.2.20 FLUKE
- 11.2.20.1. Overview
- 11.2.20.2. Products
- 11.2.20.3. SWOT Analysis
- 11.2.20.4. Recent Developments
- 11.2.20.5. Financials (Based on Availability)
- 11.2.21 PCE
- 11.2.21.1. Overview
- 11.2.21.2. Products
- 11.2.21.3. SWOT Analysis
- 11.2.21.4. Recent Developments
- 11.2.21.5. Financials (Based on Availability)
- 11.2.22 Testo
- 11.2.22.1. Overview
- 11.2.22.2. Products
- 11.2.22.3. SWOT Analysis
- 11.2.22.4. Recent Developments
- 11.2.22.5. Financials (Based on Availability)
- 11.2.23 TSI
- 11.2.23.1. Overview
- 11.2.23.2. Products
- 11.2.23.3. SWOT Analysis
- 11.2.23.4. Recent Developments
- 11.2.23.5. Financials (Based on Availability)
- 11.2.1 BARTEC
List of Figures
- Figure 1: Global Rugged PDAs Revenue Breakdown (billion, %) by Region 2025 & 2033
- Figure 2: Global Rugged PDAs Volume Breakdown (K, %) by Region 2025 & 2033
- Figure 3: North America Rugged PDAs Revenue (billion), by Application 2025 & 2033
- Figure 4: North America Rugged PDAs Volume (K), by Application 2025 & 2033
- Figure 5: North America Rugged PDAs Revenue Share (%), by Application 2025 & 2033
- Figure 6: North America Rugged PDAs Volume Share (%), by Application 2025 & 2033
- Figure 7: North America Rugged PDAs Revenue (billion), by Types 2025 & 2033
- Figure 8: North America Rugged PDAs Volume (K), by Types 2025 & 2033
- Figure 9: North America Rugged PDAs Revenue Share (%), by Types 2025 & 2033
- Figure 10: North America Rugged PDAs Volume Share (%), by Types 2025 & 2033
- Figure 11: North America Rugged PDAs Revenue (billion), by Country 2025 & 2033
- Figure 12: North America Rugged PDAs Volume (K), by Country 2025 & 2033
- Figure 13: North America Rugged PDAs Revenue Share (%), by Country 2025 & 2033
- Figure 14: North America Rugged PDAs Volume Share (%), by Country 2025 & 2033
- Figure 15: South America Rugged PDAs Revenue (billion), by Application 2025 & 2033
- Figure 16: South America Rugged PDAs Volume (K), by Application 2025 & 2033
- Figure 17: South America Rugged PDAs Revenue Share (%), by Application 2025 & 2033
- Figure 18: South America Rugged PDAs Volume Share (%), by Application 2025 & 2033
- Figure 19: South America Rugged PDAs Revenue (billion), by Types 2025 & 2033
- Figure 20: South America Rugged PDAs Volume (K), by Types 2025 & 2033
- Figure 21: South America Rugged PDAs Revenue Share (%), by Types 2025 & 2033
- Figure 22: South America Rugged PDAs Volume Share (%), by Types 2025 & 2033
- Figure 23: South America Rugged PDAs Revenue (billion), by Country 2025 & 2033
- Figure 24: South America Rugged PDAs Volume (K), by Country 2025 & 2033
- Figure 25: South America Rugged PDAs Revenue Share (%), by Country 2025 & 2033
- Figure 26: South America Rugged PDAs Volume Share (%), by Country 2025 & 2033
- Figure 27: Europe Rugged PDAs Revenue (billion), by Application 2025 & 2033
- Figure 28: Europe Rugged PDAs Volume (K), by Application 2025 & 2033
- Figure 29: Europe Rugged PDAs Revenue Share (%), by Application 2025 & 2033
- Figure 30: Europe Rugged PDAs Volume Share (%), by Application 2025 & 2033
- Figure 31: Europe Rugged PDAs Revenue (billion), by Types 2025 & 2033
- Figure 32: Europe Rugged PDAs Volume (K), by Types 2025 & 2033
- Figure 33: Europe Rugged PDAs Revenue Share (%), by Types 2025 & 2033
- Figure 34: Europe Rugged PDAs Volume Share (%), by Types 2025 & 2033
- Figure 35: Europe Rugged PDAs Revenue (billion), by Country 2025 & 2033
- Figure 36: Europe Rugged PDAs Volume (K), by Country 2025 & 2033
- Figure 37: Europe Rugged PDAs Revenue Share (%), by Country 2025 & 2033
- Figure 38: Europe Rugged PDAs Volume Share (%), by Country 2025 & 2033
- Figure 39: Middle East & Africa Rugged PDAs Revenue (billion), by Application 2025 & 2033
- Figure 40: Middle East & Africa Rugged PDAs Volume (K), by Application 2025 & 2033
- Figure 41: Middle East & Africa Rugged PDAs Revenue Share (%), by Application 2025 & 2033
- Figure 42: Middle East & Africa Rugged PDAs Volume Share (%), by Application 2025 & 2033
- Figure 43: Middle East & Africa Rugged PDAs Revenue (billion), by Types 2025 & 2033
- Figure 44: Middle East & Africa Rugged PDAs Volume (K), by Types 2025 & 2033
- Figure 45: Middle East & Africa Rugged PDAs Revenue Share (%), by Types 2025 & 2033
- Figure 46: Middle East & Africa Rugged PDAs Volume Share (%), by Types 2025 & 2033
- Figure 47: Middle East & Africa Rugged PDAs Revenue (billion), by Country 2025 & 2033
- Figure 48: Middle East & Africa Rugged PDAs Volume (K), by Country 2025 & 2033
- Figure 49: Middle East & Africa Rugged PDAs Revenue Share (%), by Country 2025 & 2033
- Figure 50: Middle East & Africa Rugged PDAs Volume Share (%), by Country 2025 & 2033
- Figure 51: Asia Pacific Rugged PDAs Revenue (billion), by Application 2025 & 2033
- Figure 52: Asia Pacific Rugged PDAs Volume (K), by Application 2025 & 2033
- Figure 53: Asia Pacific Rugged PDAs Revenue Share (%), by Application 2025 & 2033
- Figure 54: Asia Pacific Rugged PDAs Volume Share (%), by Application 2025 & 2033
- Figure 55: Asia Pacific Rugged PDAs Revenue (billion), by Types 2025 & 2033
- Figure 56: Asia Pacific Rugged PDAs Volume (K), by Types 2025 & 2033
- Figure 57: Asia Pacific Rugged PDAs Revenue Share (%), by Types 2025 & 2033
- Figure 58: Asia Pacific Rugged PDAs Volume Share (%), by Types 2025 & 2033
- Figure 59: Asia Pacific Rugged PDAs Revenue (billion), by Country 2025 & 2033
- Figure 60: Asia Pacific Rugged PDAs Volume (K), by Country 2025 & 2033
- Figure 61: Asia Pacific Rugged PDAs Revenue Share (%), by Country 2025 & 2033
- Figure 62: Asia Pacific Rugged PDAs Volume Share (%), by Country 2025 & 2033
List of Tables
- Table 1: Global Rugged PDAs Revenue billion Forecast, by Application 2020 & 2033
- Table 2: Global Rugged PDAs Volume K Forecast, by Application 2020 & 2033
- Table 3: Global Rugged PDAs Revenue billion Forecast, by Types 2020 & 2033
- Table 4: Global Rugged PDAs Volume K Forecast, by Types 2020 & 2033
- Table 5: Global Rugged PDAs Revenue billion Forecast, by Region 2020 & 2033
- Table 6: Global Rugged PDAs Volume K Forecast, by Region 2020 & 2033
- Table 7: Global Rugged PDAs Revenue billion Forecast, by Application 2020 & 2033
- Table 8: Global Rugged PDAs Volume K Forecast, by Application 2020 & 2033
- Table 9: Global Rugged PDAs Revenue billion Forecast, by Types 2020 & 2033
- Table 10: Global Rugged PDAs Volume K Forecast, by Types 2020 & 2033
- Table 11: Global Rugged PDAs Revenue billion Forecast, by Country 2020 & 2033
- Table 12: Global Rugged PDAs Volume K Forecast, by Country 2020 & 2033
- Table 13: United States Rugged PDAs Revenue (billion) Forecast, by Application 2020 & 2033
- Table 14: United States Rugged PDAs Volume (K) Forecast, by Application 2020 & 2033
- Table 15: Canada Rugged PDAs Revenue (billion) Forecast, by Application 2020 & 2033
- Table 16: Canada Rugged PDAs Volume (K) Forecast, by Application 2020 & 2033
- Table 17: Mexico Rugged PDAs Revenue (billion) Forecast, by Application 2020 & 2033
- Table 18: Mexico Rugged PDAs Volume (K) Forecast, by Application 2020 & 2033
- Table 19: Global Rugged PDAs Revenue billion Forecast, by Application 2020 & 2033
- Table 20: Global Rugged PDAs Volume K Forecast, by Application 2020 & 2033
- Table 21: Global Rugged PDAs Revenue billion Forecast, by Types 2020 & 2033
- Table 22: Global Rugged PDAs Volume K Forecast, by Types 2020 & 2033
- Table 23: Global Rugged PDAs Revenue billion Forecast, by Country 2020 & 2033
- Table 24: Global Rugged PDAs Volume K Forecast, by Country 2020 & 2033
- Table 25: Brazil Rugged PDAs Revenue (billion) Forecast, by Application 2020 & 2033
- Table 26: Brazil Rugged PDAs Volume (K) Forecast, by Application 2020 & 2033
- Table 27: Argentina Rugged PDAs Revenue (billion) Forecast, by Application 2020 & 2033
- Table 28: Argentina Rugged PDAs Volume (K) Forecast, by Application 2020 & 2033
- Table 29: Rest of South America Rugged PDAs Revenue (billion) Forecast, by Application 2020 & 2033
- Table 30: Rest of South America Rugged PDAs Volume (K) Forecast, by Application 2020 & 2033
- Table 31: Global Rugged PDAs Revenue billion Forecast, by Application 2020 & 2033
- Table 32: Global Rugged PDAs Volume K Forecast, by Application 2020 & 2033
- Table 33: Global Rugged PDAs Revenue billion Forecast, by Types 2020 & 2033
- Table 34: Global Rugged PDAs Volume K Forecast, by Types 2020 & 2033
- Table 35: Global Rugged PDAs Revenue billion Forecast, by Country 2020 & 2033
- Table 36: Global Rugged PDAs Volume K Forecast, by Country 2020 & 2033
- Table 37: United Kingdom Rugged PDAs Revenue (billion) Forecast, by Application 2020 & 2033
- Table 38: United Kingdom Rugged PDAs Volume (K) Forecast, by Application 2020 & 2033
- Table 39: Germany Rugged PDAs Revenue (billion) Forecast, by Application 2020 & 2033
- Table 40: Germany Rugged PDAs Volume (K) Forecast, by Application 2020 & 2033
- Table 41: France Rugged PDAs Revenue (billion) Forecast, by Application 2020 & 2033
- Table 42: France Rugged PDAs Volume (K) Forecast, by Application 2020 & 2033
- Table 43: Italy Rugged PDAs Revenue (billion) Forecast, by Application 2020 & 2033
- Table 44: Italy Rugged PDAs Volume (K) Forecast, by Application 2020 & 2033
- Table 45: Spain Rugged PDAs Revenue (billion) Forecast, by Application 2020 & 2033
- Table 46: Spain Rugged PDAs Volume (K) Forecast, by Application 2020 & 2033
- Table 47: Russia Rugged PDAs Revenue (billion) Forecast, by Application 2020 & 2033
- Table 48: Russia Rugged PDAs Volume (K) Forecast, by Application 2020 & 2033
- Table 49: Benelux Rugged PDAs Revenue (billion) Forecast, by Application 2020 & 2033
- Table 50: Benelux Rugged PDAs Volume (K) Forecast, by Application 2020 & 2033
- Table 51: Nordics Rugged PDAs Revenue (billion) Forecast, by Application 2020 & 2033
- Table 52: Nordics Rugged PDAs Volume (K) Forecast, by Application 2020 & 2033
- Table 53: Rest of Europe Rugged PDAs Revenue (billion) Forecast, by Application 2020 & 2033
- Table 54: Rest of Europe Rugged PDAs Volume (K) Forecast, by Application 2020 & 2033
- Table 55: Global Rugged PDAs Revenue billion Forecast, by Application 2020 & 2033
- Table 56: Global Rugged PDAs Volume K Forecast, by Application 2020 & 2033
- Table 57: Global Rugged PDAs Revenue billion Forecast, by Types 2020 & 2033
- Table 58: Global Rugged PDAs Volume K Forecast, by Types 2020 & 2033
- Table 59: Global Rugged PDAs Revenue billion Forecast, by Country 2020 & 2033
- Table 60: Global Rugged PDAs Volume K Forecast, by Country 2020 & 2033
- Table 61: Turkey Rugged PDAs Revenue (billion) Forecast, by Application 2020 & 2033
- Table 62: Turkey Rugged PDAs Volume (K) Forecast, by Application 2020 & 2033
- Table 63: Israel Rugged PDAs Revenue (billion) Forecast, by Application 2020 & 2033
- Table 64: Israel Rugged PDAs Volume (K) Forecast, by Application 2020 & 2033
- Table 65: GCC Rugged PDAs Revenue (billion) Forecast, by Application 2020 & 2033
- Table 66: GCC Rugged PDAs Volume (K) Forecast, by Application 2020 & 2033
- Table 67: North Africa Rugged PDAs Revenue (billion) Forecast, by Application 2020 & 2033
- Table 68: North Africa Rugged PDAs Volume (K) Forecast, by Application 2020 & 2033
- Table 69: South Africa Rugged PDAs Revenue (billion) Forecast, by Application 2020 & 2033
- Table 70: South Africa Rugged PDAs Volume (K) Forecast, by Application 2020 & 2033
- Table 71: Rest of Middle East & Africa Rugged PDAs Revenue (billion) Forecast, by Application 2020 & 2033
- Table 72: Rest of Middle East & Africa Rugged PDAs Volume (K) Forecast, by Application 2020 & 2033
- Table 73: Global Rugged PDAs Revenue billion Forecast, by Application 2020 & 2033
- Table 74: Global Rugged PDAs Volume K Forecast, by Application 2020 & 2033
- Table 75: Global Rugged PDAs Revenue billion Forecast, by Types 2020 & 2033
- Table 76: Global Rugged PDAs Volume K Forecast, by Types 2020 & 2033
- Table 77: Global Rugged PDAs Revenue billion Forecast, by Country 2020 & 2033
- Table 78: Global Rugged PDAs Volume K Forecast, by Country 2020 & 2033
- Table 79: China Rugged PDAs Revenue (billion) Forecast, by Application 2020 & 2033
- Table 80: China Rugged PDAs Volume (K) Forecast, by Application 2020 & 2033
- Table 81: India Rugged PDAs Revenue (billion) Forecast, by Application 2020 & 2033
- Table 82: India Rugged PDAs Volume (K) Forecast, by Application 2020 & 2033
- Table 83: Japan Rugged PDAs Revenue (billion) Forecast, by Application 2020 & 2033
- Table 84: Japan Rugged PDAs Volume (K) Forecast, by Application 2020 & 2033
- Table 85: South Korea Rugged PDAs Revenue (billion) Forecast, by Application 2020 & 2033
- Table 86: South Korea Rugged PDAs Volume (K) Forecast, by Application 2020 & 2033
- Table 87: ASEAN Rugged PDAs Revenue (billion) Forecast, by Application 2020 & 2033
- Table 88: ASEAN Rugged PDAs Volume (K) Forecast, by Application 2020 & 2033
- Table 89: Oceania Rugged PDAs Revenue (billion) Forecast, by Application 2020 & 2033
- Table 90: Oceania Rugged PDAs Volume (K) Forecast, by Application 2020 & 2033
- Table 91: Rest of Asia Pacific Rugged PDAs Revenue (billion) Forecast, by Application 2020 & 2033
- Table 92: Rest of Asia Pacific Rugged PDAs Volume (K) Forecast, by Application 2020 & 2033
Frequently Asked Questions
1. What is the projected Compound Annual Growth Rate (CAGR) of the Rugged PDAs?
The projected CAGR is approximately 4.8%.
2. Which companies are prominent players in the Rugged PDAs?
Key companies in the market include BARTEC, Bluebird, CIPHERLAB, Datalogic, Handheld Group, Honeywell International, Janam Technologies, Unitech Electronics, Zebra Technologies, Getac Technology, Handheld Group, Leonardo DRS, Panasonic, XPLORE, Datalogic, Aeroqual, Crowcon Detection Instruments, E Instruments International, Fieldpiece Instruments, FLUKE, PCE, Testo, TSI.
3. What are the main segments of the Rugged PDAs?
The market segments include Application, Types.
4. Can you provide details about the market size?
The market size is estimated to be USD 3.5 billion as of 2022.
5. What are some drivers contributing to market growth?
N/A
6. What are the notable trends driving market growth?
N/A
7. Are there any restraints impacting market growth?
N/A
8. Can you provide examples of recent developments in the market?
N/A
9. What pricing options are available for accessing the report?
Pricing options include single-user, multi-user, and enterprise licenses priced at USD 3350.00, USD 5025.00, and USD 6700.00 respectively.
10. Is the market size provided in terms of value or volume?
The market size is provided in terms of value, measured in billion and volume, measured in K.
11. Are there any specific market keywords associated with the report?
Yes, the market keyword associated with the report is "Rugged PDAs," which aids in identifying and referencing the specific market segment covered.
12. How do I determine which pricing option suits my needs best?
The pricing options vary based on user requirements and access needs. Individual users may opt for single-user licenses, while businesses requiring broader access may choose multi-user or enterprise licenses for cost-effective access to the report.
13. Are there any additional resources or data provided in the Rugged PDAs report?
While the report offers comprehensive insights, it's advisable to review the specific contents or supplementary materials provided to ascertain if additional resources or data are available.
14. How can I stay updated on further developments or reports in the Rugged PDAs?
To stay informed about further developments, trends, and reports in the Rugged PDAs, consider subscribing to industry newsletters, following relevant companies and organizations, or regularly checking reputable industry news sources and publications.
Methodology
Step 1 - Identification of Relevant Samples Size from Population Database


Step 2 - Approaches for Defining Global Market Size (Value, Volume* & Price*)

Note*: In applicable scenarios
Step 3 - Data Sources
Primary Research
- Web Analytics
- Survey Reports
- Research Institute
- Latest Research Reports
- Opinion Leaders
Secondary Research
- Annual Reports
- White Paper
- Latest Press Release
- Industry Association
- Paid Database
- Investor Presentations

Step 4 - Data Triangulation
Involves using different sources of information in order to increase the validity of a study
These sources are likely to be stakeholders in a program - participants, other researchers, program staff, other community members, and so on.
Then we put all data in single framework & apply various statistical tools to find out the dynamic on the market.
During the analysis stage, feedback from the stakeholder groups would be compared to determine areas of agreement as well as areas of divergence