

Key Insights
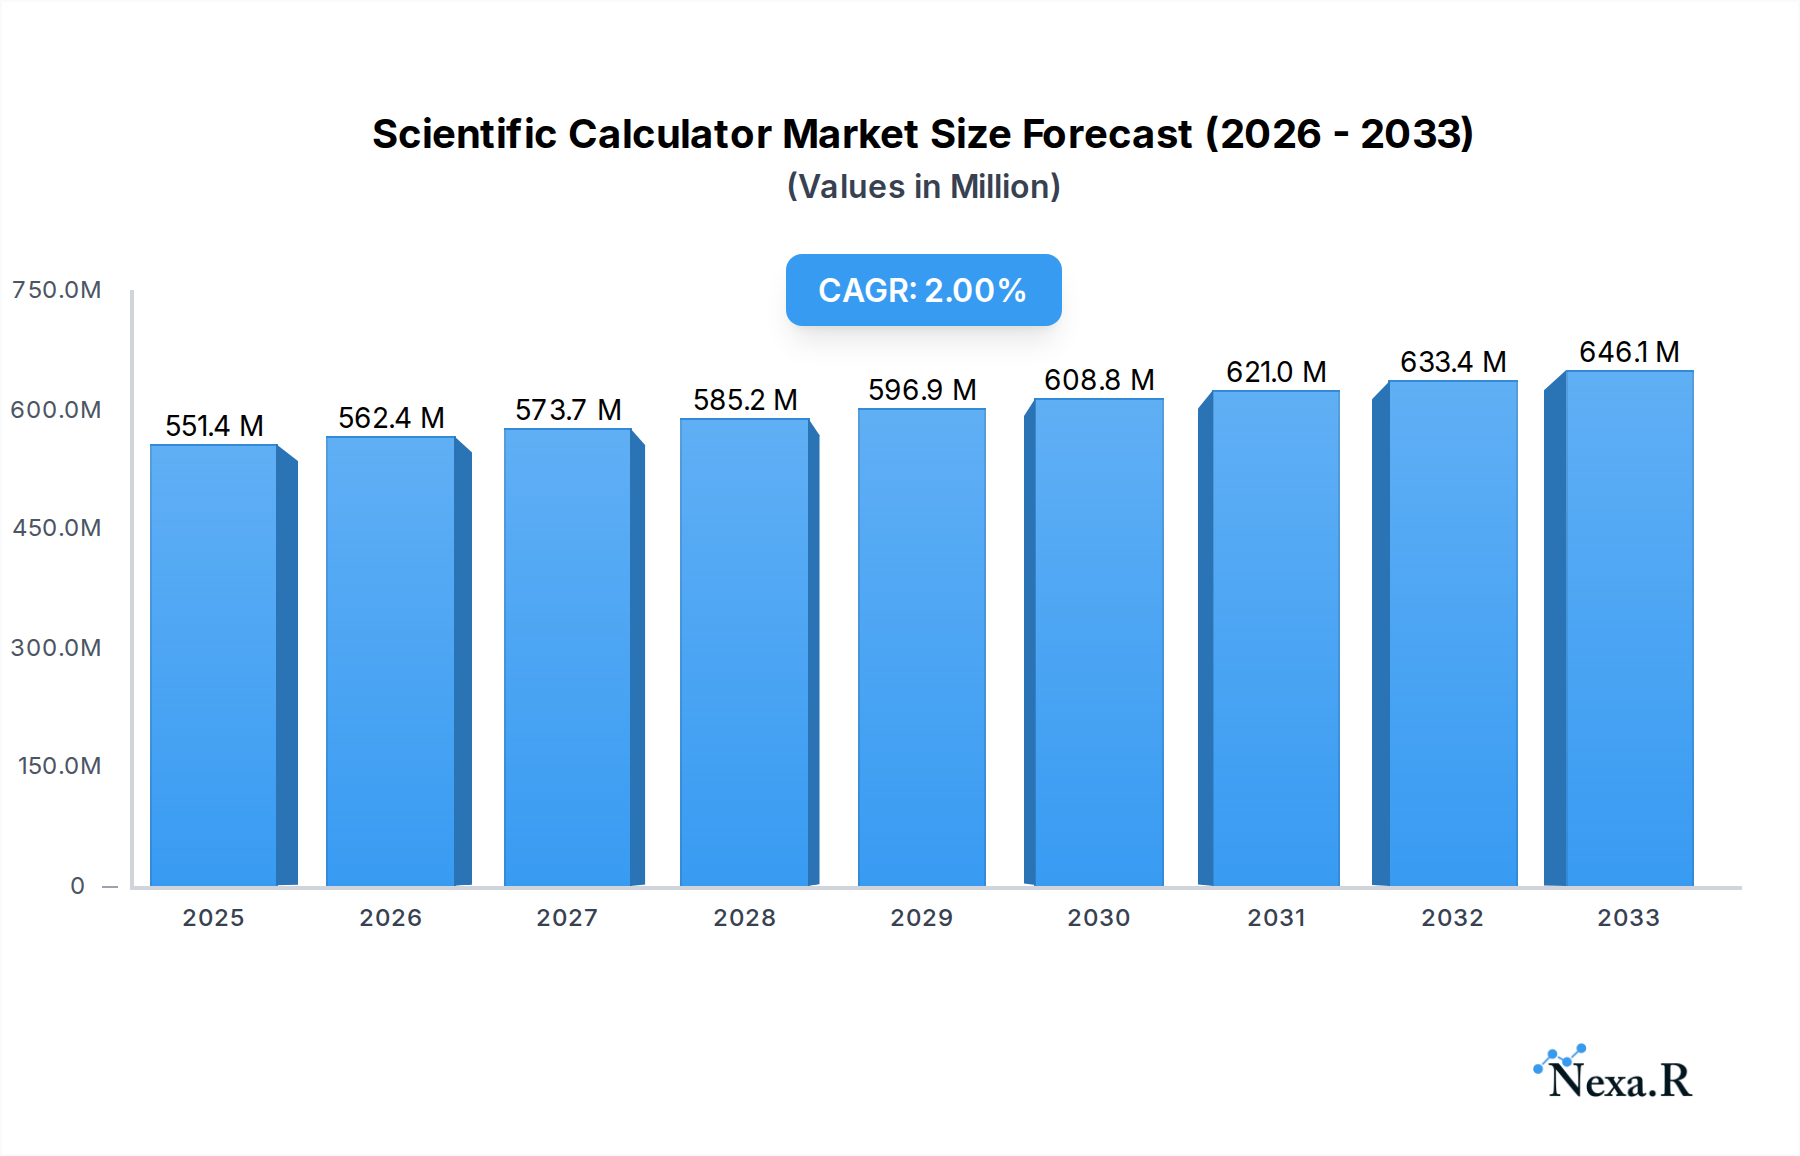
The scientific calculator market is projected to reach an estimated $551.41 million in 2025, exhibiting a steady growth rate with a Compound Annual Growth Rate (CAGR) of 2% during the forecast period of 2025-2033. This sustained expansion is primarily driven by the consistent demand from educational institutions and the professional sectors that rely on precise calculations. The Students and Exams segment continues to be a cornerstone of this market, fueled by ongoing enrollment in STEM fields and standardized testing requirements worldwide. Simultaneously, the Offices and Engineering segment is experiencing a gradual increase, supported by the widespread adoption of scientific calculators in research and development, architectural design, and various engineering disciplines. The evolution of technology, while introducing sophisticated alternatives, has also led to the development of more advanced and user-friendly scientific calculators, ensuring their continued relevance.

Scientific Calculator Market Size (In Million)
Looking ahead, the market is poised for stable but moderate growth, influenced by factors such as technological advancements in calculator design, the increasing emphasis on STEM education globally, and the persistent need for reliable and accessible calculating tools in professional environments. While digital alternatives exist, the portability, affordability, and focused functionality of scientific calculators ensure their enduring appeal. The market is segmented into Standard Scientific Calculators, Programmable Calculators, and Graphic Calculators, each catering to different levels of complexity and user needs. Leading companies like Casio, Texas Instruments, and Sharp continue to innovate, introducing models that balance performance with user experience, thereby solidifying their market positions and contributing to the overall upward trajectory of the scientific calculator industry. The global reach of this market is evident in its significant presence across North America, Europe, and the Asia Pacific region, with burgeoning opportunities in developing economies.
Scientific Calculator Company Market Share
Scientific Calculator Market: Comprehensive Analysis and Forecast 2019–2033
This in-depth report offers a detailed examination of the global scientific calculator market, providing critical insights for industry professionals, investors, and stakeholders. Spanning a study period from 2019 to 2033, with a base and estimated year of 2025, this analysis delves into market dynamics, growth trends, regional dominance, product landscape, and key strategic factors. We forecast significant market evolution, driven by technological advancements, educational needs, and professional applications. This report is meticulously crafted to be used without modification, ensuring immediate and actionable intelligence.
Scientific Calculator Market Dynamics & Structure
The scientific calculator market exhibits a moderately concentrated structure, with established players like Casio, Texas Instruments, and Sharp holding significant market share. Technological innovation serves as a primary driver, with continuous advancements in processing power, display capabilities, and programmability. Regulatory frameworks, particularly concerning educational standards and examination requirements, also influence product development and adoption. Competitive product substitutes include sophisticated graphing calculators, specialized engineering software, and even tablet-based applications, forcing manufacturers to differentiate through usability, portability, and specialized features. End-user demographics are broadly segmented into students and exams (parent market) and offices and engineering (child market), each with distinct needs and purchasing behaviors. Mergers and acquisition (M&A) trends, though not dominant, have played a role in market consolidation and strategic expansion, with an estimated XX deal volumes observed in the historical period. Innovation barriers include the high cost of research and development for advanced features and the challenge of rapid obsolescence in the face of evolving digital tools.
- Market Concentration: Moderately concentrated, with a few key players dominating.
- Technological Innovation Drivers: Increased processing power, advanced display technology, enhanced programmability, and user-friendly interfaces.
- Regulatory Frameworks: Influence from educational standards, examination board approvals, and STEM curriculum integration.
- Competitive Product Substitutes: Graphing calculators, engineering software, tablet apps, and mobile calculator applications.
- End-User Demographics: Primarily students (academic use) and professionals in engineering, science, and technical fields.
- M&A Trends: Limited but strategic, focused on market share expansion and technological integration.
- Innovation Barriers: High R&D costs, short product life cycles, and the need for robust and reliable performance.
Scientific Calculator Growth Trends & Insights
The global scientific calculator market is projected for robust growth, exhibiting a Compound Annual Growth Rate (CAGR) of approximately 4.5% from 2019 to 2033. The market size, valued at an estimated $850 million in 2019, is anticipated to reach approximately $1,350 million by 2025 and further expand to an estimated $1,800 million by the end of the forecast period in 2033. Adoption rates remain high within educational institutions, driven by the persistent need for reliable and distraction-free calculation tools in classrooms and standardized tests. Technological disruptions are characterized by the integration of cloud connectivity for data syncing, improved battery life, and more intuitive menu navigation. Consumer behavior shifts are observed with an increasing preference for eco-friendly materials and a demand for calculators that offer enhanced functionality without overwhelming complexity. The penetration of scientific calculators in emerging economies, coupled with the continuous upgrade cycle for existing users, are key factors fueling this upward trajectory. The transition from basic scientific calculators to more advanced programmable and graphic models is also a significant trend, catering to higher educational levels and specialized professional applications.
Dominant Regions, Countries, or Segments in Scientific Calculator
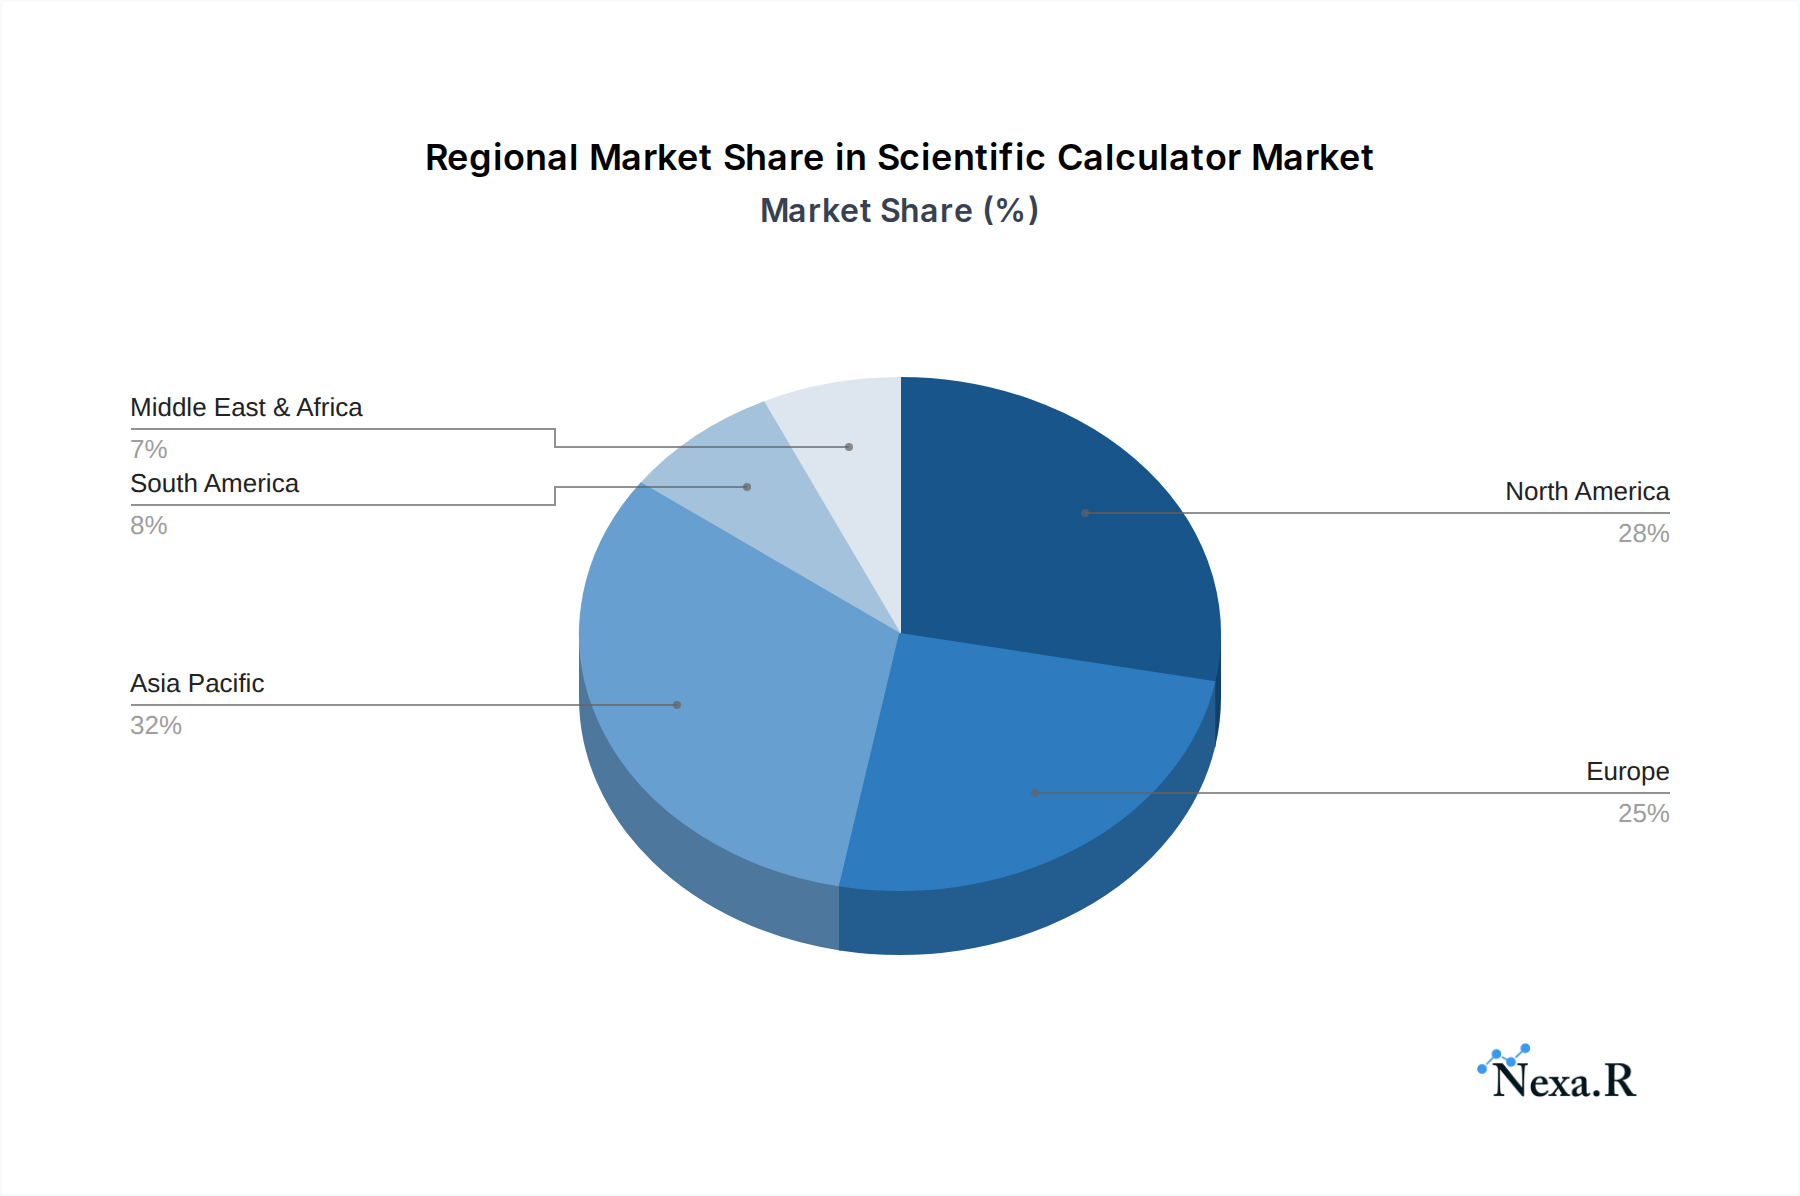
North America and Europe currently dominate the scientific calculator market, driven by strong academic infrastructure, high penetration of STEM education, and significant demand from engineering and research sectors. The Application segment of "Students and Exams" (parent market) is the primary growth engine, accounting for an estimated 60% of the global market share in 2025. Within this segment, standardized testing requirements for mathematics and science subjects globally necessitate the use of approved scientific calculators, ensuring consistent demand. The Type segment of "Standard Scientific Calculator" leads in volume due to its affordability and suitability for a broad range of academic levels, holding an estimated 45% of the market share in 2025. However, the Type segment of "Programmable Calculator" and "Graphic Calculator" are exhibiting higher growth rates, driven by advanced high school curricula and university-level STEM programs, respectively.
- Dominant Region Drivers:
- North America: Strong emphasis on STEM education, advanced research institutions, and robust technological adoption.
- Europe: Well-established educational systems, high demand for engineering and technical professionals, and supportive government initiatives for education.
- Dominant Country Drivers:
- United States: Largest market for educational technology, extensive university system, and a strong culture of innovation.
- Germany: Leading engineering and manufacturing hub, requiring sophisticated calculation tools for research and development.
- Japan: Renowned for its educational standards and technological advancements, with a significant consumer base for high-quality electronic devices.
- Dominant Application Segment Drivers (Students and Exams - Parent Market):
- Mandatory use in standardized testing: Ensures consistent demand across educational levels.
- Integration into STEM curricula: Foundation for learning complex mathematical and scientific concepts.
- Affordability and accessibility: Widespread availability and cost-effectiveness for students.
- Dominant Type Segment Drivers (Standard Scientific Calculator):
- Broad appeal: Suitable for primary, secondary, and introductory higher education.
- Cost-effectiveness: Lower price point compared to programmable and graphic calculators.
- Reliability and ease of use: Familiar interface for a wide user base.
- High Growth Type Segments (Programmable & Graphic Calculators):
- Advanced features: Enable complex problem-solving and data visualization.
- University and professional use: Essential for advanced studies in engineering, physics, and mathematics.
- Technological sophistication: Appealing to users seeking cutting-edge capabilities.
Scientific Calculator Product Landscape
The scientific calculator product landscape is characterized by continuous innovation aimed at enhancing functionality and user experience. Manufacturers are focusing on developing calculators with brighter, higher-resolution displays capable of visualizing complex graphs and equations. Integration of advanced algorithms for faster and more accurate calculations, along with improved battery life, are key performance metrics. Unique selling propositions include intuitive menu navigation, robust build quality for durability, and specialized functions tailored to specific academic disciplines or professional fields. Technological advancements are also seen in the form of enhanced connectivity options for data transfer and software updates, pushing the boundaries of what a portable calculation device can achieve.
Key Drivers, Barriers & Challenges in Scientific Calculator
Key Drivers:
- Growing emphasis on STEM education globally: Drives demand for essential calculation tools.
- Increasing complexity of academic curricula: Necessitates more advanced functionalities.
- Technological advancements: Integration of new features and improved performance.
- Emergence of emerging economies: Expanding educational access and professional opportunities.
Barriers & Challenges:
- Competition from sophisticated mobile applications and software: Offers a low-cost or free alternative for some users.
- Rapid technological obsolescence: Requires continuous investment in R&D to remain competitive.
- Supply chain disruptions: Potential impact on manufacturing and component availability.
- Regulatory hurdles: Obtaining approvals for use in standardized examinations can be a complex process.
- Price sensitivity in the student market: Limits the adoption of premium, high-priced models.
Emerging Opportunities in Scientific Calculator
Emerging opportunities lie in the development of eco-friendly scientific calculators utilizing sustainable materials and energy-efficient designs, catering to environmentally conscious consumers. The integration of AI-powered learning assistants that can guide students through complex problems or provide personalized feedback presents a significant untapped market. Furthermore, the expansion into niche professional markets, such as specialized fields like actuarial science or advanced statistics, with tailored calculator models offering specific functionalities, offers considerable growth potential. The increasing adoption of e-learning platforms also creates opportunities for interoperable calculators that can seamlessly sync data and results with online educational tools.
Growth Accelerators in the Scientific Calculator Industry
Long-term growth in the scientific calculator industry will be significantly accelerated by breakthroughs in battery technology offering extended operational life and reduced charging times. Strategic partnerships between calculator manufacturers and educational technology providers will be crucial for integrating calculators into digital learning ecosystems. Furthermore, market expansion into developing regions with increasing access to education and growing STEM fields presents a substantial opportunity for widespread adoption. The continuous refinement of user interfaces and the development of more intuitive programmable features will also act as key accelerators, making advanced capabilities more accessible to a broader user base.
Key Players Shaping the Scientific Calculator Market
- Casio
- Texas Instruments
- Sharp
- HP
- Canon
- Citizen Systems
- Deli
- M&G Chenguang
- Tianyan Electronics
- Guangdong Osalo
Notable Milestones in Scientific Calculator Sector
- 2019: Introduction of enhanced battery-saving technologies across multiple product lines.
- 2020: Launch of new graphic calculator models with improved display resolution and faster processing speeds.
- 2021: Increased focus on sustainability with the introduction of calculators made from recycled materials.
- 2022: Development of enhanced connectivity features for data synchronization with educational platforms.
- 2023: Rollout of advanced AI-assisted problem-solving features in high-end models.
- 2024: Expansion of product portfolios to cater to emerging markets with localized language support and tailored functionalities.
In-Depth Scientific Calculator Market Outlook
The future outlook for the scientific calculator market remains exceptionally bright, driven by sustained demand from the educational sector and the increasing need for sophisticated computational tools in professional environments. Growth accelerators will include continued technological innovation, particularly in areas like advanced battery life and intuitive user interfaces, alongside strategic market expansion into underserved regions. The ongoing global emphasis on STEM education ensures a consistent demand for reliable and effective calculation devices. Opportunities for differentiation exist in developing specialized calculators for niche applications and integrating them seamlessly with digital learning platforms. The industry is poised for sustained growth, fueled by a combination of essential utility and evolving technological capabilities.
Scientific Calculator Segmentation
-
1. Application
- 1.1. Students and Exams
- 1.2. Offices and Engineering
-
2. Types
- 2.1. Standard Scientific Calculator
- 2.2. Programmable Calculator
- 2.3. Graphic Calculator
- 2.4. Others
Scientific Calculator Segmentation By Geography
-
1. North America
- 1.1. United States
- 1.2. Canada
- 1.3. Mexico
-
2. South America
- 2.1. Brazil
- 2.2. Argentina
- 2.3. Rest of South America
-
3. Europe
- 3.1. United Kingdom
- 3.2. Germany
- 3.3. France
- 3.4. Italy
- 3.5. Spain
- 3.6. Russia
- 3.7. Benelux
- 3.8. Nordics
- 3.9. Rest of Europe
-
4. Middle East & Africa
- 4.1. Turkey
- 4.2. Israel
- 4.3. GCC
- 4.4. North Africa
- 4.5. South Africa
- 4.6. Rest of Middle East & Africa
-
5. Asia Pacific
- 5.1. China
- 5.2. India
- 5.3. Japan
- 5.4. South Korea
- 5.5. ASEAN
- 5.6. Oceania
- 5.7. Rest of Asia Pacific
Scientific Calculator Regional Market Share
Geographic Coverage of Scientific Calculator
Scientific Calculator REPORT HIGHLIGHTS
| Aspects | Details |
|---|---|
| Study Period | 2020-2034 |
| Base Year | 2025 |
| Estimated Year | 2026 |
| Forecast Period | 2026-2034 |
| Historical Period | 2020-2025 |
| Growth Rate | CAGR of 2% from 2020-2034 |
| Segmentation |
|
Table of Contents
- 1. Introduction
- 1.1. Research Scope
- 1.2. Market Segmentation
- 1.3. Research Methodology
- 1.4. Definitions and Assumptions
- 2. Executive Summary
- 2.1. Introduction
- 3. Market Dynamics
- 3.1. Introduction
- 3.2. Market Drivers
- 3.3. Market Restrains
- 3.4. Market Trends
- 4. Market Factor Analysis
- 4.1. Porters Five Forces
- 4.2. Supply/Value Chain
- 4.3. PESTEL analysis
- 4.4. Market Entropy
- 4.5. Patent/Trademark Analysis
- 5. Global Scientific Calculator Analysis, Insights and Forecast, 2020-2032
- 5.1. Market Analysis, Insights and Forecast - by Application
- 5.1.1. Students and Exams
- 5.1.2. Offices and Engineering
- 5.2. Market Analysis, Insights and Forecast - by Types
- 5.2.1. Standard Scientific Calculator
- 5.2.2. Programmable Calculator
- 5.2.3. Graphic Calculator
- 5.2.4. Others
- 5.3. Market Analysis, Insights and Forecast - by Region
- 5.3.1. North America
- 5.3.2. South America
- 5.3.3. Europe
- 5.3.4. Middle East & Africa
- 5.3.5. Asia Pacific
- 5.1. Market Analysis, Insights and Forecast - by Application
- 6. North America Scientific Calculator Analysis, Insights and Forecast, 2020-2032
- 6.1. Market Analysis, Insights and Forecast - by Application
- 6.1.1. Students and Exams
- 6.1.2. Offices and Engineering
- 6.2. Market Analysis, Insights and Forecast - by Types
- 6.2.1. Standard Scientific Calculator
- 6.2.2. Programmable Calculator
- 6.2.3. Graphic Calculator
- 6.2.4. Others
- 6.1. Market Analysis, Insights and Forecast - by Application
- 7. South America Scientific Calculator Analysis, Insights and Forecast, 2020-2032
- 7.1. Market Analysis, Insights and Forecast - by Application
- 7.1.1. Students and Exams
- 7.1.2. Offices and Engineering
- 7.2. Market Analysis, Insights and Forecast - by Types
- 7.2.1. Standard Scientific Calculator
- 7.2.2. Programmable Calculator
- 7.2.3. Graphic Calculator
- 7.2.4. Others
- 7.1. Market Analysis, Insights and Forecast - by Application
- 8. Europe Scientific Calculator Analysis, Insights and Forecast, 2020-2032
- 8.1. Market Analysis, Insights and Forecast - by Application
- 8.1.1. Students and Exams
- 8.1.2. Offices and Engineering
- 8.2. Market Analysis, Insights and Forecast - by Types
- 8.2.1. Standard Scientific Calculator
- 8.2.2. Programmable Calculator
- 8.2.3. Graphic Calculator
- 8.2.4. Others
- 8.1. Market Analysis, Insights and Forecast - by Application
- 9. Middle East & Africa Scientific Calculator Analysis, Insights and Forecast, 2020-2032
- 9.1. Market Analysis, Insights and Forecast - by Application
- 9.1.1. Students and Exams
- 9.1.2. Offices and Engineering
- 9.2. Market Analysis, Insights and Forecast - by Types
- 9.2.1. Standard Scientific Calculator
- 9.2.2. Programmable Calculator
- 9.2.3. Graphic Calculator
- 9.2.4. Others
- 9.1. Market Analysis, Insights and Forecast - by Application
- 10. Asia Pacific Scientific Calculator Analysis, Insights and Forecast, 2020-2032
- 10.1. Market Analysis, Insights and Forecast - by Application
- 10.1.1. Students and Exams
- 10.1.2. Offices and Engineering
- 10.2. Market Analysis, Insights and Forecast - by Types
- 10.2.1. Standard Scientific Calculator
- 10.2.2. Programmable Calculator
- 10.2.3. Graphic Calculator
- 10.2.4. Others
- 10.1. Market Analysis, Insights and Forecast - by Application
- 11. Competitive Analysis
- 11.1. Global Market Share Analysis 2025
- 11.2. Company Profiles
- 11.2.1 Casio
- 11.2.1.1. Overview
- 11.2.1.2. Products
- 11.2.1.3. SWOT Analysis
- 11.2.1.4. Recent Developments
- 11.2.1.5. Financials (Based on Availability)
- 11.2.2 Texas Instruments
- 11.2.2.1. Overview
- 11.2.2.2. Products
- 11.2.2.3. SWOT Analysis
- 11.2.2.4. Recent Developments
- 11.2.2.5. Financials (Based on Availability)
- 11.2.3 Sharp
- 11.2.3.1. Overview
- 11.2.3.2. Products
- 11.2.3.3. SWOT Analysis
- 11.2.3.4. Recent Developments
- 11.2.3.5. Financials (Based on Availability)
- 11.2.4 HP
- 11.2.4.1. Overview
- 11.2.4.2. Products
- 11.2.4.3. SWOT Analysis
- 11.2.4.4. Recent Developments
- 11.2.4.5. Financials (Based on Availability)
- 11.2.5 Canon
- 11.2.5.1. Overview
- 11.2.5.2. Products
- 11.2.5.3. SWOT Analysis
- 11.2.5.4. Recent Developments
- 11.2.5.5. Financials (Based on Availability)
- 11.2.6 Citizen Systems
- 11.2.6.1. Overview
- 11.2.6.2. Products
- 11.2.6.3. SWOT Analysis
- 11.2.6.4. Recent Developments
- 11.2.6.5. Financials (Based on Availability)
- 11.2.7 Deli
- 11.2.7.1. Overview
- 11.2.7.2. Products
- 11.2.7.3. SWOT Analysis
- 11.2.7.4. Recent Developments
- 11.2.7.5. Financials (Based on Availability)
- 11.2.8 M&G Chenguang
- 11.2.8.1. Overview
- 11.2.8.2. Products
- 11.2.8.3. SWOT Analysis
- 11.2.8.4. Recent Developments
- 11.2.8.5. Financials (Based on Availability)
- 11.2.9 Tianyan Electronics
- 11.2.9.1. Overview
- 11.2.9.2. Products
- 11.2.9.3. SWOT Analysis
- 11.2.9.4. Recent Developments
- 11.2.9.5. Financials (Based on Availability)
- 11.2.10 Guangdong Osalo
- 11.2.10.1. Overview
- 11.2.10.2. Products
- 11.2.10.3. SWOT Analysis
- 11.2.10.4. Recent Developments
- 11.2.10.5. Financials (Based on Availability)
- 11.2.1 Casio
List of Figures
- Figure 1: Global Scientific Calculator Revenue Breakdown (undefined, %) by Region 2025 & 2033
- Figure 2: Global Scientific Calculator Volume Breakdown (K, %) by Region 2025 & 2033
- Figure 3: North America Scientific Calculator Revenue (undefined), by Application 2025 & 2033
- Figure 4: North America Scientific Calculator Volume (K), by Application 2025 & 2033
- Figure 5: North America Scientific Calculator Revenue Share (%), by Application 2025 & 2033
- Figure 6: North America Scientific Calculator Volume Share (%), by Application 2025 & 2033
- Figure 7: North America Scientific Calculator Revenue (undefined), by Types 2025 & 2033
- Figure 8: North America Scientific Calculator Volume (K), by Types 2025 & 2033
- Figure 9: North America Scientific Calculator Revenue Share (%), by Types 2025 & 2033
- Figure 10: North America Scientific Calculator Volume Share (%), by Types 2025 & 2033
- Figure 11: North America Scientific Calculator Revenue (undefined), by Country 2025 & 2033
- Figure 12: North America Scientific Calculator Volume (K), by Country 2025 & 2033
- Figure 13: North America Scientific Calculator Revenue Share (%), by Country 2025 & 2033
- Figure 14: North America Scientific Calculator Volume Share (%), by Country 2025 & 2033
- Figure 15: South America Scientific Calculator Revenue (undefined), by Application 2025 & 2033
- Figure 16: South America Scientific Calculator Volume (K), by Application 2025 & 2033
- Figure 17: South America Scientific Calculator Revenue Share (%), by Application 2025 & 2033
- Figure 18: South America Scientific Calculator Volume Share (%), by Application 2025 & 2033
- Figure 19: South America Scientific Calculator Revenue (undefined), by Types 2025 & 2033
- Figure 20: South America Scientific Calculator Volume (K), by Types 2025 & 2033
- Figure 21: South America Scientific Calculator Revenue Share (%), by Types 2025 & 2033
- Figure 22: South America Scientific Calculator Volume Share (%), by Types 2025 & 2033
- Figure 23: South America Scientific Calculator Revenue (undefined), by Country 2025 & 2033
- Figure 24: South America Scientific Calculator Volume (K), by Country 2025 & 2033
- Figure 25: South America Scientific Calculator Revenue Share (%), by Country 2025 & 2033
- Figure 26: South America Scientific Calculator Volume Share (%), by Country 2025 & 2033
- Figure 27: Europe Scientific Calculator Revenue (undefined), by Application 2025 & 2033
- Figure 28: Europe Scientific Calculator Volume (K), by Application 2025 & 2033
- Figure 29: Europe Scientific Calculator Revenue Share (%), by Application 2025 & 2033
- Figure 30: Europe Scientific Calculator Volume Share (%), by Application 2025 & 2033
- Figure 31: Europe Scientific Calculator Revenue (undefined), by Types 2025 & 2033
- Figure 32: Europe Scientific Calculator Volume (K), by Types 2025 & 2033
- Figure 33: Europe Scientific Calculator Revenue Share (%), by Types 2025 & 2033
- Figure 34: Europe Scientific Calculator Volume Share (%), by Types 2025 & 2033
- Figure 35: Europe Scientific Calculator Revenue (undefined), by Country 2025 & 2033
- Figure 36: Europe Scientific Calculator Volume (K), by Country 2025 & 2033
- Figure 37: Europe Scientific Calculator Revenue Share (%), by Country 2025 & 2033
- Figure 38: Europe Scientific Calculator Volume Share (%), by Country 2025 & 2033
- Figure 39: Middle East & Africa Scientific Calculator Revenue (undefined), by Application 2025 & 2033
- Figure 40: Middle East & Africa Scientific Calculator Volume (K), by Application 2025 & 2033
- Figure 41: Middle East & Africa Scientific Calculator Revenue Share (%), by Application 2025 & 2033
- Figure 42: Middle East & Africa Scientific Calculator Volume Share (%), by Application 2025 & 2033
- Figure 43: Middle East & Africa Scientific Calculator Revenue (undefined), by Types 2025 & 2033
- Figure 44: Middle East & Africa Scientific Calculator Volume (K), by Types 2025 & 2033
- Figure 45: Middle East & Africa Scientific Calculator Revenue Share (%), by Types 2025 & 2033
- Figure 46: Middle East & Africa Scientific Calculator Volume Share (%), by Types 2025 & 2033
- Figure 47: Middle East & Africa Scientific Calculator Revenue (undefined), by Country 2025 & 2033
- Figure 48: Middle East & Africa Scientific Calculator Volume (K), by Country 2025 & 2033
- Figure 49: Middle East & Africa Scientific Calculator Revenue Share (%), by Country 2025 & 2033
- Figure 50: Middle East & Africa Scientific Calculator Volume Share (%), by Country 2025 & 2033
- Figure 51: Asia Pacific Scientific Calculator Revenue (undefined), by Application 2025 & 2033
- Figure 52: Asia Pacific Scientific Calculator Volume (K), by Application 2025 & 2033
- Figure 53: Asia Pacific Scientific Calculator Revenue Share (%), by Application 2025 & 2033
- Figure 54: Asia Pacific Scientific Calculator Volume Share (%), by Application 2025 & 2033
- Figure 55: Asia Pacific Scientific Calculator Revenue (undefined), by Types 2025 & 2033
- Figure 56: Asia Pacific Scientific Calculator Volume (K), by Types 2025 & 2033
- Figure 57: Asia Pacific Scientific Calculator Revenue Share (%), by Types 2025 & 2033
- Figure 58: Asia Pacific Scientific Calculator Volume Share (%), by Types 2025 & 2033
- Figure 59: Asia Pacific Scientific Calculator Revenue (undefined), by Country 2025 & 2033
- Figure 60: Asia Pacific Scientific Calculator Volume (K), by Country 2025 & 2033
- Figure 61: Asia Pacific Scientific Calculator Revenue Share (%), by Country 2025 & 2033
- Figure 62: Asia Pacific Scientific Calculator Volume Share (%), by Country 2025 & 2033
List of Tables
- Table 1: Global Scientific Calculator Revenue undefined Forecast, by Application 2020 & 2033
- Table 2: Global Scientific Calculator Volume K Forecast, by Application 2020 & 2033
- Table 3: Global Scientific Calculator Revenue undefined Forecast, by Types 2020 & 2033
- Table 4: Global Scientific Calculator Volume K Forecast, by Types 2020 & 2033
- Table 5: Global Scientific Calculator Revenue undefined Forecast, by Region 2020 & 2033
- Table 6: Global Scientific Calculator Volume K Forecast, by Region 2020 & 2033
- Table 7: Global Scientific Calculator Revenue undefined Forecast, by Application 2020 & 2033
- Table 8: Global Scientific Calculator Volume K Forecast, by Application 2020 & 2033
- Table 9: Global Scientific Calculator Revenue undefined Forecast, by Types 2020 & 2033
- Table 10: Global Scientific Calculator Volume K Forecast, by Types 2020 & 2033
- Table 11: Global Scientific Calculator Revenue undefined Forecast, by Country 2020 & 2033
- Table 12: Global Scientific Calculator Volume K Forecast, by Country 2020 & 2033
- Table 13: United States Scientific Calculator Revenue (undefined) Forecast, by Application 2020 & 2033
- Table 14: United States Scientific Calculator Volume (K) Forecast, by Application 2020 & 2033
- Table 15: Canada Scientific Calculator Revenue (undefined) Forecast, by Application 2020 & 2033
- Table 16: Canada Scientific Calculator Volume (K) Forecast, by Application 2020 & 2033
- Table 17: Mexico Scientific Calculator Revenue (undefined) Forecast, by Application 2020 & 2033
- Table 18: Mexico Scientific Calculator Volume (K) Forecast, by Application 2020 & 2033
- Table 19: Global Scientific Calculator Revenue undefined Forecast, by Application 2020 & 2033
- Table 20: Global Scientific Calculator Volume K Forecast, by Application 2020 & 2033
- Table 21: Global Scientific Calculator Revenue undefined Forecast, by Types 2020 & 2033
- Table 22: Global Scientific Calculator Volume K Forecast, by Types 2020 & 2033
- Table 23: Global Scientific Calculator Revenue undefined Forecast, by Country 2020 & 2033
- Table 24: Global Scientific Calculator Volume K Forecast, by Country 2020 & 2033
- Table 25: Brazil Scientific Calculator Revenue (undefined) Forecast, by Application 2020 & 2033
- Table 26: Brazil Scientific Calculator Volume (K) Forecast, by Application 2020 & 2033
- Table 27: Argentina Scientific Calculator Revenue (undefined) Forecast, by Application 2020 & 2033
- Table 28: Argentina Scientific Calculator Volume (K) Forecast, by Application 2020 & 2033
- Table 29: Rest of South America Scientific Calculator Revenue (undefined) Forecast, by Application 2020 & 2033
- Table 30: Rest of South America Scientific Calculator Volume (K) Forecast, by Application 2020 & 2033
- Table 31: Global Scientific Calculator Revenue undefined Forecast, by Application 2020 & 2033
- Table 32: Global Scientific Calculator Volume K Forecast, by Application 2020 & 2033
- Table 33: Global Scientific Calculator Revenue undefined Forecast, by Types 2020 & 2033
- Table 34: Global Scientific Calculator Volume K Forecast, by Types 2020 & 2033
- Table 35: Global Scientific Calculator Revenue undefined Forecast, by Country 2020 & 2033
- Table 36: Global Scientific Calculator Volume K Forecast, by Country 2020 & 2033
- Table 37: United Kingdom Scientific Calculator Revenue (undefined) Forecast, by Application 2020 & 2033
- Table 38: United Kingdom Scientific Calculator Volume (K) Forecast, by Application 2020 & 2033
- Table 39: Germany Scientific Calculator Revenue (undefined) Forecast, by Application 2020 & 2033
- Table 40: Germany Scientific Calculator Volume (K) Forecast, by Application 2020 & 2033
- Table 41: France Scientific Calculator Revenue (undefined) Forecast, by Application 2020 & 2033
- Table 42: France Scientific Calculator Volume (K) Forecast, by Application 2020 & 2033
- Table 43: Italy Scientific Calculator Revenue (undefined) Forecast, by Application 2020 & 2033
- Table 44: Italy Scientific Calculator Volume (K) Forecast, by Application 2020 & 2033
- Table 45: Spain Scientific Calculator Revenue (undefined) Forecast, by Application 2020 & 2033
- Table 46: Spain Scientific Calculator Volume (K) Forecast, by Application 2020 & 2033
- Table 47: Russia Scientific Calculator Revenue (undefined) Forecast, by Application 2020 & 2033
- Table 48: Russia Scientific Calculator Volume (K) Forecast, by Application 2020 & 2033
- Table 49: Benelux Scientific Calculator Revenue (undefined) Forecast, by Application 2020 & 2033
- Table 50: Benelux Scientific Calculator Volume (K) Forecast, by Application 2020 & 2033
- Table 51: Nordics Scientific Calculator Revenue (undefined) Forecast, by Application 2020 & 2033
- Table 52: Nordics Scientific Calculator Volume (K) Forecast, by Application 2020 & 2033
- Table 53: Rest of Europe Scientific Calculator Revenue (undefined) Forecast, by Application 2020 & 2033
- Table 54: Rest of Europe Scientific Calculator Volume (K) Forecast, by Application 2020 & 2033
- Table 55: Global Scientific Calculator Revenue undefined Forecast, by Application 2020 & 2033
- Table 56: Global Scientific Calculator Volume K Forecast, by Application 2020 & 2033
- Table 57: Global Scientific Calculator Revenue undefined Forecast, by Types 2020 & 2033
- Table 58: Global Scientific Calculator Volume K Forecast, by Types 2020 & 2033
- Table 59: Global Scientific Calculator Revenue undefined Forecast, by Country 2020 & 2033
- Table 60: Global Scientific Calculator Volume K Forecast, by Country 2020 & 2033
- Table 61: Turkey Scientific Calculator Revenue (undefined) Forecast, by Application 2020 & 2033
- Table 62: Turkey Scientific Calculator Volume (K) Forecast, by Application 2020 & 2033
- Table 63: Israel Scientific Calculator Revenue (undefined) Forecast, by Application 2020 & 2033
- Table 64: Israel Scientific Calculator Volume (K) Forecast, by Application 2020 & 2033
- Table 65: GCC Scientific Calculator Revenue (undefined) Forecast, by Application 2020 & 2033
- Table 66: GCC Scientific Calculator Volume (K) Forecast, by Application 2020 & 2033
- Table 67: North Africa Scientific Calculator Revenue (undefined) Forecast, by Application 2020 & 2033
- Table 68: North Africa Scientific Calculator Volume (K) Forecast, by Application 2020 & 2033
- Table 69: South Africa Scientific Calculator Revenue (undefined) Forecast, by Application 2020 & 2033
- Table 70: South Africa Scientific Calculator Volume (K) Forecast, by Application 2020 & 2033
- Table 71: Rest of Middle East & Africa Scientific Calculator Revenue (undefined) Forecast, by Application 2020 & 2033
- Table 72: Rest of Middle East & Africa Scientific Calculator Volume (K) Forecast, by Application 2020 & 2033
- Table 73: Global Scientific Calculator Revenue undefined Forecast, by Application 2020 & 2033
- Table 74: Global Scientific Calculator Volume K Forecast, by Application 2020 & 2033
- Table 75: Global Scientific Calculator Revenue undefined Forecast, by Types 2020 & 2033
- Table 76: Global Scientific Calculator Volume K Forecast, by Types 2020 & 2033
- Table 77: Global Scientific Calculator Revenue undefined Forecast, by Country 2020 & 2033
- Table 78: Global Scientific Calculator Volume K Forecast, by Country 2020 & 2033
- Table 79: China Scientific Calculator Revenue (undefined) Forecast, by Application 2020 & 2033
- Table 80: China Scientific Calculator Volume (K) Forecast, by Application 2020 & 2033
- Table 81: India Scientific Calculator Revenue (undefined) Forecast, by Application 2020 & 2033
- Table 82: India Scientific Calculator Volume (K) Forecast, by Application 2020 & 2033
- Table 83: Japan Scientific Calculator Revenue (undefined) Forecast, by Application 2020 & 2033
- Table 84: Japan Scientific Calculator Volume (K) Forecast, by Application 2020 & 2033
- Table 85: South Korea Scientific Calculator Revenue (undefined) Forecast, by Application 2020 & 2033
- Table 86: South Korea Scientific Calculator Volume (K) Forecast, by Application 2020 & 2033
- Table 87: ASEAN Scientific Calculator Revenue (undefined) Forecast, by Application 2020 & 2033
- Table 88: ASEAN Scientific Calculator Volume (K) Forecast, by Application 2020 & 2033
- Table 89: Oceania Scientific Calculator Revenue (undefined) Forecast, by Application 2020 & 2033
- Table 90: Oceania Scientific Calculator Volume (K) Forecast, by Application 2020 & 2033
- Table 91: Rest of Asia Pacific Scientific Calculator Revenue (undefined) Forecast, by Application 2020 & 2033
- Table 92: Rest of Asia Pacific Scientific Calculator Volume (K) Forecast, by Application 2020 & 2033
Frequently Asked Questions
1. What is the projected Compound Annual Growth Rate (CAGR) of the Scientific Calculator?
The projected CAGR is approximately 2%.
2. Which companies are prominent players in the Scientific Calculator?
Key companies in the market include Casio, Texas Instruments, Sharp, HP, Canon, Citizen Systems, Deli, M&G Chenguang, Tianyan Electronics, Guangdong Osalo.
3. What are the main segments of the Scientific Calculator?
The market segments include Application, Types.
4. Can you provide details about the market size?
The market size is estimated to be USD XXX N/A as of 2022.
5. What are some drivers contributing to market growth?
N/A
6. What are the notable trends driving market growth?
N/A
7. Are there any restraints impacting market growth?
N/A
8. Can you provide examples of recent developments in the market?
N/A
9. What pricing options are available for accessing the report?
Pricing options include single-user, multi-user, and enterprise licenses priced at USD 4350.00, USD 6525.00, and USD 8700.00 respectively.
10. Is the market size provided in terms of value or volume?
The market size is provided in terms of value, measured in N/A and volume, measured in K.
11. Are there any specific market keywords associated with the report?
Yes, the market keyword associated with the report is "Scientific Calculator," which aids in identifying and referencing the specific market segment covered.
12. How do I determine which pricing option suits my needs best?
The pricing options vary based on user requirements and access needs. Individual users may opt for single-user licenses, while businesses requiring broader access may choose multi-user or enterprise licenses for cost-effective access to the report.
13. Are there any additional resources or data provided in the Scientific Calculator report?
While the report offers comprehensive insights, it's advisable to review the specific contents or supplementary materials provided to ascertain if additional resources or data are available.
14. How can I stay updated on further developments or reports in the Scientific Calculator?
To stay informed about further developments, trends, and reports in the Scientific Calculator, consider subscribing to industry newsletters, following relevant companies and organizations, or regularly checking reputable industry news sources and publications.
Methodology
Step 1 - Identification of Relevant Samples Size from Population Database


Step 2 - Approaches for Defining Global Market Size (Value, Volume* & Price*)

Note*: In applicable scenarios
Step 3 - Data Sources
Primary Research
- Web Analytics
- Survey Reports
- Research Institute
- Latest Research Reports
- Opinion Leaders
Secondary Research
- Annual Reports
- White Paper
- Latest Press Release
- Industry Association
- Paid Database
- Investor Presentations

Step 4 - Data Triangulation
Involves using different sources of information in order to increase the validity of a study
These sources are likely to be stakeholders in a program - participants, other researchers, program staff, other community members, and so on.
Then we put all data in single framework & apply various statistical tools to find out the dynamic on the market.
During the analysis stage, feedback from the stakeholder groups would be compared to determine areas of agreement as well as areas of divergence