

Key Insights
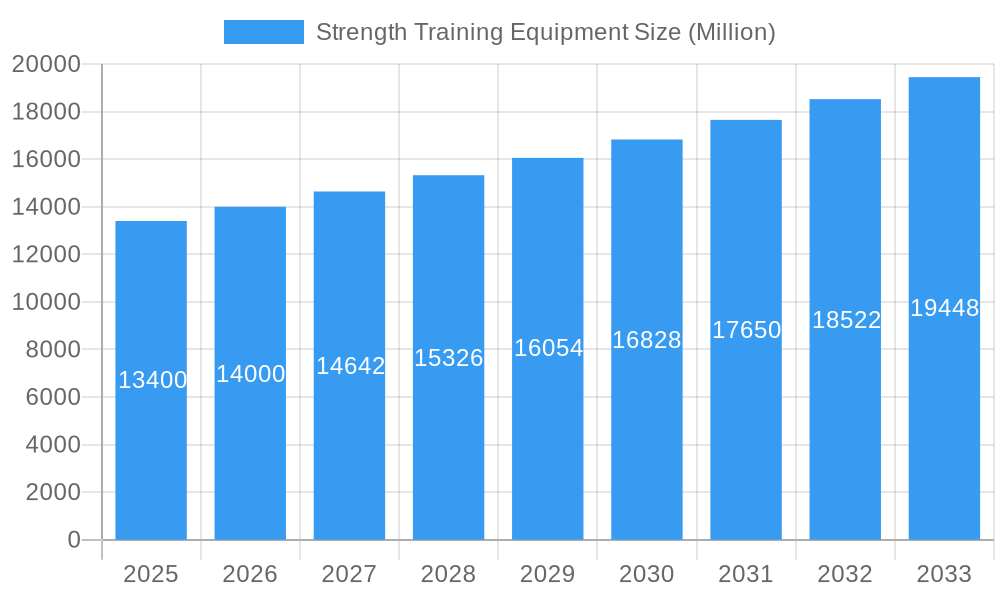
The global strength training equipment market, valued at $12.88 billion in the base year of 2025, is poised for substantial expansion, driven by escalating health consciousness and the demand for home and commercial fitness solutions. Key growth catalysts include the growing recognition of strength training's holistic health benefits, particularly among younger populations, and significant technological innovations enhancing user experience through smart features and personalized training. The proliferation of specialized boutique fitness studios also contributes to market dynamism. Competitive pricing and accessible financing options further bolster adoption.
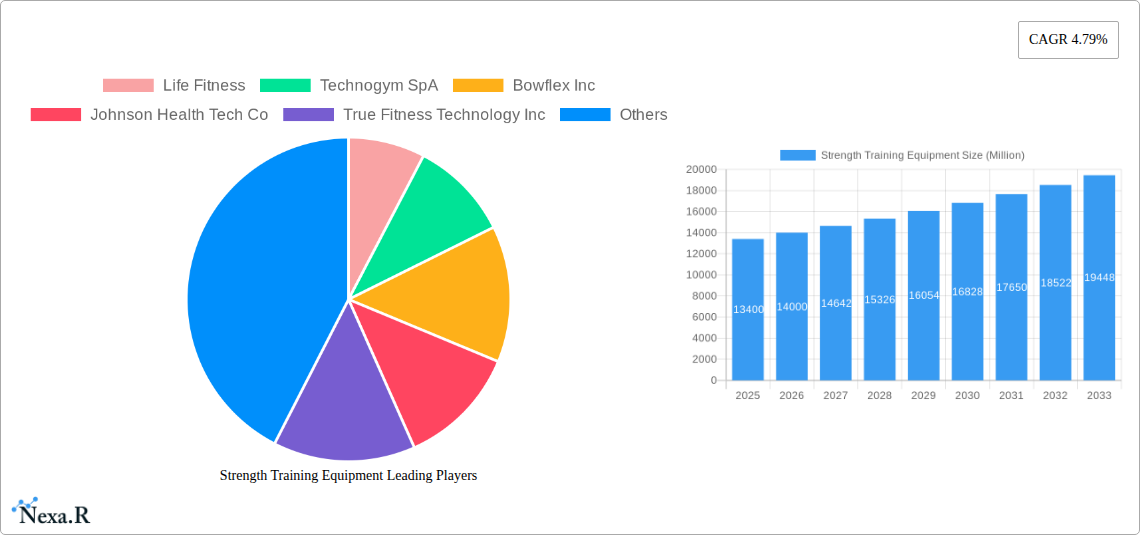
Strength Training Equipment Market Size (In Billion)
Despite these positive trends, the market navigates challenges such as the high upfront investment for premium equipment, space constraints for consumers, and the inherent risk of injury associated with improper use. Intense competition among established and emerging brands also influences pricing and profitability. Nevertheless, the forecast period (2025-2033) anticipates consistent growth, underpinned by enduring fitness trends and continuous product development. Opportunities lie within market segmentation, targeting specific niches such as home fitness, commercial facilities, and specialized equipment categories, projecting a compound annual growth rate (CAGR) of 6.32%.
Strength Training Equipment Company Market Share
Strength Training Equipment Market Report: 2019-2033
This comprehensive report provides a detailed analysis of the strength training equipment market, encompassing market dynamics, growth trends, regional segmentation, product landscape, key players, and future outlook. The study period covers 2019-2033, with a base year of 2025 and a forecast period of 2025-2033. The report utilizes data from the historical period (2019-2024) and incorporates projected values where necessary. The total market value is presented in million units.
Strength Training Equipment Market Dynamics & Structure
This section analyzes the competitive landscape, technological advancements, regulatory influences, and market trends within the strength training equipment industry (parent market: Fitness Equipment; child market: Strength Training Equipment). The market is moderately concentrated, with key players holding significant shares, but also exhibiting a dynamic competitive environment with frequent product launches and innovations.
- Market Concentration: The top 5 players account for approximately xx% of the global market share in 2025.
- Technological Innovation: AI integration, smart fitness technology, and connected fitness solutions are driving significant innovation. However, high R&D costs and intellectual property protection pose barriers to entry for smaller players.
- Regulatory Frameworks: Safety standards and compliance regulations vary across regions, impacting product design and distribution.
- Competitive Product Substitutes: Bodyweight training, calisthenics, and other alternative fitness methods present competitive pressure.
- End-User Demographics: The target market is diverse, spanning from individual consumers to commercial gyms, fitness studios, and healthcare facilities. Growing health consciousness and rising disposable incomes are contributing to market growth.
- M&A Trends: The past five years have seen xx M&A deals in the strength training equipment sector, mainly focused on expanding product portfolios and geographical reach.
Strength Training Equipment Growth Trends & Insights
Utilizing [insert data source name here, e.g., internal data, market research reports], this section provides a comprehensive analysis of market size evolution, adoption rates, technological disruptions, and shifts in consumer behavior. The market exhibited a CAGR of xx% during the historical period (2019-2024) and is projected to maintain a CAGR of xx% during the forecast period (2025-2033), reaching a market size of xx million units by 2033. Factors contributing to growth include increasing health awareness, rising disposable incomes in developing economies, and the growing adoption of home fitness solutions. Technological disruptions, like the integration of smart features and connected fitness platforms, are accelerating market expansion and changing consumer preferences towards personalized and data-driven fitness experiences. Market penetration is expected to increase from xx% in 2025 to xx% in 2033.
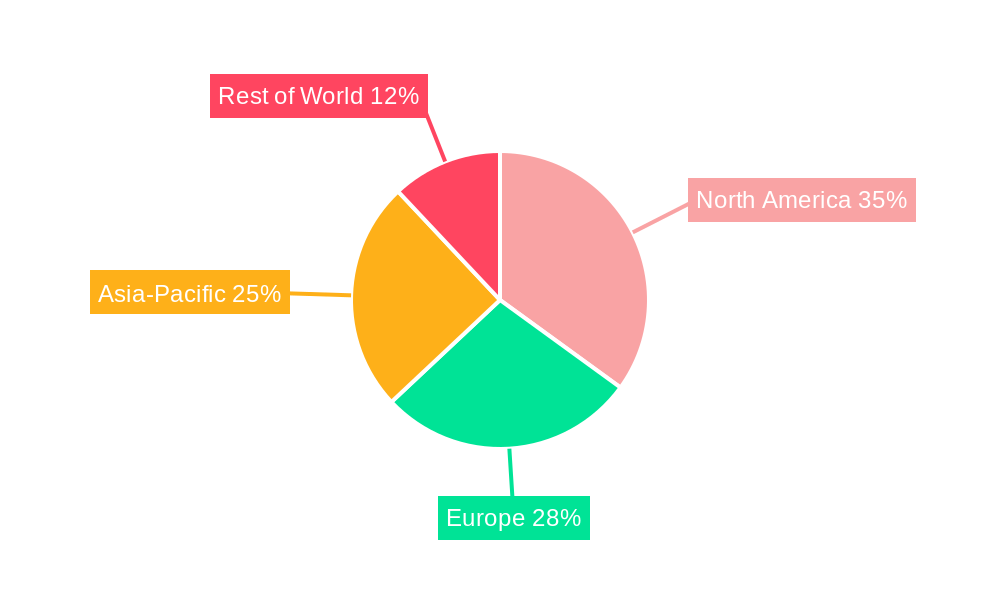
Dominant Regions, Countries, or Segments in Strength Training Equipment
North America currently dominates the strength training equipment market, driven by high consumer spending on fitness and wellness, a strong presence of major players, and well-established fitness infrastructure. However, the Asia-Pacific region exhibits the highest growth potential due to rapid urbanization, rising disposable incomes, and a growing health-conscious population.
- North America: High market maturity, strong consumer spending, established fitness culture.
- Europe: Moderate growth, driven by increasing health awareness and government initiatives promoting physical activity.
- Asia-Pacific: Highest growth potential, fueled by rising disposable incomes and increasing health consciousness.
- Rest of the World: Steady growth, with regional variations dependent on economic factors and cultural preferences.
Strength Training Equipment Product Landscape
The strength training equipment market encompasses a wide range of products, from traditional weight machines and free weights to innovative smart fitness solutions. Recent product innovations focus on enhanced user experience, personalized training programs, and data-driven performance tracking. Key features include adjustable resistance, integrated monitoring systems, and connectivity options with fitness apps and wearables. These advancements are enhancing user engagement and motivating consistent exercise routines, ultimately driving market expansion.
Key Drivers, Barriers & Challenges in Strength Training Equipment
Key Drivers:
- Growing health awareness and focus on physical fitness.
- Rising disposable incomes, particularly in developing economies.
- Technological advancements leading to more engaging and effective equipment.
- Increasing demand for home fitness solutions.
Key Challenges:
- Intense competition among established and emerging players.
- Supply chain disruptions impacting production and distribution.
- Fluctuations in raw material costs.
- Strict safety regulations and compliance requirements.
Emerging Opportunities in Strength Training Equipment
- Expansion into untapped markets: Emerging economies present substantial growth opportunities.
- Development of innovative products: Integration of AR/VR, AI-powered personalized training, and gamification offers substantial potential.
- Focus on specialized segments: Targeting niche markets like elderly fitness or rehabilitation offers further growth avenues.
Growth Accelerators in the Strength Training Equipment Industry
Technological advancements, strategic partnerships between equipment manufacturers and fitness technology providers, and expansion into new geographic markets are key catalysts driving long-term growth in the strength training equipment industry. Focus on integrating smart features, connected fitness platforms, and personalized training programs are enhancing the user experience, promoting product adoption, and driving market expansion. Further, strategic alliances between equipment manufacturers and fitness studios or gyms facilitate market penetration and broaden the customer base.
Key Players Shaping the Strength Training Equipment Market
- Life Fitness
- Technogym SpA
- Bowflex Inc
- Johnson Health Tech Co
- True Fitness Technology Inc
- Origin Fitness Limited
- Dyaco International Inc
- Decathlon
- IFIT Health And Fitness Inc
- Body Solid Inc
Notable Milestones in Strength Training Equipment Sector
- March 2023: Life Fitness launched its latest generation of cardio, strength, and digital fitness products, including the Life Fitness Insignia lines and Hammer Strength HD Plate and Plate Loaded machines.
- August 2023: Bowflex Inc. relaunched its iconic Bowflex brand with a redesigned identity and updated logo.
- January 2022: Technogym launched a new AI-powered strength training line.
In-Depth Strength Training Equipment Market Outlook
The strength training equipment market is poised for robust growth in the coming years, driven by technological innovation, increasing health awareness, and expansion into new markets. Opportunities exist for companies to capitalize on the growing demand for personalized fitness solutions and the integration of smart technologies. Strategic partnerships, focused R&D, and effective marketing strategies will be crucial for success in this dynamic and competitive market.
Strength Training Equipment Segmentation
-
1. Product Type
- 1.1. Weights
- 1.2. Racks and Benches
- 1.3. Exercise and Medicine Balls
- 1.4. Other Product Types
-
2. End User
- 2.1. Residential
- 2.2. Commercial
-
3. Distribution Channel
- 3.1. Online Retail Stores
- 3.2. Offline retail Stores
Strength Training Equipment Segmentation By Geography
-
1. North America
- 1.1. United States
- 1.2. Canada
- 1.3. Rest of North America
-
2. Europe
- 2.1. United Kingdom
- 2.2. Germany
- 2.3. Spain
- 2.4. France
- 2.5. Italy
- 2.6. Austria
- 2.7. Switzerland
- 2.8. Rest of Europe
-
3. Asia Pacific
- 3.1. China
- 3.2. Japan
- 3.3. South Korea
- 3.4. Australia
- 3.5. Rest of Asia Pacific
-
4. Rest of the World
- 4.1. South America
- 4.2. Middle East
Strength Training Equipment Regional Market Share
Geographic Coverage of Strength Training Equipment
Strength Training Equipment REPORT HIGHLIGHTS
| Aspects | Details |
|---|---|
| Study Period | 2020-2034 |
| Base Year | 2025 |
| Estimated Year | 2026 |
| Forecast Period | 2026-2034 |
| Historical Period | 2020-2025 |
| Growth Rate | CAGR of 6.32% from 2020-2034 |
| Segmentation |
|
Table of Contents
- 1. Introduction
- 1.1. Research Scope
- 1.2. Market Segmentation
- 1.3. Research Objective
- 1.4. Definitions and Assumptions
- 2. Executive Summary
- 2.1. Market Snapshot
- 3. Market Dynamics
- 3.1. Market Drivers
- 3.2. Market Restrains
- 3.3. Market Trends
- 3.4. Market Opportunities
- 4. Market Factor Analysis
- 4.1. Porters Five Forces
- 4.1.1. Bargaining Power of Suppliers
- 4.1.2. Bargaining Power of Buyers
- 4.1.3. Threat of New Entrants
- 4.1.4. Threat of Substitutes
- 4.1.5. Competitive Rivalry
- 4.2. PESTEL analysis
- 4.3. BCG Analysis
- 4.3.1. Stars (High Growth, High Market Share)
- 4.3.2. Cash Cows (Low Growth, High Market Share)
- 4.3.3. Question Mark (High Growth, Low Market Share)
- 4.3.4. Dogs (Low Growth, Low Market Share)
- 4.4. Ansoff Matrix Analysis
- 4.5. Supply Chain Analysis
- 4.6. Regulatory Landscape
- 4.7. Current Market Potential and Opportunity Assessment (TAM–SAM–SOM Framework)
- 4.8. NRP Analyst Note
- 4.1. Porters Five Forces
- 5. Market Analysis, Insights and Forecast 2021-2033
- 5.1. Market Analysis, Insights and Forecast - by Product Type
- 5.1.1. Weights
- 5.1.2. Racks and Benches
- 5.1.3. Exercise and Medicine Balls
- 5.1.4. Other Product Types
- 5.2. Market Analysis, Insights and Forecast - by End User
- 5.2.1. Residential
- 5.2.2. Commercial
- 5.3. Market Analysis, Insights and Forecast - by Distribution Channel
- 5.3.1. Online Retail Stores
- 5.3.2. Offline retail Stores
- 5.4. Market Analysis, Insights and Forecast - by Region
- 5.4.1. North America
- 5.4.2. Europe
- 5.4.3. Asia Pacific
- 5.4.4. Rest of the World
- 5.1. Market Analysis, Insights and Forecast - by Product Type
- 6. Global Strength Training Equipment Analysis, Insights and Forecast, 2021-2033
- 6.1. Market Analysis, Insights and Forecast - by Product Type
- 6.1.1. Weights
- 6.1.2. Racks and Benches
- 6.1.3. Exercise and Medicine Balls
- 6.1.4. Other Product Types
- 6.2. Market Analysis, Insights and Forecast - by End User
- 6.2.1. Residential
- 6.2.2. Commercial
- 6.3. Market Analysis, Insights and Forecast - by Distribution Channel
- 6.3.1. Online Retail Stores
- 6.3.2. Offline retail Stores
- 6.1. Market Analysis, Insights and Forecast - by Product Type
- 7. North America Strength Training Equipment Analysis, Insights and Forecast, 2020-2032
- 7.1. Market Analysis, Insights and Forecast - by Product Type
- 7.1.1. Weights
- 7.1.2. Racks and Benches
- 7.1.3. Exercise and Medicine Balls
- 7.1.4. Other Product Types
- 7.2. Market Analysis, Insights and Forecast - by End User
- 7.2.1. Residential
- 7.2.2. Commercial
- 7.3. Market Analysis, Insights and Forecast - by Distribution Channel
- 7.3.1. Online Retail Stores
- 7.3.2. Offline retail Stores
- 7.1. Market Analysis, Insights and Forecast - by Product Type
- 8. Europe Strength Training Equipment Analysis, Insights and Forecast, 2020-2032
- 8.1. Market Analysis, Insights and Forecast - by Product Type
- 8.1.1. Weights
- 8.1.2. Racks and Benches
- 8.1.3. Exercise and Medicine Balls
- 8.1.4. Other Product Types
- 8.2. Market Analysis, Insights and Forecast - by End User
- 8.2.1. Residential
- 8.2.2. Commercial
- 8.3. Market Analysis, Insights and Forecast - by Distribution Channel
- 8.3.1. Online Retail Stores
- 8.3.2. Offline retail Stores
- 8.1. Market Analysis, Insights and Forecast - by Product Type
- 9. Asia Pacific Strength Training Equipment Analysis, Insights and Forecast, 2020-2032
- 9.1. Market Analysis, Insights and Forecast - by Product Type
- 9.1.1. Weights
- 9.1.2. Racks and Benches
- 9.1.3. Exercise and Medicine Balls
- 9.1.4. Other Product Types
- 9.2. Market Analysis, Insights and Forecast - by End User
- 9.2.1. Residential
- 9.2.2. Commercial
- 9.3. Market Analysis, Insights and Forecast - by Distribution Channel
- 9.3.1. Online Retail Stores
- 9.3.2. Offline retail Stores
- 9.1. Market Analysis, Insights and Forecast - by Product Type
- 10. Rest of the World Strength Training Equipment Analysis, Insights and Forecast, 2020-2032
- 10.1. Market Analysis, Insights and Forecast - by Product Type
- 10.1.1. Weights
- 10.1.2. Racks and Benches
- 10.1.3. Exercise and Medicine Balls
- 10.1.4. Other Product Types
- 10.2. Market Analysis, Insights and Forecast - by End User
- 10.2.1. Residential
- 10.2.2. Commercial
- 10.3. Market Analysis, Insights and Forecast - by Distribution Channel
- 10.3.1. Online Retail Stores
- 10.3.2. Offline retail Stores
- 10.1. Market Analysis, Insights and Forecast - by Product Type
- 11. Competitive Analysis
- 11.1. Company Profiles
- 11.1.1 Life Fitness
- 11.1.1.1. Company Overview
- 11.1.1.2. Products
- 11.1.1.3. Company Financials
- 11.1.1.4. SWOT Analysis
- 11.1.2 Technogym SpA
- 11.1.2.1. Company Overview
- 11.1.2.2. Products
- 11.1.2.3. Company Financials
- 11.1.2.4. SWOT Analysis
- 11.1.3 Bowflex Inc
- 11.1.3.1. Company Overview
- 11.1.3.2. Products
- 11.1.3.3. Company Financials
- 11.1.3.4. SWOT Analysis
- 11.1.4 Johnson Health Tech Co
- 11.1.4.1. Company Overview
- 11.1.4.2. Products
- 11.1.4.3. Company Financials
- 11.1.4.4. SWOT Analysis
- 11.1.5 True Fitness Technology Inc
- 11.1.5.1. Company Overview
- 11.1.5.2. Products
- 11.1.5.3. Company Financials
- 11.1.5.4. SWOT Analysis
- 11.1.6 Origin Fitness Limited
- 11.1.6.1. Company Overview
- 11.1.6.2. Products
- 11.1.6.3. Company Financials
- 11.1.6.4. SWOT Analysis
- 11.1.7 Dyaco International Inc
- 11.1.7.1. Company Overview
- 11.1.7.2. Products
- 11.1.7.3. Company Financials
- 11.1.7.4. SWOT Analysis
- 11.1.8 Decathlon
- 11.1.8.1. Company Overview
- 11.1.8.2. Products
- 11.1.8.3. Company Financials
- 11.1.8.4. SWOT Analysis
- 11.1.9 IFIT Health And Fitness Inc
- 11.1.9.1. Company Overview
- 11.1.9.2. Products
- 11.1.9.3. Company Financials
- 11.1.9.4. SWOT Analysis
- 11.1.10 Body Solid Inc
- 11.1.10.1. Company Overview
- 11.1.10.2. Products
- 11.1.10.3. Company Financials
- 11.1.10.4. SWOT Analysis
- 11.1.1 Life Fitness
- 11.2. Market Entropy
- 11.2.1 Company's Key Areas Served
- 11.2.2 Recent Developments
- 11.3. Company Market Share Analysis 2025
- 11.3.1 Top 5 Companies Market Share Analysis
- 11.3.2 Top 3 Companies Market Share Analysis
- 11.4. List of Potential Customers
- 12. Research Methodology
List of Figures
- Figure 1: Global Strength Training Equipment Revenue Breakdown (billion, %) by Region 2025 & 2033
- Figure 2: Global Strength Training Equipment Volume Breakdown (Billion, %) by Region 2025 & 2033
- Figure 3: North America Strength Training Equipment Revenue (billion), by Product Type 2025 & 2033
- Figure 4: North America Strength Training Equipment Volume (Billion), by Product Type 2025 & 2033
- Figure 5: North America Strength Training Equipment Revenue Share (%), by Product Type 2025 & 2033
- Figure 6: North America Strength Training Equipment Volume Share (%), by Product Type 2025 & 2033
- Figure 7: North America Strength Training Equipment Revenue (billion), by End User 2025 & 2033
- Figure 8: North America Strength Training Equipment Volume (Billion), by End User 2025 & 2033
- Figure 9: North America Strength Training Equipment Revenue Share (%), by End User 2025 & 2033
- Figure 10: North America Strength Training Equipment Volume Share (%), by End User 2025 & 2033
- Figure 11: North America Strength Training Equipment Revenue (billion), by Distribution Channel 2025 & 2033
- Figure 12: North America Strength Training Equipment Volume (Billion), by Distribution Channel 2025 & 2033
- Figure 13: North America Strength Training Equipment Revenue Share (%), by Distribution Channel 2025 & 2033
- Figure 14: North America Strength Training Equipment Volume Share (%), by Distribution Channel 2025 & 2033
- Figure 15: North America Strength Training Equipment Revenue (billion), by Country 2025 & 2033
- Figure 16: North America Strength Training Equipment Volume (Billion), by Country 2025 & 2033
- Figure 17: North America Strength Training Equipment Revenue Share (%), by Country 2025 & 2033
- Figure 18: North America Strength Training Equipment Volume Share (%), by Country 2025 & 2033
- Figure 19: Europe Strength Training Equipment Revenue (billion), by Product Type 2025 & 2033
- Figure 20: Europe Strength Training Equipment Volume (Billion), by Product Type 2025 & 2033
- Figure 21: Europe Strength Training Equipment Revenue Share (%), by Product Type 2025 & 2033
- Figure 22: Europe Strength Training Equipment Volume Share (%), by Product Type 2025 & 2033
- Figure 23: Europe Strength Training Equipment Revenue (billion), by End User 2025 & 2033
- Figure 24: Europe Strength Training Equipment Volume (Billion), by End User 2025 & 2033
- Figure 25: Europe Strength Training Equipment Revenue Share (%), by End User 2025 & 2033
- Figure 26: Europe Strength Training Equipment Volume Share (%), by End User 2025 & 2033
- Figure 27: Europe Strength Training Equipment Revenue (billion), by Distribution Channel 2025 & 2033
- Figure 28: Europe Strength Training Equipment Volume (Billion), by Distribution Channel 2025 & 2033
- Figure 29: Europe Strength Training Equipment Revenue Share (%), by Distribution Channel 2025 & 2033
- Figure 30: Europe Strength Training Equipment Volume Share (%), by Distribution Channel 2025 & 2033
- Figure 31: Europe Strength Training Equipment Revenue (billion), by Country 2025 & 2033
- Figure 32: Europe Strength Training Equipment Volume (Billion), by Country 2025 & 2033
- Figure 33: Europe Strength Training Equipment Revenue Share (%), by Country 2025 & 2033
- Figure 34: Europe Strength Training Equipment Volume Share (%), by Country 2025 & 2033
- Figure 35: Asia Pacific Strength Training Equipment Revenue (billion), by Product Type 2025 & 2033
- Figure 36: Asia Pacific Strength Training Equipment Volume (Billion), by Product Type 2025 & 2033
- Figure 37: Asia Pacific Strength Training Equipment Revenue Share (%), by Product Type 2025 & 2033
- Figure 38: Asia Pacific Strength Training Equipment Volume Share (%), by Product Type 2025 & 2033
- Figure 39: Asia Pacific Strength Training Equipment Revenue (billion), by End User 2025 & 2033
- Figure 40: Asia Pacific Strength Training Equipment Volume (Billion), by End User 2025 & 2033
- Figure 41: Asia Pacific Strength Training Equipment Revenue Share (%), by End User 2025 & 2033
- Figure 42: Asia Pacific Strength Training Equipment Volume Share (%), by End User 2025 & 2033
- Figure 43: Asia Pacific Strength Training Equipment Revenue (billion), by Distribution Channel 2025 & 2033
- Figure 44: Asia Pacific Strength Training Equipment Volume (Billion), by Distribution Channel 2025 & 2033
- Figure 45: Asia Pacific Strength Training Equipment Revenue Share (%), by Distribution Channel 2025 & 2033
- Figure 46: Asia Pacific Strength Training Equipment Volume Share (%), by Distribution Channel 2025 & 2033
- Figure 47: Asia Pacific Strength Training Equipment Revenue (billion), by Country 2025 & 2033
- Figure 48: Asia Pacific Strength Training Equipment Volume (Billion), by Country 2025 & 2033
- Figure 49: Asia Pacific Strength Training Equipment Revenue Share (%), by Country 2025 & 2033
- Figure 50: Asia Pacific Strength Training Equipment Volume Share (%), by Country 2025 & 2033
- Figure 51: Rest of the World Strength Training Equipment Revenue (billion), by Product Type 2025 & 2033
- Figure 52: Rest of the World Strength Training Equipment Volume (Billion), by Product Type 2025 & 2033
- Figure 53: Rest of the World Strength Training Equipment Revenue Share (%), by Product Type 2025 & 2033
- Figure 54: Rest of the World Strength Training Equipment Volume Share (%), by Product Type 2025 & 2033
- Figure 55: Rest of the World Strength Training Equipment Revenue (billion), by End User 2025 & 2033
- Figure 56: Rest of the World Strength Training Equipment Volume (Billion), by End User 2025 & 2033
- Figure 57: Rest of the World Strength Training Equipment Revenue Share (%), by End User 2025 & 2033
- Figure 58: Rest of the World Strength Training Equipment Volume Share (%), by End User 2025 & 2033
- Figure 59: Rest of the World Strength Training Equipment Revenue (billion), by Distribution Channel 2025 & 2033
- Figure 60: Rest of the World Strength Training Equipment Volume (Billion), by Distribution Channel 2025 & 2033
- Figure 61: Rest of the World Strength Training Equipment Revenue Share (%), by Distribution Channel 2025 & 2033
- Figure 62: Rest of the World Strength Training Equipment Volume Share (%), by Distribution Channel 2025 & 2033
- Figure 63: Rest of the World Strength Training Equipment Revenue (billion), by Country 2025 & 2033
- Figure 64: Rest of the World Strength Training Equipment Volume (Billion), by Country 2025 & 2033
- Figure 65: Rest of the World Strength Training Equipment Revenue Share (%), by Country 2025 & 2033
- Figure 66: Rest of the World Strength Training Equipment Volume Share (%), by Country 2025 & 2033
List of Tables
- Table 1: Global Strength Training Equipment Revenue billion Forecast, by Product Type 2020 & 2033
- Table 2: Global Strength Training Equipment Volume Billion Forecast, by Product Type 2020 & 2033
- Table 3: Global Strength Training Equipment Revenue billion Forecast, by End User 2020 & 2033
- Table 4: Global Strength Training Equipment Volume Billion Forecast, by End User 2020 & 2033
- Table 5: Global Strength Training Equipment Revenue billion Forecast, by Distribution Channel 2020 & 2033
- Table 6: Global Strength Training Equipment Volume Billion Forecast, by Distribution Channel 2020 & 2033
- Table 7: Global Strength Training Equipment Revenue billion Forecast, by Region 2020 & 2033
- Table 8: Global Strength Training Equipment Volume Billion Forecast, by Region 2020 & 2033
- Table 9: Global Strength Training Equipment Revenue billion Forecast, by Product Type 2020 & 2033
- Table 10: Global Strength Training Equipment Volume Billion Forecast, by Product Type 2020 & 2033
- Table 11: Global Strength Training Equipment Revenue billion Forecast, by End User 2020 & 2033
- Table 12: Global Strength Training Equipment Volume Billion Forecast, by End User 2020 & 2033
- Table 13: Global Strength Training Equipment Revenue billion Forecast, by Distribution Channel 2020 & 2033
- Table 14: Global Strength Training Equipment Volume Billion Forecast, by Distribution Channel 2020 & 2033
- Table 15: Global Strength Training Equipment Revenue billion Forecast, by Country 2020 & 2033
- Table 16: Global Strength Training Equipment Volume Billion Forecast, by Country 2020 & 2033
- Table 17: United States Strength Training Equipment Revenue (billion) Forecast, by Application 2020 & 2033
- Table 18: United States Strength Training Equipment Volume (Billion) Forecast, by Application 2020 & 2033
- Table 19: Canada Strength Training Equipment Revenue (billion) Forecast, by Application 2020 & 2033
- Table 20: Canada Strength Training Equipment Volume (Billion) Forecast, by Application 2020 & 2033
- Table 21: Rest of North America Strength Training Equipment Revenue (billion) Forecast, by Application 2020 & 2033
- Table 22: Rest of North America Strength Training Equipment Volume (Billion) Forecast, by Application 2020 & 2033
- Table 23: Global Strength Training Equipment Revenue billion Forecast, by Product Type 2020 & 2033
- Table 24: Global Strength Training Equipment Volume Billion Forecast, by Product Type 2020 & 2033
- Table 25: Global Strength Training Equipment Revenue billion Forecast, by End User 2020 & 2033
- Table 26: Global Strength Training Equipment Volume Billion Forecast, by End User 2020 & 2033
- Table 27: Global Strength Training Equipment Revenue billion Forecast, by Distribution Channel 2020 & 2033
- Table 28: Global Strength Training Equipment Volume Billion Forecast, by Distribution Channel 2020 & 2033
- Table 29: Global Strength Training Equipment Revenue billion Forecast, by Country 2020 & 2033
- Table 30: Global Strength Training Equipment Volume Billion Forecast, by Country 2020 & 2033
- Table 31: United Kingdom Strength Training Equipment Revenue (billion) Forecast, by Application 2020 & 2033
- Table 32: United Kingdom Strength Training Equipment Volume (Billion) Forecast, by Application 2020 & 2033
- Table 33: Germany Strength Training Equipment Revenue (billion) Forecast, by Application 2020 & 2033
- Table 34: Germany Strength Training Equipment Volume (Billion) Forecast, by Application 2020 & 2033
- Table 35: Spain Strength Training Equipment Revenue (billion) Forecast, by Application 2020 & 2033
- Table 36: Spain Strength Training Equipment Volume (Billion) Forecast, by Application 2020 & 2033
- Table 37: France Strength Training Equipment Revenue (billion) Forecast, by Application 2020 & 2033
- Table 38: France Strength Training Equipment Volume (Billion) Forecast, by Application 2020 & 2033
- Table 39: Italy Strength Training Equipment Revenue (billion) Forecast, by Application 2020 & 2033
- Table 40: Italy Strength Training Equipment Volume (Billion) Forecast, by Application 2020 & 2033
- Table 41: Austria Strength Training Equipment Revenue (billion) Forecast, by Application 2020 & 2033
- Table 42: Austria Strength Training Equipment Volume (Billion) Forecast, by Application 2020 & 2033
- Table 43: Switzerland Strength Training Equipment Revenue (billion) Forecast, by Application 2020 & 2033
- Table 44: Switzerland Strength Training Equipment Volume (Billion) Forecast, by Application 2020 & 2033
- Table 45: Rest of Europe Strength Training Equipment Revenue (billion) Forecast, by Application 2020 & 2033
- Table 46: Rest of Europe Strength Training Equipment Volume (Billion) Forecast, by Application 2020 & 2033
- Table 47: Global Strength Training Equipment Revenue billion Forecast, by Product Type 2020 & 2033
- Table 48: Global Strength Training Equipment Volume Billion Forecast, by Product Type 2020 & 2033
- Table 49: Global Strength Training Equipment Revenue billion Forecast, by End User 2020 & 2033
- Table 50: Global Strength Training Equipment Volume Billion Forecast, by End User 2020 & 2033
- Table 51: Global Strength Training Equipment Revenue billion Forecast, by Distribution Channel 2020 & 2033
- Table 52: Global Strength Training Equipment Volume Billion Forecast, by Distribution Channel 2020 & 2033
- Table 53: Global Strength Training Equipment Revenue billion Forecast, by Country 2020 & 2033
- Table 54: Global Strength Training Equipment Volume Billion Forecast, by Country 2020 & 2033
- Table 55: China Strength Training Equipment Revenue (billion) Forecast, by Application 2020 & 2033
- Table 56: China Strength Training Equipment Volume (Billion) Forecast, by Application 2020 & 2033
- Table 57: Japan Strength Training Equipment Revenue (billion) Forecast, by Application 2020 & 2033
- Table 58: Japan Strength Training Equipment Volume (Billion) Forecast, by Application 2020 & 2033
- Table 59: South Korea Strength Training Equipment Revenue (billion) Forecast, by Application 2020 & 2033
- Table 60: South Korea Strength Training Equipment Volume (Billion) Forecast, by Application 2020 & 2033
- Table 61: Australia Strength Training Equipment Revenue (billion) Forecast, by Application 2020 & 2033
- Table 62: Australia Strength Training Equipment Volume (Billion) Forecast, by Application 2020 & 2033
- Table 63: Rest of Asia Pacific Strength Training Equipment Revenue (billion) Forecast, by Application 2020 & 2033
- Table 64: Rest of Asia Pacific Strength Training Equipment Volume (Billion) Forecast, by Application 2020 & 2033
- Table 65: Global Strength Training Equipment Revenue billion Forecast, by Product Type 2020 & 2033
- Table 66: Global Strength Training Equipment Volume Billion Forecast, by Product Type 2020 & 2033
- Table 67: Global Strength Training Equipment Revenue billion Forecast, by End User 2020 & 2033
- Table 68: Global Strength Training Equipment Volume Billion Forecast, by End User 2020 & 2033
- Table 69: Global Strength Training Equipment Revenue billion Forecast, by Distribution Channel 2020 & 2033
- Table 70: Global Strength Training Equipment Volume Billion Forecast, by Distribution Channel 2020 & 2033
- Table 71: Global Strength Training Equipment Revenue billion Forecast, by Country 2020 & 2033
- Table 72: Global Strength Training Equipment Volume Billion Forecast, by Country 2020 & 2033
- Table 73: South America Strength Training Equipment Revenue (billion) Forecast, by Application 2020 & 2033
- Table 74: South America Strength Training Equipment Volume (Billion) Forecast, by Application 2020 & 2033
- Table 75: Middle East Strength Training Equipment Revenue (billion) Forecast, by Application 2020 & 2033
- Table 76: Middle East Strength Training Equipment Volume (Billion) Forecast, by Application 2020 & 2033
Frequently Asked Questions
1. What is the projected Compound Annual Growth Rate (CAGR) of the Strength Training Equipment?
The projected CAGR is approximately 6.32%.
2. Which companies are prominent players in the Strength Training Equipment?
Key companies in the market include Life Fitness, Technogym SpA, Bowflex Inc, Johnson Health Tech Co, True Fitness Technology Inc, Origin Fitness Limited, Dyaco International Inc, Decathlon, IFIT Health And Fitness Inc, Body Solid Inc.
3. What are the main segments of the Strength Training Equipment?
The market segments include Product Type, End User, Distribution Channel.
4. Can you provide details about the market size?
The market size is estimated to be USD 12.88 billion as of 2022.
5. What are some drivers contributing to market growth?
Growing Influence of Healthy Lifestyles; Social Media Revolutionizing the Fitness Industry.
6. What are the notable trends driving market growth?
Strong demand for different types of weights from fitness-conscious consumers.
7. Are there any restraints impacting market growth?
Growing Influence of Healthy Lifestyles; Social Media Revolutionizing the Fitness Industry.
8. Can you provide examples of recent developments in the market?
In March 2023, Life Fitness introduced the latest generation cardio, strength, and digital product innovations, The company’s product innovations include the Life Fitness Insignia lines and the Hammer Strength HD Plate and Plate Loaded machines.
9. What pricing options are available for accessing the report?
Pricing options include single-user, multi-user, and enterprise licenses priced at USD 4750, USD 5250, and USD 8750 respectively.
10. Is the market size provided in terms of value or volume?
The market size is provided in terms of value, measured in billion and volume, measured in Billion.
11. Are there any specific market keywords associated with the report?
Yes, the market keyword associated with the report is "Strength Training Equipment," which aids in identifying and referencing the specific market segment covered.
12. How do I determine which pricing option suits my needs best?
The pricing options vary based on user requirements and access needs. Individual users may opt for single-user licenses, while businesses requiring broader access may choose multi-user or enterprise licenses for cost-effective access to the report.
13. Are there any additional resources or data provided in the Strength Training Equipment report?
While the report offers comprehensive insights, it's advisable to review the specific contents or supplementary materials provided to ascertain if additional resources or data are available.
14. How can I stay updated on further developments or reports in the Strength Training Equipment?
To stay informed about further developments, trends, and reports in the Strength Training Equipment, consider subscribing to industry newsletters, following relevant companies and organizations, or regularly checking reputable industry news sources and publications.
Methodology
Step 1 - Identification of Relevant Samples Size from Population Database


Step 2 - Approaches for Defining Global Market Size (Value, Volume* & Price*)

Note*: In applicable scenarios
Step 3 - Data Sources
Primary Research
- Web Analytics
- Survey Reports
- Research Institute
- Latest Research Reports
- Opinion Leaders
Secondary Research
- Annual Reports
- White Paper
- Latest Press Release
- Industry Association
- Paid Database
- Investor Presentations

Step 4 - Data Triangulation
Involves using different sources of information in order to increase the validity of a study
These sources are likely to be stakeholders in a program - participants, other researchers, program staff, other community members, and so on.
Then we put all data in single framework & apply various statistical tools to find out the dynamic on the market.
During the analysis stage, feedback from the stakeholder groups would be compared to determine areas of agreement as well as areas of divergence