

Key Insights
The global touchscreen EMI shield film market is experiencing robust growth, driven by the increasing demand for electronic devices with enhanced electromagnetic interference (EMI) protection. The market's expansion is fueled by several factors, including the proliferation of smartphones, tablets, and other portable electronics, coupled with rising consumer expectations for superior device performance and reliability. Miniaturization trends in electronics necessitate effective EMI shielding solutions to prevent signal interference and maintain optimal functionality. Furthermore, the adoption of advanced materials and manufacturing techniques contributes to the development of thinner, more efficient, and cost-effective EMI shield films, further accelerating market growth. Key players in this space, including TatsutA, Parker Hannifin, and Tekra, are investing heavily in research and development to enhance product offerings and cater to the evolving needs of various industries. The market is segmented based on material type (e.g., metal mesh, conductive polymer), application (consumer electronics, automotive, industrial), and geographic region. While precise market sizing data is unavailable, estimations based on industry reports suggest a market value of approximately $2 billion in 2025, with a compound annual growth rate (CAGR) of around 6-8% throughout the forecast period (2025-2033). This growth is expected to be driven primarily by the continued expansion of the consumer electronics sector and the increasing integration of touchscreen technology in automobiles and industrial applications.
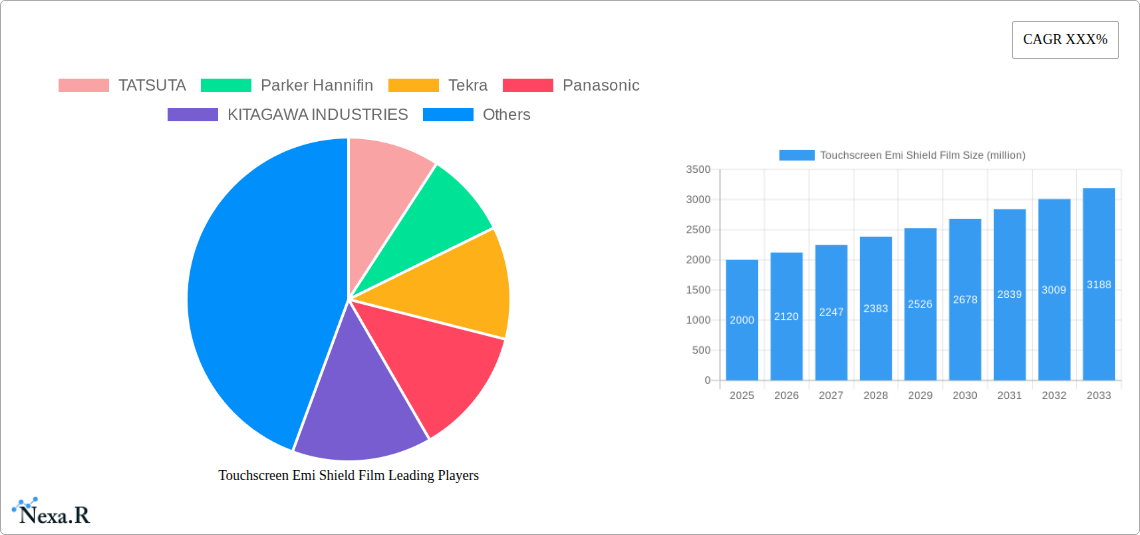
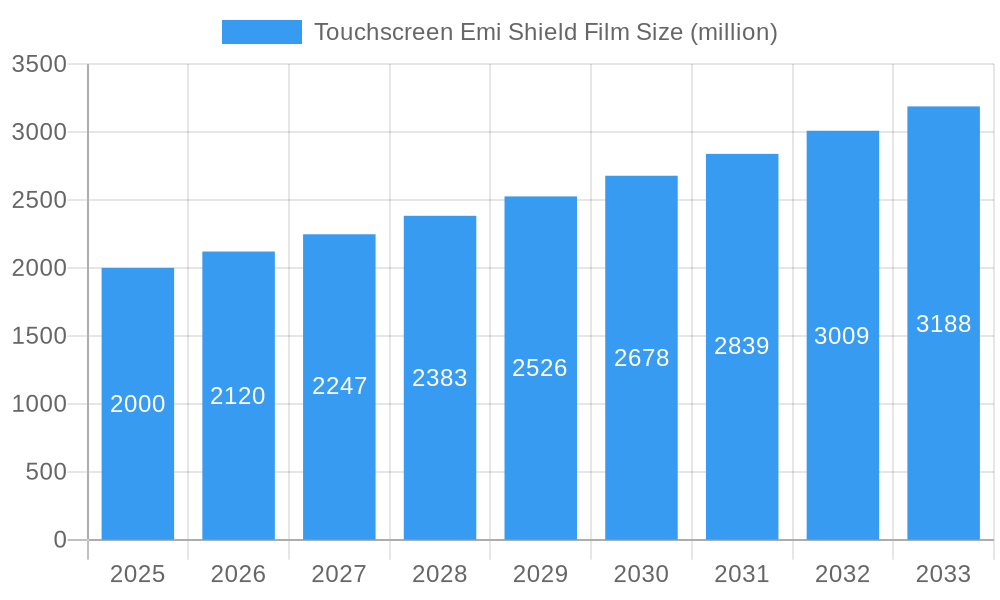
Touchscreen Emi Shield Film Market Size (In Billion)
Despite the positive growth outlook, several challenges remain. Competition among manufacturers is intense, requiring companies to innovate continuously to maintain market share. The cost of raw materials and manufacturing processes can impact profitability. Furthermore, regulatory compliance requirements related to material safety and environmental impact are adding complexity to the market landscape. Nevertheless, the long-term outlook for the touchscreen EMI shield film market remains optimistic, driven by sustained technological advancements and the persistent demand for sophisticated electronic devices across various sectors.
Touchscreen Emi Shield Film Company Market Share
Touchscreen EMI Shield Film Market Report: 2019-2033
This comprehensive report provides a detailed analysis of the global touchscreen EMI shield film market, encompassing market dynamics, growth trends, regional segmentation, product landscape, key players, and future outlook. The study period covers 2019-2033, with 2025 as the base and estimated year. This report is invaluable for industry professionals, investors, and strategic decision-makers seeking to understand and capitalize on opportunities within this rapidly evolving market. The report analyzes the parent market of electronic shielding materials and the child market of touchscreen protective films, providing a granular view of market forces.
Touchscreen EMI Shield Film Market Dynamics & Structure
The touchscreen EMI shield film market is characterized by moderate concentration, with key players like TATSUTA, Parker Hannifin, Tekra, Panasonic, KITAGAWA INDUSTRIES, TOYOCHEM, Thin Film Devices, Guangzhou HongQing Electronics, and Guangzhou Fangbang Electronics holding a significant market share (estimated at xx million units collectively in 2025, representing xx% market share). Technological innovation, driven by the demand for thinner, more flexible, and higher-performing films, is a key driver. Regulatory frameworks concerning electromagnetic interference (EMI) compliance across various industries are shaping market growth. Competitive substitutes include other shielding materials, but the unique properties of touchscreen EMI shield films, particularly their transparency and flexibility, provide a significant advantage. The end-user demographics span various sectors, including consumer electronics, automotive, industrial automation, and medical devices. M&A activity in the past five years has been moderate, with an estimated xx deals concluded, primarily focused on enhancing product portfolios and expanding geographic reach.
- Market Concentration: Moderately concentrated, with top 10 players holding xx% market share in 2025.
- Technological Innovation: Focus on thinner, more flexible, and transparent films with improved shielding effectiveness.
- Regulatory Landscape: Stringent EMI compliance standards driving market demand.
- Competitive Substitutes: Other shielding materials, but film offers unique advantages in flexibility and transparency.
- End-User Demographics: Diverse, spanning consumer electronics, automotive, industrial automation, and medical devices.
- M&A Activity: Moderate activity (xx deals in 2019-2024) focused on portfolio expansion and geographic reach.
Touchscreen EMI Shield Film Growth Trends & Insights
The global touchscreen EMI shield film market witnessed substantial growth during the historical period (2019-2024), expanding from xx million units in 2019 to xx million units in 2024, representing a CAGR of xx%. This growth is primarily attributed to the rising adoption of touchscreen technology across various applications. The increasing demand for portable electronics, the proliferation of smart devices, and the expansion of the automotive industry are key factors driving market expansion. Technological disruptions, such as the development of advanced materials and manufacturing processes, are further accelerating market growth. Consumer behavior shifts towards premium devices and enhanced user experiences are also fueling demand for high-quality EMI shield films. We project the market to reach xx million units by 2025 and xx million units by 2033, with a forecast CAGR of xx% during the period 2025-2033. Market penetration is expected to increase significantly in emerging economies. The continued development of flexible and foldable displays will further propel the market in the coming years.
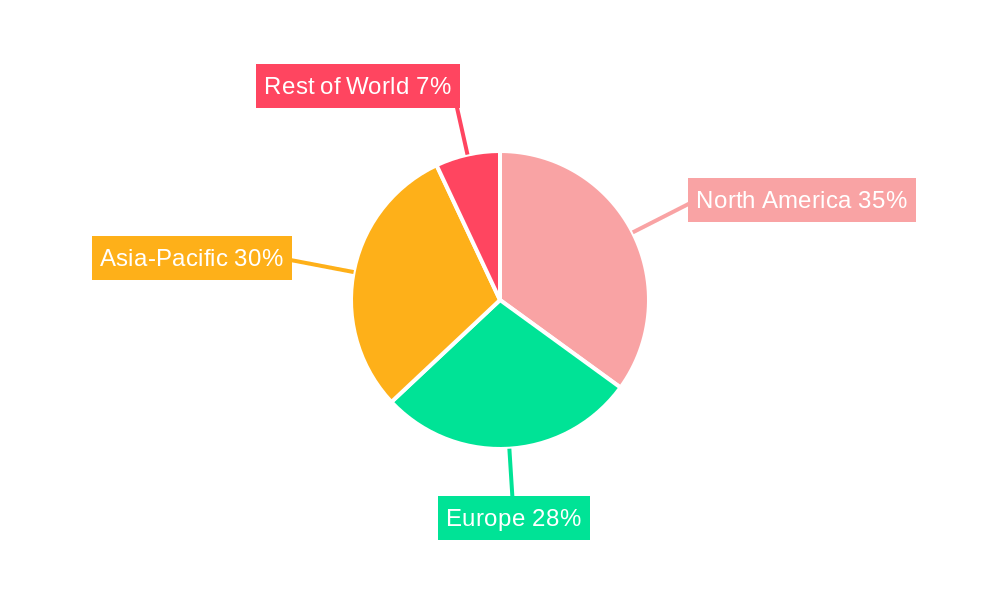
Dominant Regions, Countries, or Segments in Touchscreen EMI Shield Film
Asia-Pacific is currently the dominant region in the touchscreen EMI shield film market, accounting for approximately xx% of the global market share in 2025. This dominance is fueled by a combination of factors, including:
- High Smartphone and Consumer Electronics Penetration: The region has a large and rapidly growing market for smartphones and other consumer electronics, creating significant demand for EMI shielding solutions.
- Robust Manufacturing Base: A strong presence of electronics manufacturers in countries like China, South Korea, and Taiwan provides a ready market for local suppliers.
- Favorable Government Policies: Supportive government policies and initiatives aimed at boosting domestic manufacturing are fostering market expansion.
- Rapid Infrastructure Development: Increasing investments in transportation, communication, and other infrastructure are generating demand for advanced electronic devices and associated EMI shielding.
Other regions like North America and Europe are also expected to see significant growth, albeit at a slower pace compared to the Asia-Pacific region.
Touchscreen EMI Shield Film Product Landscape
Touchscreen EMI shield films are evolving rapidly, with innovations focused on improved shielding effectiveness, enhanced flexibility, and increased transparency. New materials, including nanomaterials and conductive polymers, are being incorporated to enhance performance. Applications are expanding beyond consumer electronics to encompass automotive displays, industrial control panels, and medical equipment. Key performance metrics include shielding effectiveness (in dB), transparency (in % transmission), and flexibility (in bending radius). Unique selling propositions often center on improved performance at thinner gauges and customized solutions for specific application requirements.
Key Drivers, Barriers & Challenges in Touchscreen EMI Shield Film
Key Drivers:
- Increasing demand for electronic devices: The proliferation of smartphones, tablets, and other portable electronics is a primary driver.
- Stringent EMI regulations: Growing concerns about electromagnetic interference are leading to stricter regulations.
- Technological advancements: Innovations in materials and manufacturing processes are improving product performance.
Key Barriers & Challenges:
- Supply chain disruptions: Geopolitical factors and material shortages can impact supply chain stability and lead to price fluctuations. This resulted in a xx% increase in average price in 2022.
- High manufacturing costs: The production of high-performance films can be expensive, impacting affordability.
- Intense competition: The market is characterized by intense competition among established players and new entrants.
Emerging Opportunities in Touchscreen EMI Shield Film
- Growth in foldable and flexible displays: The expanding market for foldable smartphones and other flexible devices is driving demand for specialized EMI shield films.
- Expansion into new applications: Opportunities exist in the automotive, industrial, and medical sectors for customized solutions.
- Development of sustainable and eco-friendly materials: There is increasing demand for more environmentally responsible materials.
Growth Accelerators in the Touchscreen EMI Shield Film Industry
The long-term growth of the touchscreen EMI shield film market is poised to be accelerated by several factors, including continued advancements in material science leading to thinner, lighter, and more effective films. Strategic partnerships between material suppliers and device manufacturers will foster innovation and accelerate product adoption. Expanding into emerging markets with growing demand for electronic devices will create significant opportunities for market expansion.
Key Players Shaping the Touchscreen EMI Shield Film Market
- TATSUTA
- Parker Hannifin
- Tekra
- Panasonic
- KITAGAWA INDUSTRIES
- TOYOCHEM
- Thin Film Devices
- Guangzhou HongQing Electronics
- Guangzhou Fangbang Electronics
Notable Milestones in Touchscreen EMI Shield Film Sector
- 2020-Q4: Introduction of a new generation of highly transparent EMI shield film by TATSUTA.
- 2021-Q2: Parker Hannifin acquires a smaller EMI shield film manufacturer, expanding its product portfolio.
- 2022-Q3: New industry standards for EMI compliance are implemented globally, driving increased demand.
- 2023-Q1: Several key players announce investments in advanced materials research and development.
In-Depth Touchscreen EMI Shield Film Market Outlook
The future of the touchscreen EMI shield film market is bright. Continued technological advancements, driven by demand for enhanced performance and new applications, will ensure robust growth. Strategic partnerships and the emergence of new players will further contribute to market dynamism. Expansion into high-growth regions and the adoption of sustainable materials will be key factors shaping the market landscape in the coming years. The long-term outlook is positive, with significant opportunities for market expansion and innovation.
Touchscreen Emi Shield Film Segmentation
-
1. Application
- 1.1. Consumer Electronics
- 1.2. Automobile
- 1.3. Defense
- 1.4. Other
-
2. Type
- 2.1. Metal-mesh Film
- 2.2. Coating Film
Touchscreen Emi Shield Film Segmentation By Geography
-
1. North America
- 1.1. United States
- 1.2. Canada
- 1.3. Mexico
-
2. South America
- 2.1. Brazil
- 2.2. Argentina
- 2.3. Rest of South America
-
3. Europe
- 3.1. United Kingdom
- 3.2. Germany
- 3.3. France
- 3.4. Italy
- 3.5. Spain
- 3.6. Russia
- 3.7. Benelux
- 3.8. Nordics
- 3.9. Rest of Europe
-
4. Middle East & Africa
- 4.1. Turkey
- 4.2. Israel
- 4.3. GCC
- 4.4. North Africa
- 4.5. South Africa
- 4.6. Rest of Middle East & Africa
-
5. Asia Pacific
- 5.1. China
- 5.2. India
- 5.3. Japan
- 5.4. South Korea
- 5.5. ASEAN
- 5.6. Oceania
- 5.7. Rest of Asia Pacific
Touchscreen Emi Shield Film Regional Market Share
Geographic Coverage of Touchscreen Emi Shield Film
Touchscreen Emi Shield Film REPORT HIGHLIGHTS
| Aspects | Details |
|---|---|
| Study Period | 2020-2034 |
| Base Year | 2025 |
| Estimated Year | 2026 |
| Forecast Period | 2026-2034 |
| Historical Period | 2020-2025 |
| Growth Rate | CAGR of XXX% from 2020-2034 |
| Segmentation |
|
Table of Contents
- 1. Introduction
- 1.1. Research Scope
- 1.2. Market Segmentation
- 1.3. Research Methodology
- 1.4. Definitions and Assumptions
- 2. Executive Summary
- 2.1. Introduction
- 3. Market Dynamics
- 3.1. Introduction
- 3.2. Market Drivers
- 3.3. Market Restrains
- 3.4. Market Trends
- 4. Market Factor Analysis
- 4.1. Porters Five Forces
- 4.2. Supply/Value Chain
- 4.3. PESTEL analysis
- 4.4. Market Entropy
- 4.5. Patent/Trademark Analysis
- 5. Global Touchscreen Emi Shield Film Analysis, Insights and Forecast, 2020-2032
- 5.1. Market Analysis, Insights and Forecast - by Application
- 5.1.1. Consumer Electronics
- 5.1.2. Automobile
- 5.1.3. Defense
- 5.1.4. Other
- 5.2. Market Analysis, Insights and Forecast - by Type
- 5.2.1. Metal-mesh Film
- 5.2.2. Coating Film
- 5.3. Market Analysis, Insights and Forecast - by Region
- 5.3.1. North America
- 5.3.2. South America
- 5.3.3. Europe
- 5.3.4. Middle East & Africa
- 5.3.5. Asia Pacific
- 5.1. Market Analysis, Insights and Forecast - by Application
- 6. North America Touchscreen Emi Shield Film Analysis, Insights and Forecast, 2020-2032
- 6.1. Market Analysis, Insights and Forecast - by Application
- 6.1.1. Consumer Electronics
- 6.1.2. Automobile
- 6.1.3. Defense
- 6.1.4. Other
- 6.2. Market Analysis, Insights and Forecast - by Type
- 6.2.1. Metal-mesh Film
- 6.2.2. Coating Film
- 6.1. Market Analysis, Insights and Forecast - by Application
- 7. South America Touchscreen Emi Shield Film Analysis, Insights and Forecast, 2020-2032
- 7.1. Market Analysis, Insights and Forecast - by Application
- 7.1.1. Consumer Electronics
- 7.1.2. Automobile
- 7.1.3. Defense
- 7.1.4. Other
- 7.2. Market Analysis, Insights and Forecast - by Type
- 7.2.1. Metal-mesh Film
- 7.2.2. Coating Film
- 7.1. Market Analysis, Insights and Forecast - by Application
- 8. Europe Touchscreen Emi Shield Film Analysis, Insights and Forecast, 2020-2032
- 8.1. Market Analysis, Insights and Forecast - by Application
- 8.1.1. Consumer Electronics
- 8.1.2. Automobile
- 8.1.3. Defense
- 8.1.4. Other
- 8.2. Market Analysis, Insights and Forecast - by Type
- 8.2.1. Metal-mesh Film
- 8.2.2. Coating Film
- 8.1. Market Analysis, Insights and Forecast - by Application
- 9. Middle East & Africa Touchscreen Emi Shield Film Analysis, Insights and Forecast, 2020-2032
- 9.1. Market Analysis, Insights and Forecast - by Application
- 9.1.1. Consumer Electronics
- 9.1.2. Automobile
- 9.1.3. Defense
- 9.1.4. Other
- 9.2. Market Analysis, Insights and Forecast - by Type
- 9.2.1. Metal-mesh Film
- 9.2.2. Coating Film
- 9.1. Market Analysis, Insights and Forecast - by Application
- 10. Asia Pacific Touchscreen Emi Shield Film Analysis, Insights and Forecast, 2020-2032
- 10.1. Market Analysis, Insights and Forecast - by Application
- 10.1.1. Consumer Electronics
- 10.1.2. Automobile
- 10.1.3. Defense
- 10.1.4. Other
- 10.2. Market Analysis, Insights and Forecast - by Type
- 10.2.1. Metal-mesh Film
- 10.2.2. Coating Film
- 10.1. Market Analysis, Insights and Forecast - by Application
- 11. Competitive Analysis
- 11.1. Global Market Share Analysis 2025
- 11.2. Company Profiles
- 11.2.1 TATSUTA
- 11.2.1.1. Overview
- 11.2.1.2. Products
- 11.2.1.3. SWOT Analysis
- 11.2.1.4. Recent Developments
- 11.2.1.5. Financials (Based on Availability)
- 11.2.2 Parker Hannifin
- 11.2.2.1. Overview
- 11.2.2.2. Products
- 11.2.2.3. SWOT Analysis
- 11.2.2.4. Recent Developments
- 11.2.2.5. Financials (Based on Availability)
- 11.2.3 Tekra
- 11.2.3.1. Overview
- 11.2.3.2. Products
- 11.2.3.3. SWOT Analysis
- 11.2.3.4. Recent Developments
- 11.2.3.5. Financials (Based on Availability)
- 11.2.4 Panasonic
- 11.2.4.1. Overview
- 11.2.4.2. Products
- 11.2.4.3. SWOT Analysis
- 11.2.4.4. Recent Developments
- 11.2.4.5. Financials (Based on Availability)
- 11.2.5 KITAGAWA INDUSTRIES
- 11.2.5.1. Overview
- 11.2.5.2. Products
- 11.2.5.3. SWOT Analysis
- 11.2.5.4. Recent Developments
- 11.2.5.5. Financials (Based on Availability)
- 11.2.6 TOYOCHEM
- 11.2.6.1. Overview
- 11.2.6.2. Products
- 11.2.6.3. SWOT Analysis
- 11.2.6.4. Recent Developments
- 11.2.6.5. Financials (Based on Availability)
- 11.2.7 Thin Film Devices
- 11.2.7.1. Overview
- 11.2.7.2. Products
- 11.2.7.3. SWOT Analysis
- 11.2.7.4. Recent Developments
- 11.2.7.5. Financials (Based on Availability)
- 11.2.8 Guangzhou HongQing Electronics
- 11.2.8.1. Overview
- 11.2.8.2. Products
- 11.2.8.3. SWOT Analysis
- 11.2.8.4. Recent Developments
- 11.2.8.5. Financials (Based on Availability)
- 11.2.9 Guangzhou Fangbang Electronics
- 11.2.9.1. Overview
- 11.2.9.2. Products
- 11.2.9.3. SWOT Analysis
- 11.2.9.4. Recent Developments
- 11.2.9.5. Financials (Based on Availability)
- 11.2.1 TATSUTA
List of Figures
- Figure 1: Global Touchscreen Emi Shield Film Revenue Breakdown (million, %) by Region 2025 & 2033
- Figure 2: Global Touchscreen Emi Shield Film Volume Breakdown (K, %) by Region 2025 & 2033
- Figure 3: North America Touchscreen Emi Shield Film Revenue (million), by Application 2025 & 2033
- Figure 4: North America Touchscreen Emi Shield Film Volume (K), by Application 2025 & 2033
- Figure 5: North America Touchscreen Emi Shield Film Revenue Share (%), by Application 2025 & 2033
- Figure 6: North America Touchscreen Emi Shield Film Volume Share (%), by Application 2025 & 2033
- Figure 7: North America Touchscreen Emi Shield Film Revenue (million), by Type 2025 & 2033
- Figure 8: North America Touchscreen Emi Shield Film Volume (K), by Type 2025 & 2033
- Figure 9: North America Touchscreen Emi Shield Film Revenue Share (%), by Type 2025 & 2033
- Figure 10: North America Touchscreen Emi Shield Film Volume Share (%), by Type 2025 & 2033
- Figure 11: North America Touchscreen Emi Shield Film Revenue (million), by Country 2025 & 2033
- Figure 12: North America Touchscreen Emi Shield Film Volume (K), by Country 2025 & 2033
- Figure 13: North America Touchscreen Emi Shield Film Revenue Share (%), by Country 2025 & 2033
- Figure 14: North America Touchscreen Emi Shield Film Volume Share (%), by Country 2025 & 2033
- Figure 15: South America Touchscreen Emi Shield Film Revenue (million), by Application 2025 & 2033
- Figure 16: South America Touchscreen Emi Shield Film Volume (K), by Application 2025 & 2033
- Figure 17: South America Touchscreen Emi Shield Film Revenue Share (%), by Application 2025 & 2033
- Figure 18: South America Touchscreen Emi Shield Film Volume Share (%), by Application 2025 & 2033
- Figure 19: South America Touchscreen Emi Shield Film Revenue (million), by Type 2025 & 2033
- Figure 20: South America Touchscreen Emi Shield Film Volume (K), by Type 2025 & 2033
- Figure 21: South America Touchscreen Emi Shield Film Revenue Share (%), by Type 2025 & 2033
- Figure 22: South America Touchscreen Emi Shield Film Volume Share (%), by Type 2025 & 2033
- Figure 23: South America Touchscreen Emi Shield Film Revenue (million), by Country 2025 & 2033
- Figure 24: South America Touchscreen Emi Shield Film Volume (K), by Country 2025 & 2033
- Figure 25: South America Touchscreen Emi Shield Film Revenue Share (%), by Country 2025 & 2033
- Figure 26: South America Touchscreen Emi Shield Film Volume Share (%), by Country 2025 & 2033
- Figure 27: Europe Touchscreen Emi Shield Film Revenue (million), by Application 2025 & 2033
- Figure 28: Europe Touchscreen Emi Shield Film Volume (K), by Application 2025 & 2033
- Figure 29: Europe Touchscreen Emi Shield Film Revenue Share (%), by Application 2025 & 2033
- Figure 30: Europe Touchscreen Emi Shield Film Volume Share (%), by Application 2025 & 2033
- Figure 31: Europe Touchscreen Emi Shield Film Revenue (million), by Type 2025 & 2033
- Figure 32: Europe Touchscreen Emi Shield Film Volume (K), by Type 2025 & 2033
- Figure 33: Europe Touchscreen Emi Shield Film Revenue Share (%), by Type 2025 & 2033
- Figure 34: Europe Touchscreen Emi Shield Film Volume Share (%), by Type 2025 & 2033
- Figure 35: Europe Touchscreen Emi Shield Film Revenue (million), by Country 2025 & 2033
- Figure 36: Europe Touchscreen Emi Shield Film Volume (K), by Country 2025 & 2033
- Figure 37: Europe Touchscreen Emi Shield Film Revenue Share (%), by Country 2025 & 2033
- Figure 38: Europe Touchscreen Emi Shield Film Volume Share (%), by Country 2025 & 2033
- Figure 39: Middle East & Africa Touchscreen Emi Shield Film Revenue (million), by Application 2025 & 2033
- Figure 40: Middle East & Africa Touchscreen Emi Shield Film Volume (K), by Application 2025 & 2033
- Figure 41: Middle East & Africa Touchscreen Emi Shield Film Revenue Share (%), by Application 2025 & 2033
- Figure 42: Middle East & Africa Touchscreen Emi Shield Film Volume Share (%), by Application 2025 & 2033
- Figure 43: Middle East & Africa Touchscreen Emi Shield Film Revenue (million), by Type 2025 & 2033
- Figure 44: Middle East & Africa Touchscreen Emi Shield Film Volume (K), by Type 2025 & 2033
- Figure 45: Middle East & Africa Touchscreen Emi Shield Film Revenue Share (%), by Type 2025 & 2033
- Figure 46: Middle East & Africa Touchscreen Emi Shield Film Volume Share (%), by Type 2025 & 2033
- Figure 47: Middle East & Africa Touchscreen Emi Shield Film Revenue (million), by Country 2025 & 2033
- Figure 48: Middle East & Africa Touchscreen Emi Shield Film Volume (K), by Country 2025 & 2033
- Figure 49: Middle East & Africa Touchscreen Emi Shield Film Revenue Share (%), by Country 2025 & 2033
- Figure 50: Middle East & Africa Touchscreen Emi Shield Film Volume Share (%), by Country 2025 & 2033
- Figure 51: Asia Pacific Touchscreen Emi Shield Film Revenue (million), by Application 2025 & 2033
- Figure 52: Asia Pacific Touchscreen Emi Shield Film Volume (K), by Application 2025 & 2033
- Figure 53: Asia Pacific Touchscreen Emi Shield Film Revenue Share (%), by Application 2025 & 2033
- Figure 54: Asia Pacific Touchscreen Emi Shield Film Volume Share (%), by Application 2025 & 2033
- Figure 55: Asia Pacific Touchscreen Emi Shield Film Revenue (million), by Type 2025 & 2033
- Figure 56: Asia Pacific Touchscreen Emi Shield Film Volume (K), by Type 2025 & 2033
- Figure 57: Asia Pacific Touchscreen Emi Shield Film Revenue Share (%), by Type 2025 & 2033
- Figure 58: Asia Pacific Touchscreen Emi Shield Film Volume Share (%), by Type 2025 & 2033
- Figure 59: Asia Pacific Touchscreen Emi Shield Film Revenue (million), by Country 2025 & 2033
- Figure 60: Asia Pacific Touchscreen Emi Shield Film Volume (K), by Country 2025 & 2033
- Figure 61: Asia Pacific Touchscreen Emi Shield Film Revenue Share (%), by Country 2025 & 2033
- Figure 62: Asia Pacific Touchscreen Emi Shield Film Volume Share (%), by Country 2025 & 2033
List of Tables
- Table 1: Global Touchscreen Emi Shield Film Revenue million Forecast, by Application 2020 & 2033
- Table 2: Global Touchscreen Emi Shield Film Volume K Forecast, by Application 2020 & 2033
- Table 3: Global Touchscreen Emi Shield Film Revenue million Forecast, by Type 2020 & 2033
- Table 4: Global Touchscreen Emi Shield Film Volume K Forecast, by Type 2020 & 2033
- Table 5: Global Touchscreen Emi Shield Film Revenue million Forecast, by Region 2020 & 2033
- Table 6: Global Touchscreen Emi Shield Film Volume K Forecast, by Region 2020 & 2033
- Table 7: Global Touchscreen Emi Shield Film Revenue million Forecast, by Application 2020 & 2033
- Table 8: Global Touchscreen Emi Shield Film Volume K Forecast, by Application 2020 & 2033
- Table 9: Global Touchscreen Emi Shield Film Revenue million Forecast, by Type 2020 & 2033
- Table 10: Global Touchscreen Emi Shield Film Volume K Forecast, by Type 2020 & 2033
- Table 11: Global Touchscreen Emi Shield Film Revenue million Forecast, by Country 2020 & 2033
- Table 12: Global Touchscreen Emi Shield Film Volume K Forecast, by Country 2020 & 2033
- Table 13: United States Touchscreen Emi Shield Film Revenue (million) Forecast, by Application 2020 & 2033
- Table 14: United States Touchscreen Emi Shield Film Volume (K) Forecast, by Application 2020 & 2033
- Table 15: Canada Touchscreen Emi Shield Film Revenue (million) Forecast, by Application 2020 & 2033
- Table 16: Canada Touchscreen Emi Shield Film Volume (K) Forecast, by Application 2020 & 2033
- Table 17: Mexico Touchscreen Emi Shield Film Revenue (million) Forecast, by Application 2020 & 2033
- Table 18: Mexico Touchscreen Emi Shield Film Volume (K) Forecast, by Application 2020 & 2033
- Table 19: Global Touchscreen Emi Shield Film Revenue million Forecast, by Application 2020 & 2033
- Table 20: Global Touchscreen Emi Shield Film Volume K Forecast, by Application 2020 & 2033
- Table 21: Global Touchscreen Emi Shield Film Revenue million Forecast, by Type 2020 & 2033
- Table 22: Global Touchscreen Emi Shield Film Volume K Forecast, by Type 2020 & 2033
- Table 23: Global Touchscreen Emi Shield Film Revenue million Forecast, by Country 2020 & 2033
- Table 24: Global Touchscreen Emi Shield Film Volume K Forecast, by Country 2020 & 2033
- Table 25: Brazil Touchscreen Emi Shield Film Revenue (million) Forecast, by Application 2020 & 2033
- Table 26: Brazil Touchscreen Emi Shield Film Volume (K) Forecast, by Application 2020 & 2033
- Table 27: Argentina Touchscreen Emi Shield Film Revenue (million) Forecast, by Application 2020 & 2033
- Table 28: Argentina Touchscreen Emi Shield Film Volume (K) Forecast, by Application 2020 & 2033
- Table 29: Rest of South America Touchscreen Emi Shield Film Revenue (million) Forecast, by Application 2020 & 2033
- Table 30: Rest of South America Touchscreen Emi Shield Film Volume (K) Forecast, by Application 2020 & 2033
- Table 31: Global Touchscreen Emi Shield Film Revenue million Forecast, by Application 2020 & 2033
- Table 32: Global Touchscreen Emi Shield Film Volume K Forecast, by Application 2020 & 2033
- Table 33: Global Touchscreen Emi Shield Film Revenue million Forecast, by Type 2020 & 2033
- Table 34: Global Touchscreen Emi Shield Film Volume K Forecast, by Type 2020 & 2033
- Table 35: Global Touchscreen Emi Shield Film Revenue million Forecast, by Country 2020 & 2033
- Table 36: Global Touchscreen Emi Shield Film Volume K Forecast, by Country 2020 & 2033
- Table 37: United Kingdom Touchscreen Emi Shield Film Revenue (million) Forecast, by Application 2020 & 2033
- Table 38: United Kingdom Touchscreen Emi Shield Film Volume (K) Forecast, by Application 2020 & 2033
- Table 39: Germany Touchscreen Emi Shield Film Revenue (million) Forecast, by Application 2020 & 2033
- Table 40: Germany Touchscreen Emi Shield Film Volume (K) Forecast, by Application 2020 & 2033
- Table 41: France Touchscreen Emi Shield Film Revenue (million) Forecast, by Application 2020 & 2033
- Table 42: France Touchscreen Emi Shield Film Volume (K) Forecast, by Application 2020 & 2033
- Table 43: Italy Touchscreen Emi Shield Film Revenue (million) Forecast, by Application 2020 & 2033
- Table 44: Italy Touchscreen Emi Shield Film Volume (K) Forecast, by Application 2020 & 2033
- Table 45: Spain Touchscreen Emi Shield Film Revenue (million) Forecast, by Application 2020 & 2033
- Table 46: Spain Touchscreen Emi Shield Film Volume (K) Forecast, by Application 2020 & 2033
- Table 47: Russia Touchscreen Emi Shield Film Revenue (million) Forecast, by Application 2020 & 2033
- Table 48: Russia Touchscreen Emi Shield Film Volume (K) Forecast, by Application 2020 & 2033
- Table 49: Benelux Touchscreen Emi Shield Film Revenue (million) Forecast, by Application 2020 & 2033
- Table 50: Benelux Touchscreen Emi Shield Film Volume (K) Forecast, by Application 2020 & 2033
- Table 51: Nordics Touchscreen Emi Shield Film Revenue (million) Forecast, by Application 2020 & 2033
- Table 52: Nordics Touchscreen Emi Shield Film Volume (K) Forecast, by Application 2020 & 2033
- Table 53: Rest of Europe Touchscreen Emi Shield Film Revenue (million) Forecast, by Application 2020 & 2033
- Table 54: Rest of Europe Touchscreen Emi Shield Film Volume (K) Forecast, by Application 2020 & 2033
- Table 55: Global Touchscreen Emi Shield Film Revenue million Forecast, by Application 2020 & 2033
- Table 56: Global Touchscreen Emi Shield Film Volume K Forecast, by Application 2020 & 2033
- Table 57: Global Touchscreen Emi Shield Film Revenue million Forecast, by Type 2020 & 2033
- Table 58: Global Touchscreen Emi Shield Film Volume K Forecast, by Type 2020 & 2033
- Table 59: Global Touchscreen Emi Shield Film Revenue million Forecast, by Country 2020 & 2033
- Table 60: Global Touchscreen Emi Shield Film Volume K Forecast, by Country 2020 & 2033
- Table 61: Turkey Touchscreen Emi Shield Film Revenue (million) Forecast, by Application 2020 & 2033
- Table 62: Turkey Touchscreen Emi Shield Film Volume (K) Forecast, by Application 2020 & 2033
- Table 63: Israel Touchscreen Emi Shield Film Revenue (million) Forecast, by Application 2020 & 2033
- Table 64: Israel Touchscreen Emi Shield Film Volume (K) Forecast, by Application 2020 & 2033
- Table 65: GCC Touchscreen Emi Shield Film Revenue (million) Forecast, by Application 2020 & 2033
- Table 66: GCC Touchscreen Emi Shield Film Volume (K) Forecast, by Application 2020 & 2033
- Table 67: North Africa Touchscreen Emi Shield Film Revenue (million) Forecast, by Application 2020 & 2033
- Table 68: North Africa Touchscreen Emi Shield Film Volume (K) Forecast, by Application 2020 & 2033
- Table 69: South Africa Touchscreen Emi Shield Film Revenue (million) Forecast, by Application 2020 & 2033
- Table 70: South Africa Touchscreen Emi Shield Film Volume (K) Forecast, by Application 2020 & 2033
- Table 71: Rest of Middle East & Africa Touchscreen Emi Shield Film Revenue (million) Forecast, by Application 2020 & 2033
- Table 72: Rest of Middle East & Africa Touchscreen Emi Shield Film Volume (K) Forecast, by Application 2020 & 2033
- Table 73: Global Touchscreen Emi Shield Film Revenue million Forecast, by Application 2020 & 2033
- Table 74: Global Touchscreen Emi Shield Film Volume K Forecast, by Application 2020 & 2033
- Table 75: Global Touchscreen Emi Shield Film Revenue million Forecast, by Type 2020 & 2033
- Table 76: Global Touchscreen Emi Shield Film Volume K Forecast, by Type 2020 & 2033
- Table 77: Global Touchscreen Emi Shield Film Revenue million Forecast, by Country 2020 & 2033
- Table 78: Global Touchscreen Emi Shield Film Volume K Forecast, by Country 2020 & 2033
- Table 79: China Touchscreen Emi Shield Film Revenue (million) Forecast, by Application 2020 & 2033
- Table 80: China Touchscreen Emi Shield Film Volume (K) Forecast, by Application 2020 & 2033
- Table 81: India Touchscreen Emi Shield Film Revenue (million) Forecast, by Application 2020 & 2033
- Table 82: India Touchscreen Emi Shield Film Volume (K) Forecast, by Application 2020 & 2033
- Table 83: Japan Touchscreen Emi Shield Film Revenue (million) Forecast, by Application 2020 & 2033
- Table 84: Japan Touchscreen Emi Shield Film Volume (K) Forecast, by Application 2020 & 2033
- Table 85: South Korea Touchscreen Emi Shield Film Revenue (million) Forecast, by Application 2020 & 2033
- Table 86: South Korea Touchscreen Emi Shield Film Volume (K) Forecast, by Application 2020 & 2033
- Table 87: ASEAN Touchscreen Emi Shield Film Revenue (million) Forecast, by Application 2020 & 2033
- Table 88: ASEAN Touchscreen Emi Shield Film Volume (K) Forecast, by Application 2020 & 2033
- Table 89: Oceania Touchscreen Emi Shield Film Revenue (million) Forecast, by Application 2020 & 2033
- Table 90: Oceania Touchscreen Emi Shield Film Volume (K) Forecast, by Application 2020 & 2033
- Table 91: Rest of Asia Pacific Touchscreen Emi Shield Film Revenue (million) Forecast, by Application 2020 & 2033
- Table 92: Rest of Asia Pacific Touchscreen Emi Shield Film Volume (K) Forecast, by Application 2020 & 2033
Frequently Asked Questions
1. What is the projected Compound Annual Growth Rate (CAGR) of the Touchscreen Emi Shield Film?
The projected CAGR is approximately XXX%.
2. Which companies are prominent players in the Touchscreen Emi Shield Film?
Key companies in the market include TATSUTA, Parker Hannifin, Tekra, Panasonic, KITAGAWA INDUSTRIES, TOYOCHEM, Thin Film Devices, Guangzhou HongQing Electronics, Guangzhou Fangbang Electronics.
3. What are the main segments of the Touchscreen Emi Shield Film?
The market segments include Application, Type.
4. Can you provide details about the market size?
The market size is estimated to be USD XXX million as of 2022.
5. What are some drivers contributing to market growth?
N/A
6. What are the notable trends driving market growth?
N/A
7. Are there any restraints impacting market growth?
N/A
8. Can you provide examples of recent developments in the market?
N/A
9. What pricing options are available for accessing the report?
Pricing options include single-user, multi-user, and enterprise licenses priced at USD 3950.00, USD 5925.00, and USD 7900.00 respectively.
10. Is the market size provided in terms of value or volume?
The market size is provided in terms of value, measured in million and volume, measured in K.
11. Are there any specific market keywords associated with the report?
Yes, the market keyword associated with the report is "Touchscreen Emi Shield Film," which aids in identifying and referencing the specific market segment covered.
12. How do I determine which pricing option suits my needs best?
The pricing options vary based on user requirements and access needs. Individual users may opt for single-user licenses, while businesses requiring broader access may choose multi-user or enterprise licenses for cost-effective access to the report.
13. Are there any additional resources or data provided in the Touchscreen Emi Shield Film report?
While the report offers comprehensive insights, it's advisable to review the specific contents or supplementary materials provided to ascertain if additional resources or data are available.
14. How can I stay updated on further developments or reports in the Touchscreen Emi Shield Film?
To stay informed about further developments, trends, and reports in the Touchscreen Emi Shield Film, consider subscribing to industry newsletters, following relevant companies and organizations, or regularly checking reputable industry news sources and publications.
Methodology
Step 1 - Identification of Relevant Samples Size from Population Database


Step 2 - Approaches for Defining Global Market Size (Value, Volume* & Price*)

Note*: In applicable scenarios
Step 3 - Data Sources
Primary Research
- Web Analytics
- Survey Reports
- Research Institute
- Latest Research Reports
- Opinion Leaders
Secondary Research
- Annual Reports
- White Paper
- Latest Press Release
- Industry Association
- Paid Database
- Investor Presentations

Step 4 - Data Triangulation
Involves using different sources of information in order to increase the validity of a study
These sources are likely to be stakeholders in a program - participants, other researchers, program staff, other community members, and so on.
Then we put all data in single framework & apply various statistical tools to find out the dynamic on the market.
During the analysis stage, feedback from the stakeholder groups would be compared to determine areas of agreement as well as areas of divergence