

Key Insights
The automotive UFS and eMMC market is experiencing robust growth, driven by the increasing demand for advanced driver-assistance systems (ADAS), in-vehicle infotainment (IVI) systems, and the proliferation of electric vehicles (EVs). These applications require high-speed, reliable memory solutions to handle the large amounts of data generated by various sensors and processors. The shift towards higher resolution displays, more complex software functionalities, and the increasing adoption of digital cockpits are key factors fueling market expansion. We project a Compound Annual Growth Rate (CAGR) of approximately 15% from 2025 to 2033, leading to a significant increase in market value. Major players like KIOXIA, Micron Technology, Samsung, Toshiba, and Western Digital are strategically investing in R&D to develop high-performance, automotive-grade memory solutions that meet the stringent reliability and temperature requirements of the automotive industry. The market segmentation is primarily driven by memory type (UFS vs. eMMC), capacity, and vehicle type (passenger cars vs. commercial vehicles). While eMMC continues to hold a significant market share due to its cost-effectiveness, UFS is rapidly gaining traction due to its superior performance capabilities, paving the way for seamless data transfer speeds crucial for future automotive functionalities.
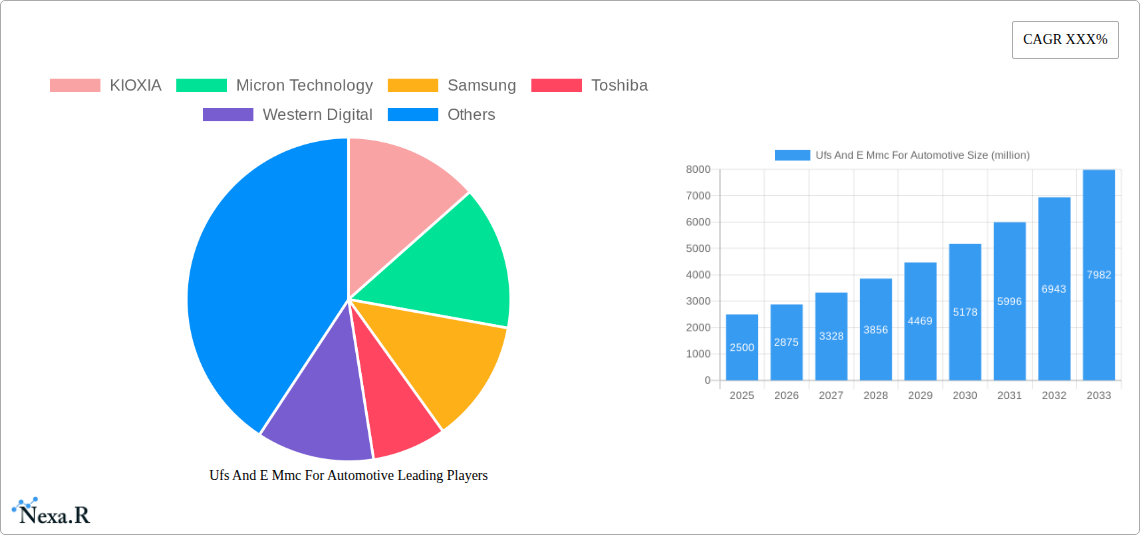
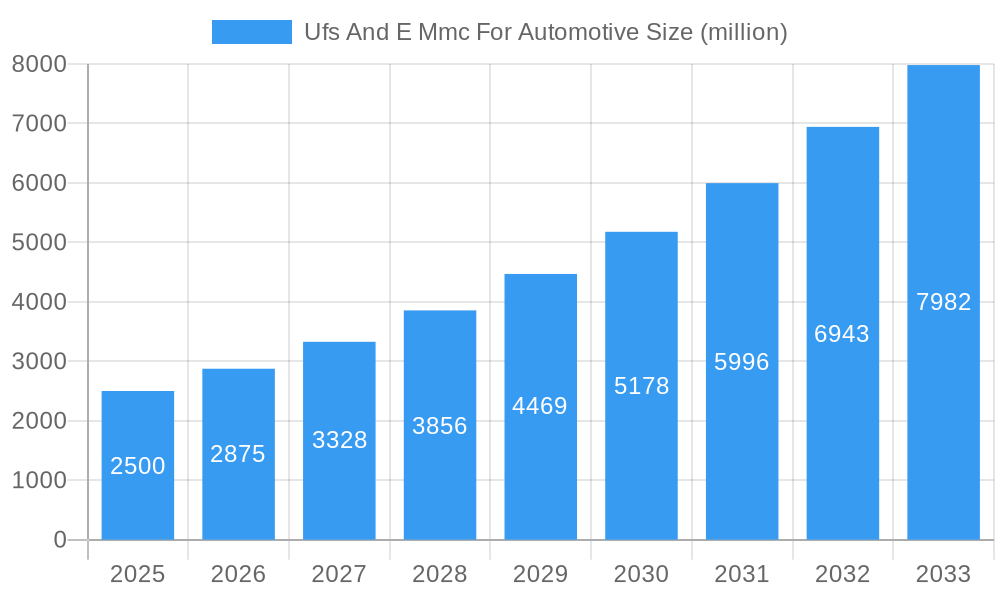
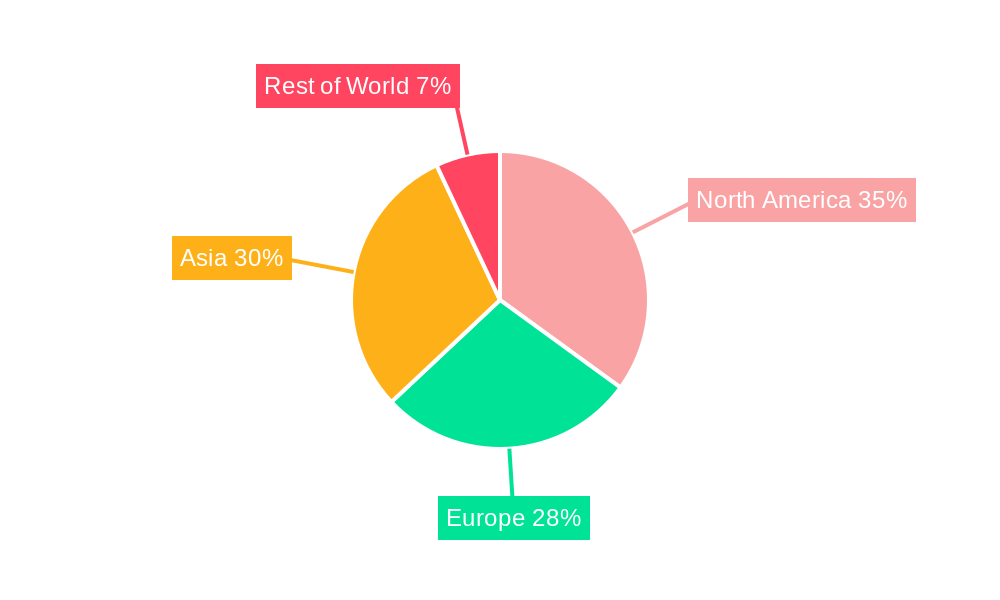
Ufs And E Mmc For Automotive Market Size (In Billion)
The market’s growth is, however, subject to certain restraints. The high cost of UFS memory compared to eMMC can pose a challenge, particularly in price-sensitive segments. Furthermore, the complexities associated with integrating these memory solutions into automotive electronic control units (ECUs) and ensuring compliance with strict automotive safety standards can also impact market growth. Despite these challenges, the long-term outlook remains positive, driven by the relentless technological advancements in the automotive industry, the growing demand for connected and autonomous vehicles, and continuous improvements in memory technology, resulting in smaller form factors and enhanced performance at lower price points. The market's regional distribution is expected to be skewed toward North America and Asia, mirroring the higher adoption rates of advanced automotive technologies in these regions.
Ufs And E Mmc For Automotive Company Market Share
UFS and eMMC for Automotive Market Report: 2019-2033
This comprehensive report provides a detailed analysis of the UFS and eMMC for automotive market, offering invaluable insights for industry professionals, investors, and stakeholders. Covering the period 2019-2033, with a focus on the base year 2025 and forecast period 2025-2033, this report meticulously examines market dynamics, growth trends, regional performance, product landscapes, and key players. The automotive embedded memory market, a parent market, is witnessing explosive growth, fueling the demand for high-performance UFS and eMMC solutions within its child market of automotive applications. The global market size is projected to reach xx million units by 2033.
UFS and eMMC for Automotive Market Dynamics & Structure
This section analyzes the competitive landscape, technological advancements, regulatory influences, and market trends shaping the UFS and eMMC for automotive sector. The report examines market concentration, revealing the market share held by key players such as KIOXIA, Micron Technology, Samsung, Toshiba, and Western Digital. The analysis includes:
- Market Concentration: The market is moderately concentrated, with the top 5 players holding approximately xx% of the market share in 2025.
- Technological Innovation: Continuous advancements in memory technology, such as increased storage capacity, faster data transfer rates, and enhanced endurance, are driving market growth.
- Regulatory Frameworks: Government regulations related to automotive safety and data security significantly impact the adoption of UFS and eMMC solutions.
- Competitive Product Substitutes: The primary substitute is other memory technologies, but UFS and eMMC offer a compelling combination of performance and cost-effectiveness.
- End-User Demographics: The primary end-users are automotive manufacturers (OEMs) and Tier-1 suppliers.
- M&A Trends: The report analyzes recent mergers and acquisitions (M&A) activity within the sector, highlighting the strategic implications for market consolidation and technological advancements (xx M&A deals were recorded between 2019-2024). Innovation barriers include high R&D costs and stringent automotive qualification processes.
UFS and eMMC for Automotive Growth Trends & Insights
This section delves into the historical and projected growth of the UFS and eMMC for automotive market. The analysis leverages a combination of secondary research, expert interviews, and proprietary databases to provide a comprehensive understanding of market size evolution, adoption rates, technological disruptions, and consumer behavior shifts. Key metrics such as CAGR and market penetration are analyzed for the period 2019-2033. The report demonstrates a consistent growth trajectory, with the market expected to expand significantly due to increasing adoption of advanced driver-assistance systems (ADAS) and infotainment features in vehicles. The CAGR during the forecast period (2025-2033) is projected to be xx%. Market penetration for UFS and eMMC in automotive applications is expected to reach xx% by 2033.
Dominant Regions, Countries, or Segments in UFS and eMMC for Automotive
This section pinpoints the leading geographical regions and segments driving market expansion. The report identifies [Region X] as the dominant region, accounting for approximately xx% of the global market in 2025. This dominance is attributed to:
- Robust Automotive Industry: A large and well-established automotive manufacturing base contributes to high demand for UFS and eMMC.
- Government Initiatives: Supportive government policies and incentives for technological advancements in the automotive sector accelerate adoption.
- Infrastructure Development: Advanced infrastructure for research and development, as well as manufacturing facilities, ensures smooth production and distribution.
Other key regions are analyzed with respect to their market share and growth potential. Specific factors impacting growth in each region are explored.
UFS and eMMC for Automotive Product Landscape
The UFS and eMMC product landscape is characterized by ongoing innovation, with manufacturers focusing on increasing storage capacity, improving data transfer speeds, and enhancing power efficiency. New product innovations include UFS 4.0 and eMMC 6.0, which offer significant performance improvements over their predecessors. Key applications include infotainment systems, ADAS, digital instrument clusters, and telematics units. The unique selling propositions (USPs) include high reliability, durability, and data security features crucial for automotive applications.
Key Drivers, Barriers & Challenges in UFS and eMMC for Automotive
Key Drivers:
- Increasing demand for higher data storage capacity due to the rising adoption of ADAS features and advanced infotainment systems.
- Technological advancements leading to better performance and lower power consumption.
- Government regulations mandating increased safety and data security features in vehicles.
Key Challenges and Restraints:
- High manufacturing costs for advanced UFS and eMMC solutions, limiting widespread adoption in low-cost vehicle segments.
- Intense competition among established players and new entrants.
- Supply chain disruptions that can impact production and delivery timelines. The COVID-19 pandemic demonstrated the vulnerability of the supply chain (estimated impact of xx million units in 2020).
Emerging Opportunities in UFS and eMMC for Automotive
Emerging trends and opportunities include the rising demand for high-performance memory solutions for autonomous driving applications, the increasing popularity of connected cars, and the growth of the electric vehicle (EV) market. Untapped markets in developing economies also present significant potential. Innovations in memory technology, such as 3D NAND, will create further opportunities.
Growth Accelerators in the UFS and eMMC for Automotive Industry
Long-term growth will be fueled by technological breakthroughs in memory density and performance, leading to more sophisticated automotive applications. Strategic partnerships between memory manufacturers and automotive companies will also play a significant role in market expansion. Aggressive expansion into new geographical markets and further product diversification will accelerate market growth.
Key Players Shaping the UFS and eMMC for Automotive Market
- KIOXIA
- Micron Technology
- Samsung
- Toshiba
- Western Digital
- AMP Inc
- Silicon Motion
- Longsys
Notable Milestones in UFS and eMMC for Automotive Sector
- 2020 Q4: KIOXIA launched its next-generation UFS memory for automotive applications.
- 2021 Q2: Samsung announced a strategic partnership with a major automotive OEM to develop high-performance memory solutions.
- 2022 Q3: Micron Technology introduced a new eMMC with enhanced reliability and security features.
- Further milestones will be added based on the latest market developments.
In-Depth UFS and eMMC for Automotive Market Outlook
The future of the UFS and eMMC for automotive market appears bright, driven by the ongoing technological advancements and increasing demand for advanced automotive features. Strategic opportunities exist for companies that can innovate, differentiate their products, and effectively manage the complexities of the automotive supply chain. The market is projected for continued strong growth, exceeding xx million units by 2033, presenting a lucrative opportunity for investors and industry players.
Ufs And E Mmc For Automotive Segmentation
-
1. Application
- 1.1. Vehicle Infotainment Systems
- 1.2. Advanced Driver Assistance Systems (ADAS)
- 1.3. Telematics Control Unit (T-box)
-
2. Type
- 2.1. UFS
- 2.2. e-MMC
Ufs And E Mmc For Automotive Segmentation By Geography
-
1. North America
- 1.1. United States
- 1.2. Canada
- 1.3. Mexico
-
2. South America
- 2.1. Brazil
- 2.2. Argentina
- 2.3. Rest of South America
-
3. Europe
- 3.1. United Kingdom
- 3.2. Germany
- 3.3. France
- 3.4. Italy
- 3.5. Spain
- 3.6. Russia
- 3.7. Benelux
- 3.8. Nordics
- 3.9. Rest of Europe
-
4. Middle East & Africa
- 4.1. Turkey
- 4.2. Israel
- 4.3. GCC
- 4.4. North Africa
- 4.5. South Africa
- 4.6. Rest of Middle East & Africa
-
5. Asia Pacific
- 5.1. China
- 5.2. India
- 5.3. Japan
- 5.4. South Korea
- 5.5. ASEAN
- 5.6. Oceania
- 5.7. Rest of Asia Pacific
Ufs And E Mmc For Automotive Regional Market Share
Geographic Coverage of Ufs And E Mmc For Automotive
Ufs And E Mmc For Automotive REPORT HIGHLIGHTS
| Aspects | Details |
|---|---|
| Study Period | 2020-2034 |
| Base Year | 2025 |
| Estimated Year | 2026 |
| Forecast Period | 2026-2034 |
| Historical Period | 2020-2025 |
| Growth Rate | CAGR of XXX% from 2020-2034 |
| Segmentation |
|
Table of Contents
- 1. Introduction
- 1.1. Research Scope
- 1.2. Market Segmentation
- 1.3. Research Methodology
- 1.4. Definitions and Assumptions
- 2. Executive Summary
- 2.1. Introduction
- 3. Market Dynamics
- 3.1. Introduction
- 3.2. Market Drivers
- 3.3. Market Restrains
- 3.4. Market Trends
- 4. Market Factor Analysis
- 4.1. Porters Five Forces
- 4.2. Supply/Value Chain
- 4.3. PESTEL analysis
- 4.4. Market Entropy
- 4.5. Patent/Trademark Analysis
- 5. Global Ufs And E Mmc For Automotive Analysis, Insights and Forecast, 2020-2032
- 5.1. Market Analysis, Insights and Forecast - by Application
- 5.1.1. Vehicle Infotainment Systems
- 5.1.2. Advanced Driver Assistance Systems (ADAS)
- 5.1.3. Telematics Control Unit (T-box)
- 5.2. Market Analysis, Insights and Forecast - by Type
- 5.2.1. UFS
- 5.2.2. e-MMC
- 5.3. Market Analysis, Insights and Forecast - by Region
- 5.3.1. North America
- 5.3.2. South America
- 5.3.3. Europe
- 5.3.4. Middle East & Africa
- 5.3.5. Asia Pacific
- 5.1. Market Analysis, Insights and Forecast - by Application
- 6. North America Ufs And E Mmc For Automotive Analysis, Insights and Forecast, 2020-2032
- 6.1. Market Analysis, Insights and Forecast - by Application
- 6.1.1. Vehicle Infotainment Systems
- 6.1.2. Advanced Driver Assistance Systems (ADAS)
- 6.1.3. Telematics Control Unit (T-box)
- 6.2. Market Analysis, Insights and Forecast - by Type
- 6.2.1. UFS
- 6.2.2. e-MMC
- 6.1. Market Analysis, Insights and Forecast - by Application
- 7. South America Ufs And E Mmc For Automotive Analysis, Insights and Forecast, 2020-2032
- 7.1. Market Analysis, Insights and Forecast - by Application
- 7.1.1. Vehicle Infotainment Systems
- 7.1.2. Advanced Driver Assistance Systems (ADAS)
- 7.1.3. Telematics Control Unit (T-box)
- 7.2. Market Analysis, Insights and Forecast - by Type
- 7.2.1. UFS
- 7.2.2. e-MMC
- 7.1. Market Analysis, Insights and Forecast - by Application
- 8. Europe Ufs And E Mmc For Automotive Analysis, Insights and Forecast, 2020-2032
- 8.1. Market Analysis, Insights and Forecast - by Application
- 8.1.1. Vehicle Infotainment Systems
- 8.1.2. Advanced Driver Assistance Systems (ADAS)
- 8.1.3. Telematics Control Unit (T-box)
- 8.2. Market Analysis, Insights and Forecast - by Type
- 8.2.1. UFS
- 8.2.2. e-MMC
- 8.1. Market Analysis, Insights and Forecast - by Application
- 9. Middle East & Africa Ufs And E Mmc For Automotive Analysis, Insights and Forecast, 2020-2032
- 9.1. Market Analysis, Insights and Forecast - by Application
- 9.1.1. Vehicle Infotainment Systems
- 9.1.2. Advanced Driver Assistance Systems (ADAS)
- 9.1.3. Telematics Control Unit (T-box)
- 9.2. Market Analysis, Insights and Forecast - by Type
- 9.2.1. UFS
- 9.2.2. e-MMC
- 9.1. Market Analysis, Insights and Forecast - by Application
- 10. Asia Pacific Ufs And E Mmc For Automotive Analysis, Insights and Forecast, 2020-2032
- 10.1. Market Analysis, Insights and Forecast - by Application
- 10.1.1. Vehicle Infotainment Systems
- 10.1.2. Advanced Driver Assistance Systems (ADAS)
- 10.1.3. Telematics Control Unit (T-box)
- 10.2. Market Analysis, Insights and Forecast - by Type
- 10.2.1. UFS
- 10.2.2. e-MMC
- 10.1. Market Analysis, Insights and Forecast - by Application
- 11. Competitive Analysis
- 11.1. Global Market Share Analysis 2025
- 11.2. Company Profiles
- 11.2.1 KIOXIA
- 11.2.1.1. Overview
- 11.2.1.2. Products
- 11.2.1.3. SWOT Analysis
- 11.2.1.4. Recent Developments
- 11.2.1.5. Financials (Based on Availability)
- 11.2.2 Micron Technology
- 11.2.2.1. Overview
- 11.2.2.2. Products
- 11.2.2.3. SWOT Analysis
- 11.2.2.4. Recent Developments
- 11.2.2.5. Financials (Based on Availability)
- 11.2.3 Samsung
- 11.2.3.1. Overview
- 11.2.3.2. Products
- 11.2.3.3. SWOT Analysis
- 11.2.3.4. Recent Developments
- 11.2.3.5. Financials (Based on Availability)
- 11.2.4 Toshiba
- 11.2.4.1. Overview
- 11.2.4.2. Products
- 11.2.4.3. SWOT Analysis
- 11.2.4.4. Recent Developments
- 11.2.4.5. Financials (Based on Availability)
- 11.2.5 Western Digital
- 11.2.5.1. Overview
- 11.2.5.2. Products
- 11.2.5.3. SWOT Analysis
- 11.2.5.4. Recent Developments
- 11.2.5.5. Financials (Based on Availability)
- 11.2.6 AMP Inc
- 11.2.6.1. Overview
- 11.2.6.2. Products
- 11.2.6.3. SWOT Analysis
- 11.2.6.4. Recent Developments
- 11.2.6.5. Financials (Based on Availability)
- 11.2.7 Silicon Motion
- 11.2.7.1. Overview
- 11.2.7.2. Products
- 11.2.7.3. SWOT Analysis
- 11.2.7.4. Recent Developments
- 11.2.7.5. Financials (Based on Availability)
- 11.2.8 Longsys
- 11.2.8.1. Overview
- 11.2.8.2. Products
- 11.2.8.3. SWOT Analysis
- 11.2.8.4. Recent Developments
- 11.2.8.5. Financials (Based on Availability)
- 11.2.1 KIOXIA
List of Figures
- Figure 1: Global Ufs And E Mmc For Automotive Revenue Breakdown (million, %) by Region 2025 & 2033
- Figure 2: North America Ufs And E Mmc For Automotive Revenue (million), by Application 2025 & 2033
- Figure 3: North America Ufs And E Mmc For Automotive Revenue Share (%), by Application 2025 & 2033
- Figure 4: North America Ufs And E Mmc For Automotive Revenue (million), by Type 2025 & 2033
- Figure 5: North America Ufs And E Mmc For Automotive Revenue Share (%), by Type 2025 & 2033
- Figure 6: North America Ufs And E Mmc For Automotive Revenue (million), by Country 2025 & 2033
- Figure 7: North America Ufs And E Mmc For Automotive Revenue Share (%), by Country 2025 & 2033
- Figure 8: South America Ufs And E Mmc For Automotive Revenue (million), by Application 2025 & 2033
- Figure 9: South America Ufs And E Mmc For Automotive Revenue Share (%), by Application 2025 & 2033
- Figure 10: South America Ufs And E Mmc For Automotive Revenue (million), by Type 2025 & 2033
- Figure 11: South America Ufs And E Mmc For Automotive Revenue Share (%), by Type 2025 & 2033
- Figure 12: South America Ufs And E Mmc For Automotive Revenue (million), by Country 2025 & 2033
- Figure 13: South America Ufs And E Mmc For Automotive Revenue Share (%), by Country 2025 & 2033
- Figure 14: Europe Ufs And E Mmc For Automotive Revenue (million), by Application 2025 & 2033
- Figure 15: Europe Ufs And E Mmc For Automotive Revenue Share (%), by Application 2025 & 2033
- Figure 16: Europe Ufs And E Mmc For Automotive Revenue (million), by Type 2025 & 2033
- Figure 17: Europe Ufs And E Mmc For Automotive Revenue Share (%), by Type 2025 & 2033
- Figure 18: Europe Ufs And E Mmc For Automotive Revenue (million), by Country 2025 & 2033
- Figure 19: Europe Ufs And E Mmc For Automotive Revenue Share (%), by Country 2025 & 2033
- Figure 20: Middle East & Africa Ufs And E Mmc For Automotive Revenue (million), by Application 2025 & 2033
- Figure 21: Middle East & Africa Ufs And E Mmc For Automotive Revenue Share (%), by Application 2025 & 2033
- Figure 22: Middle East & Africa Ufs And E Mmc For Automotive Revenue (million), by Type 2025 & 2033
- Figure 23: Middle East & Africa Ufs And E Mmc For Automotive Revenue Share (%), by Type 2025 & 2033
- Figure 24: Middle East & Africa Ufs And E Mmc For Automotive Revenue (million), by Country 2025 & 2033
- Figure 25: Middle East & Africa Ufs And E Mmc For Automotive Revenue Share (%), by Country 2025 & 2033
- Figure 26: Asia Pacific Ufs And E Mmc For Automotive Revenue (million), by Application 2025 & 2033
- Figure 27: Asia Pacific Ufs And E Mmc For Automotive Revenue Share (%), by Application 2025 & 2033
- Figure 28: Asia Pacific Ufs And E Mmc For Automotive Revenue (million), by Type 2025 & 2033
- Figure 29: Asia Pacific Ufs And E Mmc For Automotive Revenue Share (%), by Type 2025 & 2033
- Figure 30: Asia Pacific Ufs And E Mmc For Automotive Revenue (million), by Country 2025 & 2033
- Figure 31: Asia Pacific Ufs And E Mmc For Automotive Revenue Share (%), by Country 2025 & 2033
List of Tables
- Table 1: Global Ufs And E Mmc For Automotive Revenue million Forecast, by Application 2020 & 2033
- Table 2: Global Ufs And E Mmc For Automotive Revenue million Forecast, by Type 2020 & 2033
- Table 3: Global Ufs And E Mmc For Automotive Revenue million Forecast, by Region 2020 & 2033
- Table 4: Global Ufs And E Mmc For Automotive Revenue million Forecast, by Application 2020 & 2033
- Table 5: Global Ufs And E Mmc For Automotive Revenue million Forecast, by Type 2020 & 2033
- Table 6: Global Ufs And E Mmc For Automotive Revenue million Forecast, by Country 2020 & 2033
- Table 7: United States Ufs And E Mmc For Automotive Revenue (million) Forecast, by Application 2020 & 2033
- Table 8: Canada Ufs And E Mmc For Automotive Revenue (million) Forecast, by Application 2020 & 2033
- Table 9: Mexico Ufs And E Mmc For Automotive Revenue (million) Forecast, by Application 2020 & 2033
- Table 10: Global Ufs And E Mmc For Automotive Revenue million Forecast, by Application 2020 & 2033
- Table 11: Global Ufs And E Mmc For Automotive Revenue million Forecast, by Type 2020 & 2033
- Table 12: Global Ufs And E Mmc For Automotive Revenue million Forecast, by Country 2020 & 2033
- Table 13: Brazil Ufs And E Mmc For Automotive Revenue (million) Forecast, by Application 2020 & 2033
- Table 14: Argentina Ufs And E Mmc For Automotive Revenue (million) Forecast, by Application 2020 & 2033
- Table 15: Rest of South America Ufs And E Mmc For Automotive Revenue (million) Forecast, by Application 2020 & 2033
- Table 16: Global Ufs And E Mmc For Automotive Revenue million Forecast, by Application 2020 & 2033
- Table 17: Global Ufs And E Mmc For Automotive Revenue million Forecast, by Type 2020 & 2033
- Table 18: Global Ufs And E Mmc For Automotive Revenue million Forecast, by Country 2020 & 2033
- Table 19: United Kingdom Ufs And E Mmc For Automotive Revenue (million) Forecast, by Application 2020 & 2033
- Table 20: Germany Ufs And E Mmc For Automotive Revenue (million) Forecast, by Application 2020 & 2033
- Table 21: France Ufs And E Mmc For Automotive Revenue (million) Forecast, by Application 2020 & 2033
- Table 22: Italy Ufs And E Mmc For Automotive Revenue (million) Forecast, by Application 2020 & 2033
- Table 23: Spain Ufs And E Mmc For Automotive Revenue (million) Forecast, by Application 2020 & 2033
- Table 24: Russia Ufs And E Mmc For Automotive Revenue (million) Forecast, by Application 2020 & 2033
- Table 25: Benelux Ufs And E Mmc For Automotive Revenue (million) Forecast, by Application 2020 & 2033
- Table 26: Nordics Ufs And E Mmc For Automotive Revenue (million) Forecast, by Application 2020 & 2033
- Table 27: Rest of Europe Ufs And E Mmc For Automotive Revenue (million) Forecast, by Application 2020 & 2033
- Table 28: Global Ufs And E Mmc For Automotive Revenue million Forecast, by Application 2020 & 2033
- Table 29: Global Ufs And E Mmc For Automotive Revenue million Forecast, by Type 2020 & 2033
- Table 30: Global Ufs And E Mmc For Automotive Revenue million Forecast, by Country 2020 & 2033
- Table 31: Turkey Ufs And E Mmc For Automotive Revenue (million) Forecast, by Application 2020 & 2033
- Table 32: Israel Ufs And E Mmc For Automotive Revenue (million) Forecast, by Application 2020 & 2033
- Table 33: GCC Ufs And E Mmc For Automotive Revenue (million) Forecast, by Application 2020 & 2033
- Table 34: North Africa Ufs And E Mmc For Automotive Revenue (million) Forecast, by Application 2020 & 2033
- Table 35: South Africa Ufs And E Mmc For Automotive Revenue (million) Forecast, by Application 2020 & 2033
- Table 36: Rest of Middle East & Africa Ufs And E Mmc For Automotive Revenue (million) Forecast, by Application 2020 & 2033
- Table 37: Global Ufs And E Mmc For Automotive Revenue million Forecast, by Application 2020 & 2033
- Table 38: Global Ufs And E Mmc For Automotive Revenue million Forecast, by Type 2020 & 2033
- Table 39: Global Ufs And E Mmc For Automotive Revenue million Forecast, by Country 2020 & 2033
- Table 40: China Ufs And E Mmc For Automotive Revenue (million) Forecast, by Application 2020 & 2033
- Table 41: India Ufs And E Mmc For Automotive Revenue (million) Forecast, by Application 2020 & 2033
- Table 42: Japan Ufs And E Mmc For Automotive Revenue (million) Forecast, by Application 2020 & 2033
- Table 43: South Korea Ufs And E Mmc For Automotive Revenue (million) Forecast, by Application 2020 & 2033
- Table 44: ASEAN Ufs And E Mmc For Automotive Revenue (million) Forecast, by Application 2020 & 2033
- Table 45: Oceania Ufs And E Mmc For Automotive Revenue (million) Forecast, by Application 2020 & 2033
- Table 46: Rest of Asia Pacific Ufs And E Mmc For Automotive Revenue (million) Forecast, by Application 2020 & 2033
Frequently Asked Questions
1. What is the projected Compound Annual Growth Rate (CAGR) of the Ufs And E Mmc For Automotive?
The projected CAGR is approximately XXX%.
2. Which companies are prominent players in the Ufs And E Mmc For Automotive?
Key companies in the market include KIOXIA, Micron Technology, Samsung, Toshiba, Western Digital, AMP Inc, Silicon Motion, Longsys.
3. What are the main segments of the Ufs And E Mmc For Automotive?
The market segments include Application, Type.
4. Can you provide details about the market size?
The market size is estimated to be USD XXX million as of 2022.
5. What are some drivers contributing to market growth?
N/A
6. What are the notable trends driving market growth?
N/A
7. Are there any restraints impacting market growth?
N/A
8. Can you provide examples of recent developments in the market?
N/A
9. What pricing options are available for accessing the report?
Pricing options include single-user, multi-user, and enterprise licenses priced at USD 2900.00, USD 4350.00, and USD 5800.00 respectively.
10. Is the market size provided in terms of value or volume?
The market size is provided in terms of value, measured in million.
11. Are there any specific market keywords associated with the report?
Yes, the market keyword associated with the report is "Ufs And E Mmc For Automotive," which aids in identifying and referencing the specific market segment covered.
12. How do I determine which pricing option suits my needs best?
The pricing options vary based on user requirements and access needs. Individual users may opt for single-user licenses, while businesses requiring broader access may choose multi-user or enterprise licenses for cost-effective access to the report.
13. Are there any additional resources or data provided in the Ufs And E Mmc For Automotive report?
While the report offers comprehensive insights, it's advisable to review the specific contents or supplementary materials provided to ascertain if additional resources or data are available.
14. How can I stay updated on further developments or reports in the Ufs And E Mmc For Automotive?
To stay informed about further developments, trends, and reports in the Ufs And E Mmc For Automotive, consider subscribing to industry newsletters, following relevant companies and organizations, or regularly checking reputable industry news sources and publications.
Methodology
Step 1 - Identification of Relevant Samples Size from Population Database


Step 2 - Approaches for Defining Global Market Size (Value, Volume* & Price*)

Note*: In applicable scenarios
Step 3 - Data Sources
Primary Research
- Web Analytics
- Survey Reports
- Research Institute
- Latest Research Reports
- Opinion Leaders
Secondary Research
- Annual Reports
- White Paper
- Latest Press Release
- Industry Association
- Paid Database
- Investor Presentations

Step 4 - Data Triangulation
Involves using different sources of information in order to increase the validity of a study
These sources are likely to be stakeholders in a program - participants, other researchers, program staff, other community members, and so on.
Then we put all data in single framework & apply various statistical tools to find out the dynamic on the market.
During the analysis stage, feedback from the stakeholder groups would be compared to determine areas of agreement as well as areas of divergence