

Key Insights
The US cross-border transportation services market, including trucking, courier, and express services, is projected for significant expansion. Driven by increasing US international trade, particularly with North American and Mexican partners, and the accelerating growth of e-commerce, the demand for swift and dependable delivery is a key market influencer. Expanding manufacturing, automotive, energy, and agricultural sectors further necessitate efficient cross-border logistics. While Full Truck Load (FTL) and Less-than-Truckload (LTL) segments lead, the Courier, Express, and Parcel (CEP) segment is rapidly advancing due to e-commerce expansion. Leading companies like J.B. Hunt, DB Schenker, UPS, and FedEx are optimizing operations through technological integration and strategic alliances. Regional growth is strong in the Northeast, Southeast, and West Coast, owing to high trade volumes and established infrastructure. Key challenges include volatile fuel prices, border security, and potential supply chain disruptions. Despite these, the US cross-border transportation services market anticipates sustained positive growth, supported by economic expansion and a growing reliance on international trade.
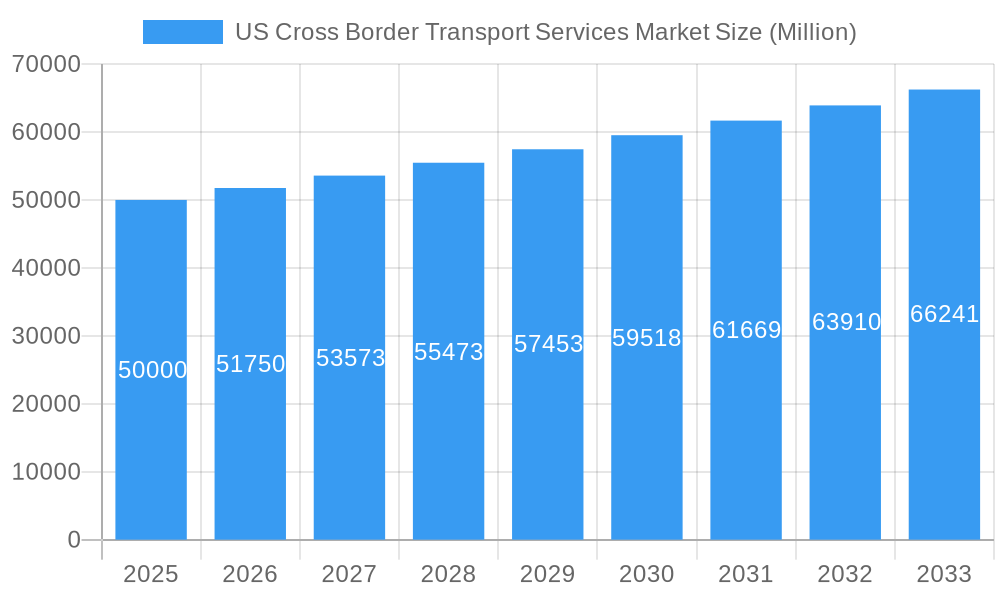
US Cross Border Transport Services Market Market Size (In Billion)
The market, valued at 282.7 billion in the base year 2025, is expected to grow at a Compound Annual Growth Rate (CAGR) of 6% through 2033. To thrive in this competitive landscape, companies must prioritize advanced technology, robust infrastructure, and efficient operational strategies. Navigating complex cross-border regulations and security protocols presents both challenges and opportunities for innovation. Investment in technologies such as GPS tracking, route optimization software, and data analytics is crucial for enhancing efficiency, reducing costs, and improving customer satisfaction. Furthermore, the development of sustainable transportation solutions is increasingly vital, driven by environmental consciousness and regulatory mandates. Future success hinges on adaptability to evolving market dynamics, embracing technological advancements, and delivering reliable, efficient cross-border transportation solutions.
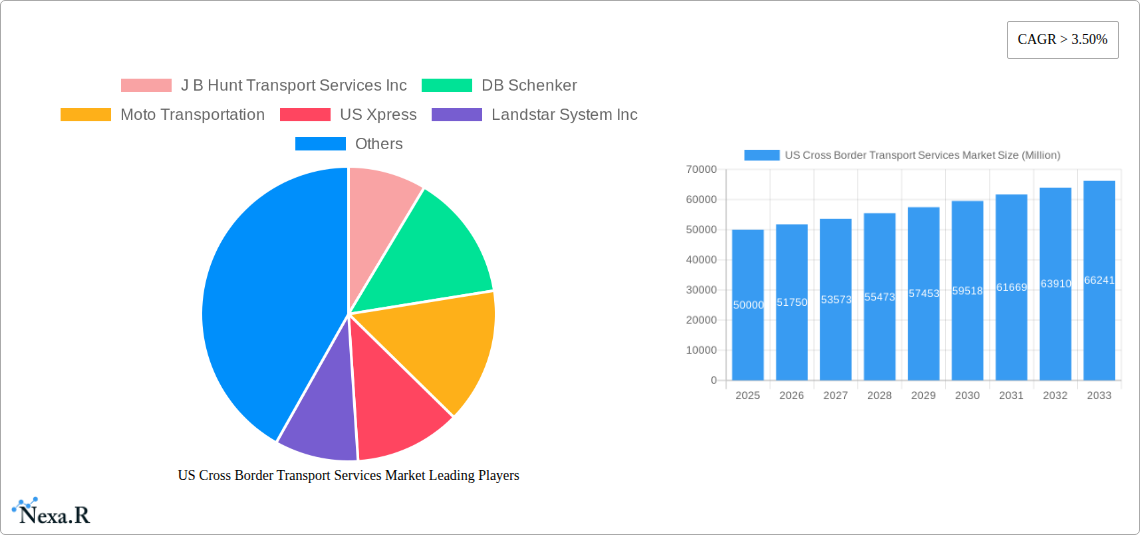
US Cross Border Transport Services Market Company Market Share
US Cross Border Transport Services Market Report: 2019-2033
This comprehensive report provides an in-depth analysis of the US Cross Border Transport Services Market, encompassing market dynamics, growth trends, dominant segments, and key players. The study period covers 2019-2033, with 2025 as the base and estimated year. This report is crucial for industry professionals, investors, and strategists seeking to understand and capitalize on opportunities within this dynamic sector. The market is segmented by end-user (Manufacturing & Automotive, Oil & Gas, Mining & Quarrying, Agriculture, Fishing & Forestry, Construction, Distributive Trade, Other End Users) and service type (FTL, LTL, CEP). The total market size in 2025 is estimated at xx Million, with a projected CAGR of xx% from 2025 to 2033.
US Cross Border Transport Services Market Dynamics & Structure
The US cross-border transport services market is characterized by a moderately concentrated structure, with key players like J B Hunt Transport Services Inc, DB Schenker, and FedEx holding significant market share. However, the market also accommodates numerous smaller, specialized carriers. Technological innovation, driven by advancements in telematics, route optimization software, and autonomous vehicle technology, is a major driver of market growth and efficiency. Stringent regulatory frameworks, including safety regulations and customs procedures, influence operational costs and compliance. Competitive pressures from alternative transportation modes (rail, maritime) and the increasing adoption of e-commerce necessitate continuous adaptation and innovation. Mergers and acquisitions (M&A) activity, as evidenced by recent deals like DB Schenker's acquisition of USA Truck, play a significant role in market consolidation and expansion.
- Market Concentration: Moderately concentrated, with top players holding xx% market share (2025).
- Technological Innovation: Focus on telematics, route optimization, and autonomous vehicles.
- Regulatory Framework: Stringent safety and customs regulations impacting operational costs.
- M&A Activity: Significant consolidation through acquisitions; xx major deals in the last 5 years.
- Competitive Substitutes: Rail, maritime, and intermodal transportation posing competitive pressure.
- End-User Demographics: Manufacturing and Automotive remains the largest segment, followed by Distributive Trade.
US Cross Border Transport Services Market Growth Trends & Insights
The US cross-border transport services market experienced substantial growth between 2019 and 2024, driven by factors such as increased cross-border trade, expanding e-commerce activity, and the rising demand for efficient supply chain solutions. The market size reached xx million in 2024, exhibiting a CAGR of xx% during the historical period (2019-2024). The forecast period (2025-2033) projects continued growth, driven by technological advancements, increasing trade volumes, and the expansion of logistics networks. Consumer behavior shifts towards faster delivery times and increased transparency in the supply chain also fuel market demand. Technological disruptions, such as the integration of blockchain technology for enhanced security and transparency, are expected to further optimize supply chain operations and boost efficiency. Market penetration of advanced technologies is expected to increase to xx% by 2033.
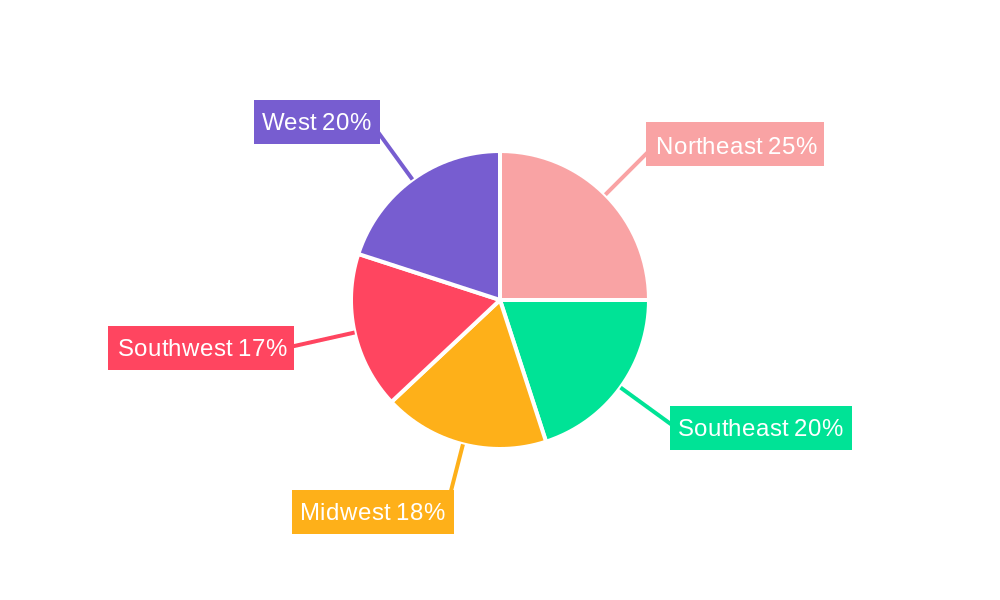
Dominant Regions, Countries, or Segments in US Cross Border Transport Services Market
The Manufacturing and Automotive sector dominates the end-user segment, contributing xx% to the total market value in 2025. This is driven by the high volume of cross-border transportation of manufactured goods and automotive parts. The FTL (Full Truck Load) service type holds the largest market share among service segments, accounting for approximately xx% in 2025. The strong growth in e-commerce and expedited delivery expectations contributes to the substantial market share of the CEP (Courier, Express, and Parcel) segment, with a projected growth rate of xx% over the forecast period. Border regions, particularly those with high trade volumes with Mexico and Canada, exhibit significant growth potential.
- End-User Segment: Manufacturing and Automotive (xx%), Distributive Trade (xx%)
- Service Type: FTL (xx%), CEP (xx%)
- Regional Dominance: Border regions with Mexico and Canada show highest growth potential.
- Key Drivers: Increased cross-border trade, growth of e-commerce, improving infrastructure.
US Cross Border Transport Services Market Product Landscape
The US cross-border transport services market showcases significant product innovation, including advanced telematics systems, route optimization software, and the incorporation of IoT (Internet of Things) devices for real-time shipment tracking and improved visibility. These innovations enhance operational efficiency, reduce transit times, and improve overall supply chain performance. The emergence of autonomous vehicles and drone technologies holds significant potential for revolutionizing the industry, however widespread adoption still requires time to overcome logistical and regulatory hurdles.
Key Drivers, Barriers & Challenges in US Cross Border Transport Services Market
Key Drivers: Increased cross-border trade volume, the burgeoning e-commerce sector, and advancements in logistics technology are major drivers. Government initiatives promoting infrastructure development and streamlined customs procedures further stimulate growth.
Key Barriers & Challenges: Supply chain disruptions due to geopolitical events and pandemics, increased fuel prices, driver shortages, and stringent regulatory compliance requirements pose significant challenges. These factors can lead to increased operational costs and potential delays in delivery. Intense competition among carriers can also compress profit margins.
Emerging Opportunities in US Cross Border Transport Services Market
The growing adoption of sustainable transport solutions, increased demand for specialized services (e.g., temperature-controlled transport), and the expansion into untapped markets in smaller border towns present significant growth opportunities. The integration of blockchain technology for improved transparency and security also represents a promising avenue for market expansion.
Growth Accelerators in the US Cross Border Transport Services Market Industry
Technological breakthroughs, particularly in areas like autonomous vehicles and advanced logistics software, are expected to significantly accelerate market growth. Strategic partnerships between logistics providers and technology companies can further enhance efficiency and competitiveness. The expansion of cross-border trade agreements and initiatives aimed at improving infrastructure will also fuel long-term growth.
Key Players Shaping the US Cross Border Transport Services Market Market
- J B Hunt Transport Services Inc
- DB Schenker
- Moto Transportation
- US Xpress
- Landstar System Inc
- C H Robinson
- United Parcel Service (UPS)
- YRC Worldwide Inc
- Schneider National
- FedEx
- Polaris Transportation Group
- Hitachi Transport System
- Swift Transportation Company
- XPO Logistics Inc
Notable Milestones in US Cross Border Transport Services Market Sector
- October 2022: KAG Logistics acquires Connectrans Logistics, expanding its Canadian and US cross-border operations.
- September 2022: DB Schenker acquires USA Truck for USD 435 million, significantly boosting its US capacity and network.
In-Depth US Cross Border Transport Services Market Market Outlook
The US cross-border transport services market is poised for continued growth, driven by factors such as expanding e-commerce, advancements in technology, and favorable government policies. Strategic investments in infrastructure, technological innovation, and sustainable transportation solutions will play a critical role in shaping the future of this dynamic market. The potential for further consolidation through M&A activity and the emergence of new business models in the rapidly evolving landscape offer significant opportunities for both established players and emerging companies.
US Cross Border Transport Services Market Segmentation
-
1. Service
- 1.1. Full Truck Load (FTL)
- 1.2. Less-than Truckload (LTL)
- 1.3. Courier, Express, and Parcel (CEP)
-
2. End-user
- 2.1. Manufacturing and Automotive
- 2.2. Oil and Gas, Mining, and Quarrying
- 2.3. Agriculture, Fishing, and Forestry
- 2.4. Construction
- 2.5. Distribu
- 2.6. Other En
US Cross Border Transport Services Market Segmentation By Geography
-
1. North America
- 1.1. United States
- 1.2. Canada
- 1.3. Mexico
-
2. South America
- 2.1. Brazil
- 2.2. Argentina
- 2.3. Rest of South America
-
3. Europe
- 3.1. United Kingdom
- 3.2. Germany
- 3.3. France
- 3.4. Italy
- 3.5. Spain
- 3.6. Russia
- 3.7. Benelux
- 3.8. Nordics
- 3.9. Rest of Europe
-
4. Middle East & Africa
- 4.1. Turkey
- 4.2. Israel
- 4.3. GCC
- 4.4. North Africa
- 4.5. South Africa
- 4.6. Rest of Middle East & Africa
-
5. Asia Pacific
- 5.1. China
- 5.2. India
- 5.3. Japan
- 5.4. South Korea
- 5.5. ASEAN
- 5.6. Oceania
- 5.7. Rest of Asia Pacific
US Cross Border Transport Services Market Regional Market Share
Geographic Coverage of US Cross Border Transport Services Market
US Cross Border Transport Services Market REPORT HIGHLIGHTS
| Aspects | Details |
|---|---|
| Study Period | 2020-2034 |
| Base Year | 2025 |
| Estimated Year | 2026 |
| Forecast Period | 2026-2034 |
| Historical Period | 2020-2025 |
| Growth Rate | CAGR of 6% from 2020-2034 |
| Segmentation |
|
Table of Contents
- 1. Introduction
- 1.1. Research Scope
- 1.2. Market Segmentation
- 1.3. Research Objective
- 1.4. Definitions and Assumptions
- 2. Executive Summary
- 2.1. Market Snapshot
- 3. Market Dynamics
- 3.1. Market Drivers
- 3.2. Market Restrains
- 3.3. Market Trends
- 3.4. Market Opportunities
- 4. Market Factor Analysis
- 4.1. Porters Five Forces
- 4.1.1. Bargaining Power of Suppliers
- 4.1.2. Bargaining Power of Buyers
- 4.1.3. Threat of New Entrants
- 4.1.4. Threat of Substitutes
- 4.1.5. Competitive Rivalry
- 4.2. PESTEL analysis
- 4.3. BCG Analysis
- 4.3.1. Stars (High Growth, High Market Share)
- 4.3.2. Cash Cows (Low Growth, High Market Share)
- 4.3.3. Question Mark (High Growth, Low Market Share)
- 4.3.4. Dogs (Low Growth, Low Market Share)
- 4.4. Ansoff Matrix Analysis
- 4.5. Supply Chain Analysis
- 4.6. Regulatory Landscape
- 4.7. Current Market Potential and Opportunity Assessment (TAM–SAM–SOM Framework)
- 4.8. NRP Analyst Note
- 4.1. Porters Five Forces
- 5. Market Analysis, Insights and Forecast 2021-2033
- 5.1. Market Analysis, Insights and Forecast - by Service
- 5.1.1. Full Truck Load (FTL)
- 5.1.2. Less-than Truckload (LTL)
- 5.1.3. Courier, Express, and Parcel (CEP)
- 5.2. Market Analysis, Insights and Forecast - by End-user
- 5.2.1. Manufacturing and Automotive
- 5.2.2. Oil and Gas, Mining, and Quarrying
- 5.2.3. Agriculture, Fishing, and Forestry
- 5.2.4. Construction
- 5.2.5. Distribu
- 5.2.6. Other En
- 5.3. Market Analysis, Insights and Forecast - by Region
- 5.3.1. North America
- 5.3.2. South America
- 5.3.3. Europe
- 5.3.4. Middle East & Africa
- 5.3.5. Asia Pacific
- 5.1. Market Analysis, Insights and Forecast - by Service
- 6. Global US Cross Border Transport Services Market Analysis, Insights and Forecast, 2021-2033
- 6.1. Market Analysis, Insights and Forecast - by Service
- 6.1.1. Full Truck Load (FTL)
- 6.1.2. Less-than Truckload (LTL)
- 6.1.3. Courier, Express, and Parcel (CEP)
- 6.2. Market Analysis, Insights and Forecast - by End-user
- 6.2.1. Manufacturing and Automotive
- 6.2.2. Oil and Gas, Mining, and Quarrying
- 6.2.3. Agriculture, Fishing, and Forestry
- 6.2.4. Construction
- 6.2.5. Distribu
- 6.2.6. Other En
- 6.1. Market Analysis, Insights and Forecast - by Service
- 7. North America US Cross Border Transport Services Market Analysis, Insights and Forecast, 2020-2032
- 7.1. Market Analysis, Insights and Forecast - by Service
- 7.1.1. Full Truck Load (FTL)
- 7.1.2. Less-than Truckload (LTL)
- 7.1.3. Courier, Express, and Parcel (CEP)
- 7.2. Market Analysis, Insights and Forecast - by End-user
- 7.2.1. Manufacturing and Automotive
- 7.2.2. Oil and Gas, Mining, and Quarrying
- 7.2.3. Agriculture, Fishing, and Forestry
- 7.2.4. Construction
- 7.2.5. Distribu
- 7.2.6. Other En
- 7.1. Market Analysis, Insights and Forecast - by Service
- 8. South America US Cross Border Transport Services Market Analysis, Insights and Forecast, 2020-2032
- 8.1. Market Analysis, Insights and Forecast - by Service
- 8.1.1. Full Truck Load (FTL)
- 8.1.2. Less-than Truckload (LTL)
- 8.1.3. Courier, Express, and Parcel (CEP)
- 8.2. Market Analysis, Insights and Forecast - by End-user
- 8.2.1. Manufacturing and Automotive
- 8.2.2. Oil and Gas, Mining, and Quarrying
- 8.2.3. Agriculture, Fishing, and Forestry
- 8.2.4. Construction
- 8.2.5. Distribu
- 8.2.6. Other En
- 8.1. Market Analysis, Insights and Forecast - by Service
- 9. Europe US Cross Border Transport Services Market Analysis, Insights and Forecast, 2020-2032
- 9.1. Market Analysis, Insights and Forecast - by Service
- 9.1.1. Full Truck Load (FTL)
- 9.1.2. Less-than Truckload (LTL)
- 9.1.3. Courier, Express, and Parcel (CEP)
- 9.2. Market Analysis, Insights and Forecast - by End-user
- 9.2.1. Manufacturing and Automotive
- 9.2.2. Oil and Gas, Mining, and Quarrying
- 9.2.3. Agriculture, Fishing, and Forestry
- 9.2.4. Construction
- 9.2.5. Distribu
- 9.2.6. Other En
- 9.1. Market Analysis, Insights and Forecast - by Service
- 10. Middle East & Africa US Cross Border Transport Services Market Analysis, Insights and Forecast, 2020-2032
- 10.1. Market Analysis, Insights and Forecast - by Service
- 10.1.1. Full Truck Load (FTL)
- 10.1.2. Less-than Truckload (LTL)
- 10.1.3. Courier, Express, and Parcel (CEP)
- 10.2. Market Analysis, Insights and Forecast - by End-user
- 10.2.1. Manufacturing and Automotive
- 10.2.2. Oil and Gas, Mining, and Quarrying
- 10.2.3. Agriculture, Fishing, and Forestry
- 10.2.4. Construction
- 10.2.5. Distribu
- 10.2.6. Other En
- 10.1. Market Analysis, Insights and Forecast - by Service
- 11. Asia Pacific US Cross Border Transport Services Market Analysis, Insights and Forecast, 2020-2032
- 11.1. Market Analysis, Insights and Forecast - by Service
- 11.1.1. Full Truck Load (FTL)
- 11.1.2. Less-than Truckload (LTL)
- 11.1.3. Courier, Express, and Parcel (CEP)
- 11.2. Market Analysis, Insights and Forecast - by End-user
- 11.2.1. Manufacturing and Automotive
- 11.2.2. Oil and Gas, Mining, and Quarrying
- 11.2.3. Agriculture, Fishing, and Forestry
- 11.2.4. Construction
- 11.2.5. Distribu
- 11.2.6. Other En
- 11.1. Market Analysis, Insights and Forecast - by Service
- 12. Competitive Analysis
- 12.1. Company Profiles
- 12.1.1 J B Hunt Transport Services Inc
- 12.1.1.1. Company Overview
- 12.1.1.2. Products
- 12.1.1.3. Company Financials
- 12.1.1.4. SWOT Analysis
- 12.1.2 DB Schenker
- 12.1.2.1. Company Overview
- 12.1.2.2. Products
- 12.1.2.3. Company Financials
- 12.1.2.4. SWOT Analysis
- 12.1.3 Moto Transportation
- 12.1.3.1. Company Overview
- 12.1.3.2. Products
- 12.1.3.3. Company Financials
- 12.1.3.4. SWOT Analysis
- 12.1.4 US Xpress
- 12.1.4.1. Company Overview
- 12.1.4.2. Products
- 12.1.4.3. Company Financials
- 12.1.4.4. SWOT Analysis
- 12.1.5 Landstar System Inc
- 12.1.5.1. Company Overview
- 12.1.5.2. Products
- 12.1.5.3. Company Financials
- 12.1.5.4. SWOT Analysis
- 12.1.6 C H Robinson
- 12.1.6.1. Company Overview
- 12.1.6.2. Products
- 12.1.6.3. Company Financials
- 12.1.6.4. SWOT Analysis
- 12.1.7 United Parcel Service (UPS)
- 12.1.7.1. Company Overview
- 12.1.7.2. Products
- 12.1.7.3. Company Financials
- 12.1.7.4. SWOT Analysis
- 12.1.8 YRC Worldwide Inc
- 12.1.8.1. Company Overview
- 12.1.8.2. Products
- 12.1.8.3. Company Financials
- 12.1.8.4. SWOT Analysis
- 12.1.9 Schneider National
- 12.1.9.1. Company Overview
- 12.1.9.2. Products
- 12.1.9.3. Company Financials
- 12.1.9.4. SWOT Analysis
- 12.1.10 FedEx
- 12.1.10.1. Company Overview
- 12.1.10.2. Products
- 12.1.10.3. Company Financials
- 12.1.10.4. SWOT Analysis
- 12.1.11 Polaris Transportation Group
- 12.1.11.1. Company Overview
- 12.1.11.2. Products
- 12.1.11.3. Company Financials
- 12.1.11.4. SWOT Analysis
- 12.1.12 Hitachi Transport System**List Not Exhaustive
- 12.1.12.1. Company Overview
- 12.1.12.2. Products
- 12.1.12.3. Company Financials
- 12.1.12.4. SWOT Analysis
- 12.1.13 Swift Transportation Company
- 12.1.13.1. Company Overview
- 12.1.13.2. Products
- 12.1.13.3. Company Financials
- 12.1.13.4. SWOT Analysis
- 12.1.14 XPO Logistics Inc
- 12.1.14.1. Company Overview
- 12.1.14.2. Products
- 12.1.14.3. Company Financials
- 12.1.14.4. SWOT Analysis
- 12.1.1 J B Hunt Transport Services Inc
- 12.2. Market Entropy
- 12.2.1 Company's Key Areas Served
- 12.2.2 Recent Developments
- 12.3. Company Market Share Analysis 2025
- 12.3.1 Top 5 Companies Market Share Analysis
- 12.3.2 Top 3 Companies Market Share Analysis
- 12.4. List of Potential Customers
- 13. Research Methodology
List of Figures
- Figure 1: Global US Cross Border Transport Services Market Revenue Breakdown (billion, %) by Region 2025 & 2033
- Figure 2: North America US Cross Border Transport Services Market Revenue (billion), by Service 2025 & 2033
- Figure 3: North America US Cross Border Transport Services Market Revenue Share (%), by Service 2025 & 2033
- Figure 4: North America US Cross Border Transport Services Market Revenue (billion), by End-user 2025 & 2033
- Figure 5: North America US Cross Border Transport Services Market Revenue Share (%), by End-user 2025 & 2033
- Figure 6: North America US Cross Border Transport Services Market Revenue (billion), by Country 2025 & 2033
- Figure 7: North America US Cross Border Transport Services Market Revenue Share (%), by Country 2025 & 2033
- Figure 8: South America US Cross Border Transport Services Market Revenue (billion), by Service 2025 & 2033
- Figure 9: South America US Cross Border Transport Services Market Revenue Share (%), by Service 2025 & 2033
- Figure 10: South America US Cross Border Transport Services Market Revenue (billion), by End-user 2025 & 2033
- Figure 11: South America US Cross Border Transport Services Market Revenue Share (%), by End-user 2025 & 2033
- Figure 12: South America US Cross Border Transport Services Market Revenue (billion), by Country 2025 & 2033
- Figure 13: South America US Cross Border Transport Services Market Revenue Share (%), by Country 2025 & 2033
- Figure 14: Europe US Cross Border Transport Services Market Revenue (billion), by Service 2025 & 2033
- Figure 15: Europe US Cross Border Transport Services Market Revenue Share (%), by Service 2025 & 2033
- Figure 16: Europe US Cross Border Transport Services Market Revenue (billion), by End-user 2025 & 2033
- Figure 17: Europe US Cross Border Transport Services Market Revenue Share (%), by End-user 2025 & 2033
- Figure 18: Europe US Cross Border Transport Services Market Revenue (billion), by Country 2025 & 2033
- Figure 19: Europe US Cross Border Transport Services Market Revenue Share (%), by Country 2025 & 2033
- Figure 20: Middle East & Africa US Cross Border Transport Services Market Revenue (billion), by Service 2025 & 2033
- Figure 21: Middle East & Africa US Cross Border Transport Services Market Revenue Share (%), by Service 2025 & 2033
- Figure 22: Middle East & Africa US Cross Border Transport Services Market Revenue (billion), by End-user 2025 & 2033
- Figure 23: Middle East & Africa US Cross Border Transport Services Market Revenue Share (%), by End-user 2025 & 2033
- Figure 24: Middle East & Africa US Cross Border Transport Services Market Revenue (billion), by Country 2025 & 2033
- Figure 25: Middle East & Africa US Cross Border Transport Services Market Revenue Share (%), by Country 2025 & 2033
- Figure 26: Asia Pacific US Cross Border Transport Services Market Revenue (billion), by Service 2025 & 2033
- Figure 27: Asia Pacific US Cross Border Transport Services Market Revenue Share (%), by Service 2025 & 2033
- Figure 28: Asia Pacific US Cross Border Transport Services Market Revenue (billion), by End-user 2025 & 2033
- Figure 29: Asia Pacific US Cross Border Transport Services Market Revenue Share (%), by End-user 2025 & 2033
- Figure 30: Asia Pacific US Cross Border Transport Services Market Revenue (billion), by Country 2025 & 2033
- Figure 31: Asia Pacific US Cross Border Transport Services Market Revenue Share (%), by Country 2025 & 2033
List of Tables
- Table 1: Global US Cross Border Transport Services Market Revenue billion Forecast, by Service 2020 & 2033
- Table 2: Global US Cross Border Transport Services Market Revenue billion Forecast, by End-user 2020 & 2033
- Table 3: Global US Cross Border Transport Services Market Revenue billion Forecast, by Region 2020 & 2033
- Table 4: Global US Cross Border Transport Services Market Revenue billion Forecast, by Service 2020 & 2033
- Table 5: Global US Cross Border Transport Services Market Revenue billion Forecast, by End-user 2020 & 2033
- Table 6: Global US Cross Border Transport Services Market Revenue billion Forecast, by Country 2020 & 2033
- Table 7: United States US Cross Border Transport Services Market Revenue (billion) Forecast, by Application 2020 & 2033
- Table 8: Canada US Cross Border Transport Services Market Revenue (billion) Forecast, by Application 2020 & 2033
- Table 9: Mexico US Cross Border Transport Services Market Revenue (billion) Forecast, by Application 2020 & 2033
- Table 10: Global US Cross Border Transport Services Market Revenue billion Forecast, by Service 2020 & 2033
- Table 11: Global US Cross Border Transport Services Market Revenue billion Forecast, by End-user 2020 & 2033
- Table 12: Global US Cross Border Transport Services Market Revenue billion Forecast, by Country 2020 & 2033
- Table 13: Brazil US Cross Border Transport Services Market Revenue (billion) Forecast, by Application 2020 & 2033
- Table 14: Argentina US Cross Border Transport Services Market Revenue (billion) Forecast, by Application 2020 & 2033
- Table 15: Rest of South America US Cross Border Transport Services Market Revenue (billion) Forecast, by Application 2020 & 2033
- Table 16: Global US Cross Border Transport Services Market Revenue billion Forecast, by Service 2020 & 2033
- Table 17: Global US Cross Border Transport Services Market Revenue billion Forecast, by End-user 2020 & 2033
- Table 18: Global US Cross Border Transport Services Market Revenue billion Forecast, by Country 2020 & 2033
- Table 19: United Kingdom US Cross Border Transport Services Market Revenue (billion) Forecast, by Application 2020 & 2033
- Table 20: Germany US Cross Border Transport Services Market Revenue (billion) Forecast, by Application 2020 & 2033
- Table 21: France US Cross Border Transport Services Market Revenue (billion) Forecast, by Application 2020 & 2033
- Table 22: Italy US Cross Border Transport Services Market Revenue (billion) Forecast, by Application 2020 & 2033
- Table 23: Spain US Cross Border Transport Services Market Revenue (billion) Forecast, by Application 2020 & 2033
- Table 24: Russia US Cross Border Transport Services Market Revenue (billion) Forecast, by Application 2020 & 2033
- Table 25: Benelux US Cross Border Transport Services Market Revenue (billion) Forecast, by Application 2020 & 2033
- Table 26: Nordics US Cross Border Transport Services Market Revenue (billion) Forecast, by Application 2020 & 2033
- Table 27: Rest of Europe US Cross Border Transport Services Market Revenue (billion) Forecast, by Application 2020 & 2033
- Table 28: Global US Cross Border Transport Services Market Revenue billion Forecast, by Service 2020 & 2033
- Table 29: Global US Cross Border Transport Services Market Revenue billion Forecast, by End-user 2020 & 2033
- Table 30: Global US Cross Border Transport Services Market Revenue billion Forecast, by Country 2020 & 2033
- Table 31: Turkey US Cross Border Transport Services Market Revenue (billion) Forecast, by Application 2020 & 2033
- Table 32: Israel US Cross Border Transport Services Market Revenue (billion) Forecast, by Application 2020 & 2033
- Table 33: GCC US Cross Border Transport Services Market Revenue (billion) Forecast, by Application 2020 & 2033
- Table 34: North Africa US Cross Border Transport Services Market Revenue (billion) Forecast, by Application 2020 & 2033
- Table 35: South Africa US Cross Border Transport Services Market Revenue (billion) Forecast, by Application 2020 & 2033
- Table 36: Rest of Middle East & Africa US Cross Border Transport Services Market Revenue (billion) Forecast, by Application 2020 & 2033
- Table 37: Global US Cross Border Transport Services Market Revenue billion Forecast, by Service 2020 & 2033
- Table 38: Global US Cross Border Transport Services Market Revenue billion Forecast, by End-user 2020 & 2033
- Table 39: Global US Cross Border Transport Services Market Revenue billion Forecast, by Country 2020 & 2033
- Table 40: China US Cross Border Transport Services Market Revenue (billion) Forecast, by Application 2020 & 2033
- Table 41: India US Cross Border Transport Services Market Revenue (billion) Forecast, by Application 2020 & 2033
- Table 42: Japan US Cross Border Transport Services Market Revenue (billion) Forecast, by Application 2020 & 2033
- Table 43: South Korea US Cross Border Transport Services Market Revenue (billion) Forecast, by Application 2020 & 2033
- Table 44: ASEAN US Cross Border Transport Services Market Revenue (billion) Forecast, by Application 2020 & 2033
- Table 45: Oceania US Cross Border Transport Services Market Revenue (billion) Forecast, by Application 2020 & 2033
- Table 46: Rest of Asia Pacific US Cross Border Transport Services Market Revenue (billion) Forecast, by Application 2020 & 2033
Frequently Asked Questions
1. What is the projected Compound Annual Growth Rate (CAGR) of the US Cross Border Transport Services Market?
The projected CAGR is approximately 6%.
2. Which companies are prominent players in the US Cross Border Transport Services Market?
Key companies in the market include J B Hunt Transport Services Inc, DB Schenker, Moto Transportation, US Xpress, Landstar System Inc, C H Robinson, United Parcel Service (UPS), YRC Worldwide Inc, Schneider National, FedEx, Polaris Transportation Group, Hitachi Transport System**List Not Exhaustive, Swift Transportation Company, XPO Logistics Inc.
3. What are the main segments of the US Cross Border Transport Services Market?
The market segments include Service, End-user.
4. Can you provide details about the market size?
The market size is estimated to be USD 282.7 billion as of 2022.
5. What are some drivers contributing to market growth?
Cost Efficiency and Environmental Sustainability; Infrastructure Development; Rising Consumer Demand.
6. What are the notable trends driving market growth?
Free Trade Agreements (FTAs) Facilitating the Growth of the Market.
7. Are there any restraints impacting market growth?
High Fragmentation of the Logistics Industry; Data Security Concerns.
8. Can you provide examples of recent developments in the market?
October 2022: KAG Logistics completed the acquisition of Toronto-based cross-border freight transportation company Connectrans Logistics. Connectrans has an established carrier network between the U.S. and Canada with expertise in transportation solutions within dry van, temperature control, flatbed, over-dimensional, and intermodal. The acquisition of Connectrans expands KAG Logistics's footprint in the Canadian logistics market. The acquisition will also give Connectrans customers more access to the U.S. marketplace, specialized assets, technologies, and additional logistics expertise.
9. What pricing options are available for accessing the report?
Pricing options include single-user, multi-user, and enterprise licenses priced at USD 3800, USD 4500, and USD 5800 respectively.
10. Is the market size provided in terms of value or volume?
The market size is provided in terms of value, measured in billion.
11. Are there any specific market keywords associated with the report?
Yes, the market keyword associated with the report is "US Cross Border Transport Services Market," which aids in identifying and referencing the specific market segment covered.
12. How do I determine which pricing option suits my needs best?
The pricing options vary based on user requirements and access needs. Individual users may opt for single-user licenses, while businesses requiring broader access may choose multi-user or enterprise licenses for cost-effective access to the report.
13. Are there any additional resources or data provided in the US Cross Border Transport Services Market report?
While the report offers comprehensive insights, it's advisable to review the specific contents or supplementary materials provided to ascertain if additional resources or data are available.
14. How can I stay updated on further developments or reports in the US Cross Border Transport Services Market?
To stay informed about further developments, trends, and reports in the US Cross Border Transport Services Market, consider subscribing to industry newsletters, following relevant companies and organizations, or regularly checking reputable industry news sources and publications.
Methodology
Step 1 - Identification of Relevant Samples Size from Population Database


Step 2 - Approaches for Defining Global Market Size (Value, Volume* & Price*)

Note*: In applicable scenarios
Step 3 - Data Sources
Primary Research
- Web Analytics
- Survey Reports
- Research Institute
- Latest Research Reports
- Opinion Leaders
Secondary Research
- Annual Reports
- White Paper
- Latest Press Release
- Industry Association
- Paid Database
- Investor Presentations

Step 4 - Data Triangulation
Involves using different sources of information in order to increase the validity of a study
These sources are likely to be stakeholders in a program - participants, other researchers, program staff, other community members, and so on.
Then we put all data in single framework & apply various statistical tools to find out the dynamic on the market.
During the analysis stage, feedback from the stakeholder groups would be compared to determine areas of agreement as well as areas of divergence