

Key Insights
The wireless emulator market is poised for substantial expansion, propelled by escalating demand for high-speed data, the rapid evolution of 5G and future wireless technologies, and the critical need for comprehensive testing and validation of wireless devices and networks. This dynamic sector is projected to achieve a Compound Annual Growth Rate (CAGR) of 9.6%, leading to a market size of 313.76 million by 2025. Leading entities such as Keysight, Anritsu, NI, and Spirent are instrumental in shaping this landscape with cutting-edge solutions designed to meet the evolving requirements of the telecommunications sector. The increasing complexity of wireless networks, alongside the imperative for accelerated time-to-market for new devices, mandates sophisticated emulation solutions capable of accurately simulating real-world network conditions. This drives adoption across key segments including research and development, manufacturing, and quality assurance. Geographically, North America and Asia-Pacific are anticipated to lead market share, attributed to the concentration of major technology hubs and a significant presence of wireless device manufacturers.
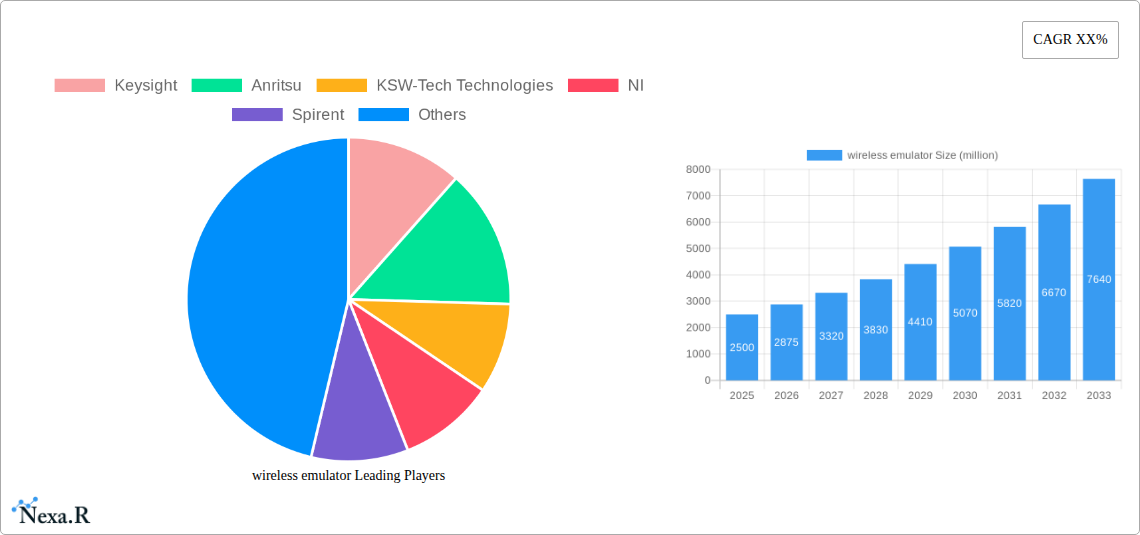
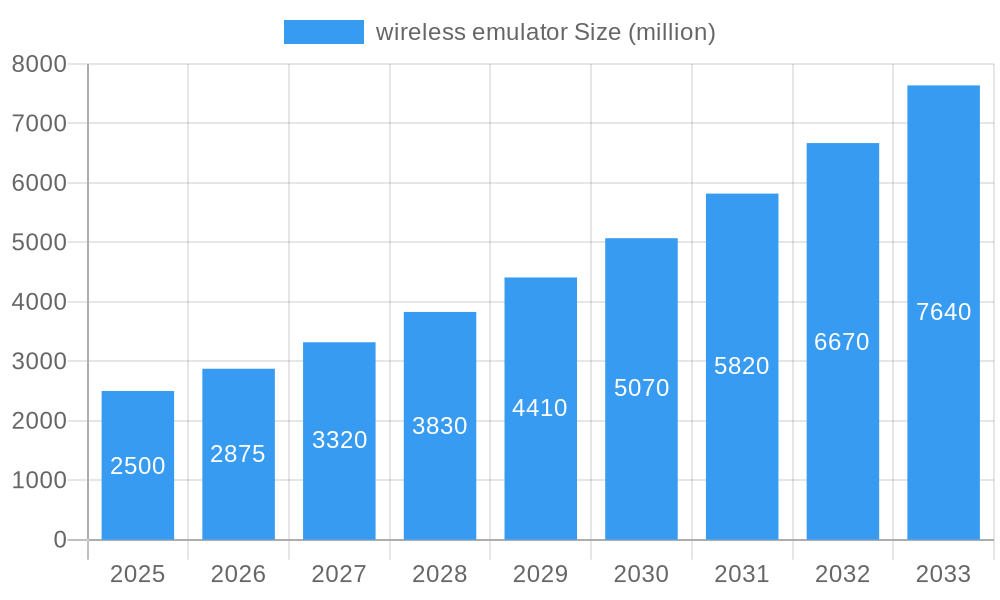
wireless emulator Market Size (In Million)
Market challenges include the considerable investment required for advanced emulation systems and the necessity for specialized operational and maintenance expertise. Nevertheless, the long-term advantages, such as reduced testing expenditures, enhanced product quality, and expedited product launches, are expected to offset these hurdles. Future growth will be stimulated by ongoing advancements in next-generation wireless technologies (e.g., 6G), increased adoption of cloud-based emulation solutions, and the rising demand for integrated testing capabilities across a variety of protocols and network scenarios. Market segmentation encompasses solutions by technology (5G, LTE, Wi-Fi), application (network testing, device testing), and deployment model (cloud-based, on-premise).
wireless emulator Company Market Share
Wireless Emulator Market Report: 2019-2033
This comprehensive report provides an in-depth analysis of the wireless emulator market, encompassing market dynamics, growth trends, regional segmentation, product landscape, key players, and future outlook. The study period covers 2019-2033, with 2025 as the base and estimated year. The forecast period spans 2025-2033, and the historical period encompasses 2019-2024. The report caters to industry professionals, investors, and researchers seeking a granular understanding of this rapidly evolving market. This report predicts a market size of xx million units by 2033, representing a substantial increase from xx million units in 2019.
Wireless Emulator Market Dynamics & Structure
The wireless emulator market is characterized by a moderately concentrated landscape, with key players like Keysight, Anritsu, and Spirent holding significant market share. Technological innovation, particularly in 5G and beyond 5G technologies, is a primary growth driver. Stringent regulatory frameworks governing wireless communication standards influence market adoption. Competitive product substitutes, such as software-defined radios, pose a challenge. End-user demographics, primarily encompassing telecom operators, equipment manufacturers, and research institutions, shape market demand. M&A activity within the sector has been moderate, with approximately xx deals recorded between 2019 and 2024, resulting in a xx% increase in market concentration.
- Market Concentration: Moderately concentrated, with top 5 players holding approximately xx% market share in 2024.
- Innovation Drivers: 5G/6G development, improved accuracy and speed, increased software integration.
- Regulatory Frameworks: Compliance with 3GPP, IEEE, and other standards significantly impacts adoption.
- Competitive Substitutes: Software-defined radios and virtual testbeds offer alternative solutions.
- End-User Demographics: Telecom operators (xx%), Equipment manufacturers (xx%), Research institutions (xx%), others (xx%).
- M&A Trends: xx deals between 2019-2024, leading to xx% increase in market concentration. Key drivers for M&A include expanding product portfolios and gaining access to new technologies.
Wireless Emulator Growth Trends & Insights
The wireless emulator market experienced a CAGR of xx% during the historical period (2019-2024), driven by increased demand for 5G network testing and the rising adoption of software-defined networking (SDN) and network function virtualization (NFV). The market size reached xx million units in 2024. This growth is projected to continue at a CAGR of xx% during the forecast period (2025-2033), propelled by the expanding deployment of 5G networks globally and the emergence of new wireless technologies like private 5G and IoT. Technological disruptions, such as the introduction of AI-powered emulation platforms, are further accelerating market growth. Consumer behavior shifts toward enhanced mobile experiences and increased data consumption are bolstering demand for advanced testing solutions. Market penetration is expected to reach xx% by 2033. The rising adoption of cloud-based testing platforms and the increasing need for accurate and efficient testing solutions will further fuel the growth of this market.
Dominant Regions, Countries, or Segments in Wireless Emulator
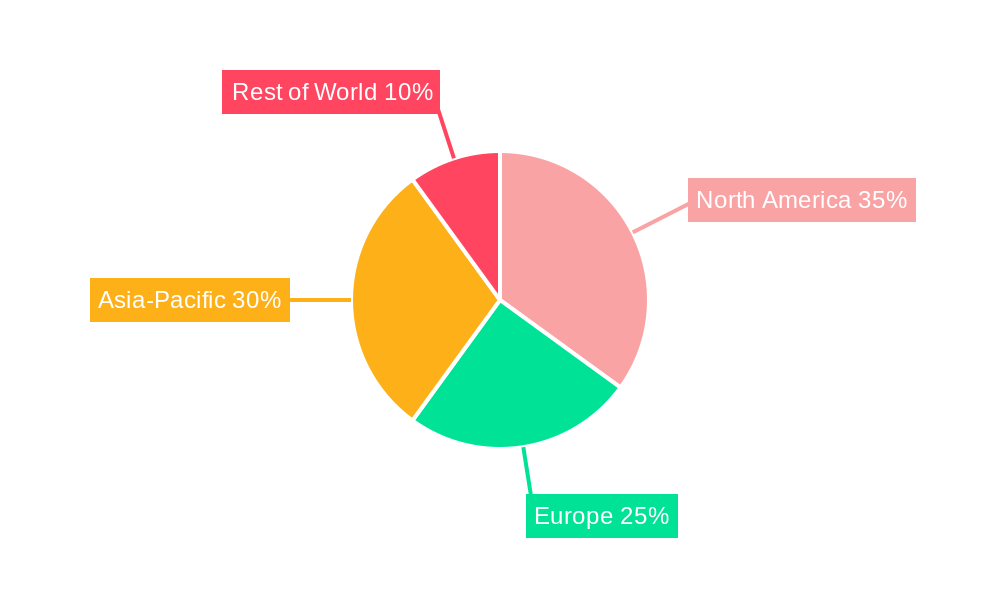
North America currently holds the largest market share in the wireless emulator market, driven by the presence of major technology players, strong government support for technological advancements, and high investments in 5G infrastructure. Asia-Pacific is expected to show the fastest growth rate over the forecast period, spurred by the massive expansion of mobile networks, particularly in countries like China and India. Europe is also witnessing significant growth, driven by investments in digitalization and the increasing adoption of advanced wireless technologies.
- North America: Strong presence of key players, robust R&D investments, and early adoption of 5G. Market share: xx% in 2024, projected to reach xx% by 2033.
- Asia-Pacific: Rapid 5G network deployment, high population density, and rising demand for mobile data. Market share: xx% in 2024, projected to reach xx% by 2033.
- Europe: Significant investments in digital infrastructure and supportive government policies promoting technology adoption. Market share: xx% in 2024, projected to reach xx% by 2033.
- Rest of the World: Emerging markets show moderate growth potential driven by increased adoption of wireless communication technologies. Market share: xx% in 2024, projected to reach xx% by 2033.
Wireless Emulator Product Landscape
Wireless emulators encompass a wide range of products, from standalone hardware solutions to integrated software platforms. These products offer diverse functionalities, including signal generation, channel emulation, and performance testing. Recent innovations focus on improving accuracy, scalability, and ease of use. Key features include advanced modulation techniques, support for diverse frequency bands, and integration with automated test equipment (ATE). Unique selling propositions often include superior signal fidelity, reduced testing time, and the ability to simulate complex real-world scenarios.
Key Drivers, Barriers & Challenges in Wireless Emulator
Key Drivers: The increasing demand for higher data rates, greater network capacity, and improved network reliability in 5G and beyond 5G networks is driving growth. Government initiatives and regulatory compliance further accelerate market expansion. The rise of IoT and the growing need for efficient testing solutions are also contributing factors.
Challenges & Restraints: High initial investment costs, the complexity of configuring and using wireless emulators, and the need for specialized expertise can hinder market adoption. Furthermore, keeping pace with rapidly evolving wireless standards presents a constant challenge. Supply chain disruptions, particularly impacting semiconductor availability, have created capacity constraints, impacting production. These factors resulted in a xx% reduction in production capacity in Q1 2024.
Emerging Opportunities in Wireless Emulator
Emerging opportunities lie in the expanding use of wireless emulators in the testing of private 5G networks, the development of sophisticated testing solutions for IoT devices, and the increasing adoption of cloud-based emulation platforms. The growth of autonomous vehicles and the need for reliable testing of vehicle-to-everything (V2X) communication technologies presents a significant growth opportunity. Untapped markets in developing economies also offer significant potential.
Growth Accelerators in the Wireless Emulator Industry
Technological breakthroughs, such as the development of more accurate and efficient emulation techniques and the integration of AI and machine learning, are key growth catalysts. Strategic partnerships between emulator vendors and network equipment manufacturers facilitate greater market penetration. Market expansion strategies targeting new applications and regions further propel market growth.
Notable Milestones in Wireless Emulator Sector
- 2020: Keysight launched its 5G network emulation solution.
- 2021: Anritsu introduced a new platform for testing mmWave technologies.
- 2022: Spirent acquired a smaller wireless emulator company, expanding its product portfolio.
- 2023: Significant investments in R&D by multiple companies to cater to the next generation of wireless technologies.
- 2024 Q2: A new standard for private 5G testing was released.
In-Depth Wireless Emulator Market Outlook
The wireless emulator market is poised for continued growth, driven by the increasing adoption of 5G and beyond 5G technologies, the expansion of IoT applications, and the rising demand for efficient and accurate testing solutions. Strategic partnerships, technological innovations, and market expansion strategies will further fuel this growth. The market presents significant opportunities for players offering innovative solutions, superior performance, and comprehensive support. The predicted market size of xx million units by 2033 reflects the considerable potential of this dynamic market.
wireless emulator Segmentation
- 1. Application
- 2. Types
wireless emulator Segmentation By Geography
-
1. North America
- 1.1. United States
- 1.2. Canada
- 1.3. Mexico
-
2. South America
- 2.1. Brazil
- 2.2. Argentina
- 2.3. Rest of South America
-
3. Europe
- 3.1. United Kingdom
- 3.2. Germany
- 3.3. France
- 3.4. Italy
- 3.5. Spain
- 3.6. Russia
- 3.7. Benelux
- 3.8. Nordics
- 3.9. Rest of Europe
-
4. Middle East & Africa
- 4.1. Turkey
- 4.2. Israel
- 4.3. GCC
- 4.4. North Africa
- 4.5. South Africa
- 4.6. Rest of Middle East & Africa
-
5. Asia Pacific
- 5.1. China
- 5.2. India
- 5.3. Japan
- 5.4. South Korea
- 5.5. ASEAN
- 5.6. Oceania
- 5.7. Rest of Asia Pacific
wireless emulator Regional Market Share
Geographic Coverage of wireless emulator
wireless emulator REPORT HIGHLIGHTS
| Aspects | Details |
|---|---|
| Study Period | 2020-2034 |
| Base Year | 2025 |
| Estimated Year | 2026 |
| Forecast Period | 2026-2034 |
| Historical Period | 2020-2025 |
| Growth Rate | CAGR of 9.6% from 2020-2034 |
| Segmentation |
|
Table of Contents
- 1. Introduction
- 1.1. Research Scope
- 1.2. Market Segmentation
- 1.3. Research Methodology
- 1.4. Definitions and Assumptions
- 2. Executive Summary
- 2.1. Introduction
- 3. Market Dynamics
- 3.1. Introduction
- 3.2. Market Drivers
- 3.3. Market Restrains
- 3.4. Market Trends
- 4. Market Factor Analysis
- 4.1. Porters Five Forces
- 4.2. Supply/Value Chain
- 4.3. PESTEL analysis
- 4.4. Market Entropy
- 4.5. Patent/Trademark Analysis
- 5. Global wireless emulator Analysis, Insights and Forecast, 2020-2032
- 5.1. Market Analysis, Insights and Forecast - by Application
- 5.2. Market Analysis, Insights and Forecast - by Types
- 5.3. Market Analysis, Insights and Forecast - by Region
- 5.3.1. North America
- 5.3.2. South America
- 5.3.3. Europe
- 5.3.4. Middle East & Africa
- 5.3.5. Asia Pacific
- 5.1. Market Analysis, Insights and Forecast - by Application
- 6. North America wireless emulator Analysis, Insights and Forecast, 2020-2032
- 6.1. Market Analysis, Insights and Forecast - by Application
- 6.2. Market Analysis, Insights and Forecast - by Types
- 6.1. Market Analysis, Insights and Forecast - by Application
- 7. South America wireless emulator Analysis, Insights and Forecast, 2020-2032
- 7.1. Market Analysis, Insights and Forecast - by Application
- 7.2. Market Analysis, Insights and Forecast - by Types
- 7.1. Market Analysis, Insights and Forecast - by Application
- 8. Europe wireless emulator Analysis, Insights and Forecast, 2020-2032
- 8.1. Market Analysis, Insights and Forecast - by Application
- 8.2. Market Analysis, Insights and Forecast - by Types
- 8.1. Market Analysis, Insights and Forecast - by Application
- 9. Middle East & Africa wireless emulator Analysis, Insights and Forecast, 2020-2032
- 9.1. Market Analysis, Insights and Forecast - by Application
- 9.2. Market Analysis, Insights and Forecast - by Types
- 9.1. Market Analysis, Insights and Forecast - by Application
- 10. Asia Pacific wireless emulator Analysis, Insights and Forecast, 2020-2032
- 10.1. Market Analysis, Insights and Forecast - by Application
- 10.2. Market Analysis, Insights and Forecast - by Types
- 10.1. Market Analysis, Insights and Forecast - by Application
- 11. Competitive Analysis
- 11.1. Global Market Share Analysis 2025
- 11.2. Company Profiles
- 11.2.1 Keysight
- 11.2.1.1. Overview
- 11.2.1.2. Products
- 11.2.1.3. SWOT Analysis
- 11.2.1.4. Recent Developments
- 11.2.1.5. Financials (Based on Availability)
- 11.2.2 Anritsu
- 11.2.2.1. Overview
- 11.2.2.2. Products
- 11.2.2.3. SWOT Analysis
- 11.2.2.4. Recent Developments
- 11.2.2.5. Financials (Based on Availability)
- 11.2.3 KSW-Tech Technologies
- 11.2.3.1. Overview
- 11.2.3.2. Products
- 11.2.3.3. SWOT Analysis
- 11.2.3.4. Recent Developments
- 11.2.3.5. Financials (Based on Availability)
- 11.2.4 NI
- 11.2.4.1. Overview
- 11.2.4.2. Products
- 11.2.4.3. SWOT Analysis
- 11.2.4.4. Recent Developments
- 11.2.4.5. Financials (Based on Availability)
- 11.2.5 Spirent
- 11.2.5.1. Overview
- 11.2.5.2. Products
- 11.2.5.3. SWOT Analysis
- 11.2.5.4. Recent Developments
- 11.2.5.5. Financials (Based on Availability)
- 11.2.6 Hwa Create
- 11.2.6.1. Overview
- 11.2.6.2. Products
- 11.2.6.3. SWOT Analysis
- 11.2.6.4. Recent Developments
- 11.2.6.5. Financials (Based on Availability)
- 11.2.7 China Electronics Technology Group
- 11.2.7.1. Overview
- 11.2.7.2. Products
- 11.2.7.3. SWOT Analysis
- 11.2.7.4. Recent Developments
- 11.2.7.5. Financials (Based on Availability)
- 11.2.1 Keysight
List of Figures
- Figure 1: Global wireless emulator Revenue Breakdown (million, %) by Region 2025 & 2033
- Figure 2: Global wireless emulator Volume Breakdown (K, %) by Region 2025 & 2033
- Figure 3: North America wireless emulator Revenue (million), by Application 2025 & 2033
- Figure 4: North America wireless emulator Volume (K), by Application 2025 & 2033
- Figure 5: North America wireless emulator Revenue Share (%), by Application 2025 & 2033
- Figure 6: North America wireless emulator Volume Share (%), by Application 2025 & 2033
- Figure 7: North America wireless emulator Revenue (million), by Types 2025 & 2033
- Figure 8: North America wireless emulator Volume (K), by Types 2025 & 2033
- Figure 9: North America wireless emulator Revenue Share (%), by Types 2025 & 2033
- Figure 10: North America wireless emulator Volume Share (%), by Types 2025 & 2033
- Figure 11: North America wireless emulator Revenue (million), by Country 2025 & 2033
- Figure 12: North America wireless emulator Volume (K), by Country 2025 & 2033
- Figure 13: North America wireless emulator Revenue Share (%), by Country 2025 & 2033
- Figure 14: North America wireless emulator Volume Share (%), by Country 2025 & 2033
- Figure 15: South America wireless emulator Revenue (million), by Application 2025 & 2033
- Figure 16: South America wireless emulator Volume (K), by Application 2025 & 2033
- Figure 17: South America wireless emulator Revenue Share (%), by Application 2025 & 2033
- Figure 18: South America wireless emulator Volume Share (%), by Application 2025 & 2033
- Figure 19: South America wireless emulator Revenue (million), by Types 2025 & 2033
- Figure 20: South America wireless emulator Volume (K), by Types 2025 & 2033
- Figure 21: South America wireless emulator Revenue Share (%), by Types 2025 & 2033
- Figure 22: South America wireless emulator Volume Share (%), by Types 2025 & 2033
- Figure 23: South America wireless emulator Revenue (million), by Country 2025 & 2033
- Figure 24: South America wireless emulator Volume (K), by Country 2025 & 2033
- Figure 25: South America wireless emulator Revenue Share (%), by Country 2025 & 2033
- Figure 26: South America wireless emulator Volume Share (%), by Country 2025 & 2033
- Figure 27: Europe wireless emulator Revenue (million), by Application 2025 & 2033
- Figure 28: Europe wireless emulator Volume (K), by Application 2025 & 2033
- Figure 29: Europe wireless emulator Revenue Share (%), by Application 2025 & 2033
- Figure 30: Europe wireless emulator Volume Share (%), by Application 2025 & 2033
- Figure 31: Europe wireless emulator Revenue (million), by Types 2025 & 2033
- Figure 32: Europe wireless emulator Volume (K), by Types 2025 & 2033
- Figure 33: Europe wireless emulator Revenue Share (%), by Types 2025 & 2033
- Figure 34: Europe wireless emulator Volume Share (%), by Types 2025 & 2033
- Figure 35: Europe wireless emulator Revenue (million), by Country 2025 & 2033
- Figure 36: Europe wireless emulator Volume (K), by Country 2025 & 2033
- Figure 37: Europe wireless emulator Revenue Share (%), by Country 2025 & 2033
- Figure 38: Europe wireless emulator Volume Share (%), by Country 2025 & 2033
- Figure 39: Middle East & Africa wireless emulator Revenue (million), by Application 2025 & 2033
- Figure 40: Middle East & Africa wireless emulator Volume (K), by Application 2025 & 2033
- Figure 41: Middle East & Africa wireless emulator Revenue Share (%), by Application 2025 & 2033
- Figure 42: Middle East & Africa wireless emulator Volume Share (%), by Application 2025 & 2033
- Figure 43: Middle East & Africa wireless emulator Revenue (million), by Types 2025 & 2033
- Figure 44: Middle East & Africa wireless emulator Volume (K), by Types 2025 & 2033
- Figure 45: Middle East & Africa wireless emulator Revenue Share (%), by Types 2025 & 2033
- Figure 46: Middle East & Africa wireless emulator Volume Share (%), by Types 2025 & 2033
- Figure 47: Middle East & Africa wireless emulator Revenue (million), by Country 2025 & 2033
- Figure 48: Middle East & Africa wireless emulator Volume (K), by Country 2025 & 2033
- Figure 49: Middle East & Africa wireless emulator Revenue Share (%), by Country 2025 & 2033
- Figure 50: Middle East & Africa wireless emulator Volume Share (%), by Country 2025 & 2033
- Figure 51: Asia Pacific wireless emulator Revenue (million), by Application 2025 & 2033
- Figure 52: Asia Pacific wireless emulator Volume (K), by Application 2025 & 2033
- Figure 53: Asia Pacific wireless emulator Revenue Share (%), by Application 2025 & 2033
- Figure 54: Asia Pacific wireless emulator Volume Share (%), by Application 2025 & 2033
- Figure 55: Asia Pacific wireless emulator Revenue (million), by Types 2025 & 2033
- Figure 56: Asia Pacific wireless emulator Volume (K), by Types 2025 & 2033
- Figure 57: Asia Pacific wireless emulator Revenue Share (%), by Types 2025 & 2033
- Figure 58: Asia Pacific wireless emulator Volume Share (%), by Types 2025 & 2033
- Figure 59: Asia Pacific wireless emulator Revenue (million), by Country 2025 & 2033
- Figure 60: Asia Pacific wireless emulator Volume (K), by Country 2025 & 2033
- Figure 61: Asia Pacific wireless emulator Revenue Share (%), by Country 2025 & 2033
- Figure 62: Asia Pacific wireless emulator Volume Share (%), by Country 2025 & 2033
List of Tables
- Table 1: Global wireless emulator Revenue million Forecast, by Application 2020 & 2033
- Table 2: Global wireless emulator Volume K Forecast, by Application 2020 & 2033
- Table 3: Global wireless emulator Revenue million Forecast, by Types 2020 & 2033
- Table 4: Global wireless emulator Volume K Forecast, by Types 2020 & 2033
- Table 5: Global wireless emulator Revenue million Forecast, by Region 2020 & 2033
- Table 6: Global wireless emulator Volume K Forecast, by Region 2020 & 2033
- Table 7: Global wireless emulator Revenue million Forecast, by Application 2020 & 2033
- Table 8: Global wireless emulator Volume K Forecast, by Application 2020 & 2033
- Table 9: Global wireless emulator Revenue million Forecast, by Types 2020 & 2033
- Table 10: Global wireless emulator Volume K Forecast, by Types 2020 & 2033
- Table 11: Global wireless emulator Revenue million Forecast, by Country 2020 & 2033
- Table 12: Global wireless emulator Volume K Forecast, by Country 2020 & 2033
- Table 13: United States wireless emulator Revenue (million) Forecast, by Application 2020 & 2033
- Table 14: United States wireless emulator Volume (K) Forecast, by Application 2020 & 2033
- Table 15: Canada wireless emulator Revenue (million) Forecast, by Application 2020 & 2033
- Table 16: Canada wireless emulator Volume (K) Forecast, by Application 2020 & 2033
- Table 17: Mexico wireless emulator Revenue (million) Forecast, by Application 2020 & 2033
- Table 18: Mexico wireless emulator Volume (K) Forecast, by Application 2020 & 2033
- Table 19: Global wireless emulator Revenue million Forecast, by Application 2020 & 2033
- Table 20: Global wireless emulator Volume K Forecast, by Application 2020 & 2033
- Table 21: Global wireless emulator Revenue million Forecast, by Types 2020 & 2033
- Table 22: Global wireless emulator Volume K Forecast, by Types 2020 & 2033
- Table 23: Global wireless emulator Revenue million Forecast, by Country 2020 & 2033
- Table 24: Global wireless emulator Volume K Forecast, by Country 2020 & 2033
- Table 25: Brazil wireless emulator Revenue (million) Forecast, by Application 2020 & 2033
- Table 26: Brazil wireless emulator Volume (K) Forecast, by Application 2020 & 2033
- Table 27: Argentina wireless emulator Revenue (million) Forecast, by Application 2020 & 2033
- Table 28: Argentina wireless emulator Volume (K) Forecast, by Application 2020 & 2033
- Table 29: Rest of South America wireless emulator Revenue (million) Forecast, by Application 2020 & 2033
- Table 30: Rest of South America wireless emulator Volume (K) Forecast, by Application 2020 & 2033
- Table 31: Global wireless emulator Revenue million Forecast, by Application 2020 & 2033
- Table 32: Global wireless emulator Volume K Forecast, by Application 2020 & 2033
- Table 33: Global wireless emulator Revenue million Forecast, by Types 2020 & 2033
- Table 34: Global wireless emulator Volume K Forecast, by Types 2020 & 2033
- Table 35: Global wireless emulator Revenue million Forecast, by Country 2020 & 2033
- Table 36: Global wireless emulator Volume K Forecast, by Country 2020 & 2033
- Table 37: United Kingdom wireless emulator Revenue (million) Forecast, by Application 2020 & 2033
- Table 38: United Kingdom wireless emulator Volume (K) Forecast, by Application 2020 & 2033
- Table 39: Germany wireless emulator Revenue (million) Forecast, by Application 2020 & 2033
- Table 40: Germany wireless emulator Volume (K) Forecast, by Application 2020 & 2033
- Table 41: France wireless emulator Revenue (million) Forecast, by Application 2020 & 2033
- Table 42: France wireless emulator Volume (K) Forecast, by Application 2020 & 2033
- Table 43: Italy wireless emulator Revenue (million) Forecast, by Application 2020 & 2033
- Table 44: Italy wireless emulator Volume (K) Forecast, by Application 2020 & 2033
- Table 45: Spain wireless emulator Revenue (million) Forecast, by Application 2020 & 2033
- Table 46: Spain wireless emulator Volume (K) Forecast, by Application 2020 & 2033
- Table 47: Russia wireless emulator Revenue (million) Forecast, by Application 2020 & 2033
- Table 48: Russia wireless emulator Volume (K) Forecast, by Application 2020 & 2033
- Table 49: Benelux wireless emulator Revenue (million) Forecast, by Application 2020 & 2033
- Table 50: Benelux wireless emulator Volume (K) Forecast, by Application 2020 & 2033
- Table 51: Nordics wireless emulator Revenue (million) Forecast, by Application 2020 & 2033
- Table 52: Nordics wireless emulator Volume (K) Forecast, by Application 2020 & 2033
- Table 53: Rest of Europe wireless emulator Revenue (million) Forecast, by Application 2020 & 2033
- Table 54: Rest of Europe wireless emulator Volume (K) Forecast, by Application 2020 & 2033
- Table 55: Global wireless emulator Revenue million Forecast, by Application 2020 & 2033
- Table 56: Global wireless emulator Volume K Forecast, by Application 2020 & 2033
- Table 57: Global wireless emulator Revenue million Forecast, by Types 2020 & 2033
- Table 58: Global wireless emulator Volume K Forecast, by Types 2020 & 2033
- Table 59: Global wireless emulator Revenue million Forecast, by Country 2020 & 2033
- Table 60: Global wireless emulator Volume K Forecast, by Country 2020 & 2033
- Table 61: Turkey wireless emulator Revenue (million) Forecast, by Application 2020 & 2033
- Table 62: Turkey wireless emulator Volume (K) Forecast, by Application 2020 & 2033
- Table 63: Israel wireless emulator Revenue (million) Forecast, by Application 2020 & 2033
- Table 64: Israel wireless emulator Volume (K) Forecast, by Application 2020 & 2033
- Table 65: GCC wireless emulator Revenue (million) Forecast, by Application 2020 & 2033
- Table 66: GCC wireless emulator Volume (K) Forecast, by Application 2020 & 2033
- Table 67: North Africa wireless emulator Revenue (million) Forecast, by Application 2020 & 2033
- Table 68: North Africa wireless emulator Volume (K) Forecast, by Application 2020 & 2033
- Table 69: South Africa wireless emulator Revenue (million) Forecast, by Application 2020 & 2033
- Table 70: South Africa wireless emulator Volume (K) Forecast, by Application 2020 & 2033
- Table 71: Rest of Middle East & Africa wireless emulator Revenue (million) Forecast, by Application 2020 & 2033
- Table 72: Rest of Middle East & Africa wireless emulator Volume (K) Forecast, by Application 2020 & 2033
- Table 73: Global wireless emulator Revenue million Forecast, by Application 2020 & 2033
- Table 74: Global wireless emulator Volume K Forecast, by Application 2020 & 2033
- Table 75: Global wireless emulator Revenue million Forecast, by Types 2020 & 2033
- Table 76: Global wireless emulator Volume K Forecast, by Types 2020 & 2033
- Table 77: Global wireless emulator Revenue million Forecast, by Country 2020 & 2033
- Table 78: Global wireless emulator Volume K Forecast, by Country 2020 & 2033
- Table 79: China wireless emulator Revenue (million) Forecast, by Application 2020 & 2033
- Table 80: China wireless emulator Volume (K) Forecast, by Application 2020 & 2033
- Table 81: India wireless emulator Revenue (million) Forecast, by Application 2020 & 2033
- Table 82: India wireless emulator Volume (K) Forecast, by Application 2020 & 2033
- Table 83: Japan wireless emulator Revenue (million) Forecast, by Application 2020 & 2033
- Table 84: Japan wireless emulator Volume (K) Forecast, by Application 2020 & 2033
- Table 85: South Korea wireless emulator Revenue (million) Forecast, by Application 2020 & 2033
- Table 86: South Korea wireless emulator Volume (K) Forecast, by Application 2020 & 2033
- Table 87: ASEAN wireless emulator Revenue (million) Forecast, by Application 2020 & 2033
- Table 88: ASEAN wireless emulator Volume (K) Forecast, by Application 2020 & 2033
- Table 89: Oceania wireless emulator Revenue (million) Forecast, by Application 2020 & 2033
- Table 90: Oceania wireless emulator Volume (K) Forecast, by Application 2020 & 2033
- Table 91: Rest of Asia Pacific wireless emulator Revenue (million) Forecast, by Application 2020 & 2033
- Table 92: Rest of Asia Pacific wireless emulator Volume (K) Forecast, by Application 2020 & 2033
Frequently Asked Questions
1. What is the projected Compound Annual Growth Rate (CAGR) of the wireless emulator?
The projected CAGR is approximately 9.6%.
2. Which companies are prominent players in the wireless emulator?
Key companies in the market include Keysight, Anritsu, KSW-Tech Technologies, NI, Spirent, Hwa Create, China Electronics Technology Group.
3. What are the main segments of the wireless emulator?
The market segments include Application, Types.
4. Can you provide details about the market size?
The market size is estimated to be USD 313.76 million as of 2022.
5. What are some drivers contributing to market growth?
N/A
6. What are the notable trends driving market growth?
N/A
7. Are there any restraints impacting market growth?
N/A
8. Can you provide examples of recent developments in the market?
N/A
9. What pricing options are available for accessing the report?
Pricing options include single-user, multi-user, and enterprise licenses priced at USD 4350.00, USD 6525.00, and USD 8700.00 respectively.
10. Is the market size provided in terms of value or volume?
The market size is provided in terms of value, measured in million and volume, measured in K.
11. Are there any specific market keywords associated with the report?
Yes, the market keyword associated with the report is "wireless emulator," which aids in identifying and referencing the specific market segment covered.
12. How do I determine which pricing option suits my needs best?
The pricing options vary based on user requirements and access needs. Individual users may opt for single-user licenses, while businesses requiring broader access may choose multi-user or enterprise licenses for cost-effective access to the report.
13. Are there any additional resources or data provided in the wireless emulator report?
While the report offers comprehensive insights, it's advisable to review the specific contents or supplementary materials provided to ascertain if additional resources or data are available.
14. How can I stay updated on further developments or reports in the wireless emulator?
To stay informed about further developments, trends, and reports in the wireless emulator, consider subscribing to industry newsletters, following relevant companies and organizations, or regularly checking reputable industry news sources and publications.
Methodology
Step 1 - Identification of Relevant Samples Size from Population Database


Step 2 - Approaches for Defining Global Market Size (Value, Volume* & Price*)

Note*: In applicable scenarios
Step 3 - Data Sources
Primary Research
- Web Analytics
- Survey Reports
- Research Institute
- Latest Research Reports
- Opinion Leaders
Secondary Research
- Annual Reports
- White Paper
- Latest Press Release
- Industry Association
- Paid Database
- Investor Presentations

Step 4 - Data Triangulation
Involves using different sources of information in order to increase the validity of a study
These sources are likely to be stakeholders in a program - participants, other researchers, program staff, other community members, and so on.
Then we put all data in single framework & apply various statistical tools to find out the dynamic on the market.
During the analysis stage, feedback from the stakeholder groups would be compared to determine areas of agreement as well as areas of divergence