

Key Insights
The global Christmas tree market, valued at approximately $1.27 billion in 2024, is projected for substantial expansion. A compound annual growth rate (CAGR) of 4.63% from 2024 to 2032 signals a robustly growing market. Key growth drivers include escalating energy demand, particularly from emerging economies, and significant investments in upstream oil and gas operations, which necessitate advanced Christmas tree systems. Technological innovations, such as integrated smart sensors and automation, are enhancing operational efficiency and safety, further accelerating market growth. However, market expansion is moderated by fluctuating oil and gas prices impacting investment decisions and stringent environmental regulations increasing compliance costs. Segmentation analysis highlights strong demand for both horizontal and vertical configurations. While onshore deployments currently lead, offshore deployments are experiencing a faster growth rate. Leading industry players, including Yantai Jereh, Shengji Group, and Schlumberger, are at the forefront of innovation and competitive dynamics. Geographically, North America and the Asia-Pacific region currently command the largest market share due to extensive oil and gas production and exploration activities. The Middle East and Africa are anticipated to demonstrate significant growth driven by intensified exploration initiatives.
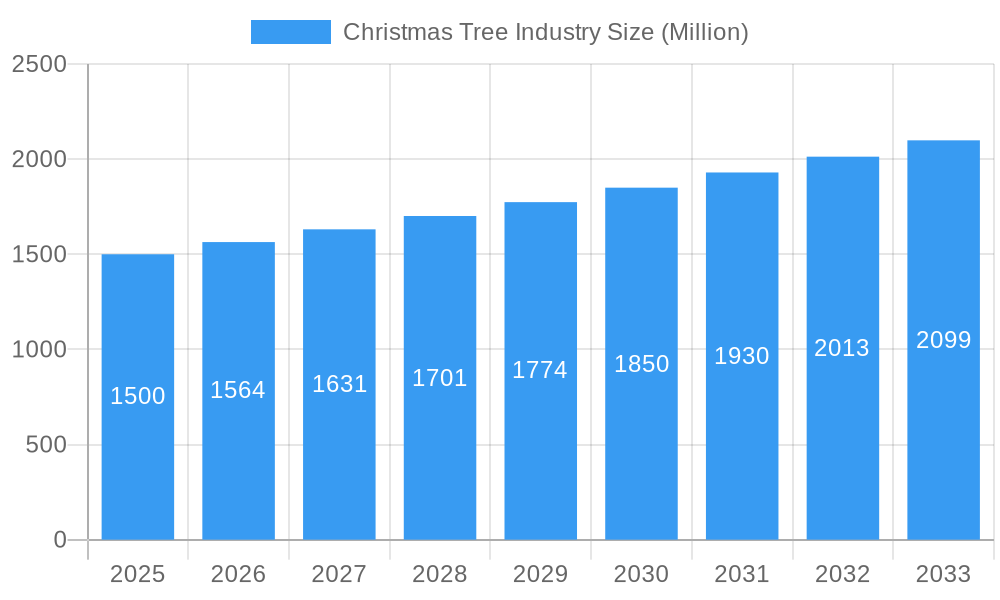
Christmas Tree Industry Market Size (In Billion)
The market's outlook indicates sustained expansion, with the projected 4.63% CAGR underscoring consistent growth. This trajectory is expected to be supported by ongoing technological advancements in automation and digitalization, alongside the persistent demand for energy resources. Nonetheless, persistent price volatility within the oil and gas sector presents a notable risk, potentially influencing investment levels. Strategic partnerships and acquisitions are actively pursued by companies to strengthen market positions and broaden product offerings, reflecting a competitive yet expanding industry landscape. To ensure profitability and market share, companies must navigate evolving regulatory frameworks, prioritize research and development investments, and adeptly respond to commodity price fluctuations. The increasing complexity of deepwater and unconventional resource extraction projects further indicates a sustained long-term demand for sophisticated Christmas tree technologies.
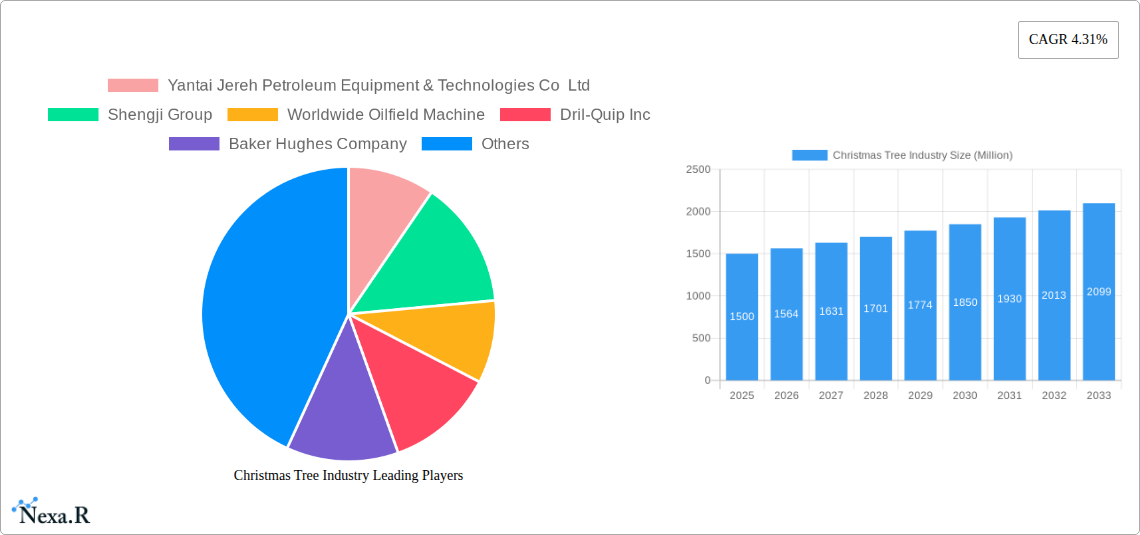
Christmas Tree Industry Company Market Share
Christmas Tree Industry Market Report: 2019-2033
This comprehensive report provides an in-depth analysis of the global Christmas Tree industry, encompassing market dynamics, growth trends, regional landscapes, and key players. Covering the period from 2019 to 2033, with a focus on 2025, this report is an essential resource for industry professionals, investors, and stakeholders seeking to understand and capitalize on the opportunities within this dynamic sector. The report segments the market by Type (Horizontal Tree, Vertical Tree) and Location of Deployment (Onshore, Offshore), providing granular insights into each sub-segment.
Christmas Tree Industry Market Dynamics & Structure
The Christmas tree market, valued at xx Million units in 2024, is characterized by moderate concentration with a few dominant players and numerous smaller, specialized firms. Technological innovation, particularly in subsea applications and automation, is a key driver. Stringent regulatory frameworks concerning safety and environmental impact significantly influence market operations. The market faces competitive pressure from alternative wellhead technologies, but demand remains robust driven by increasing oil and gas exploration and production. M&A activity is relatively moderate, with a focus on enhancing technological capabilities and expanding geographical reach. In 2024, approximately xx M&A deals were recorded.
- Market Concentration: Moderately concentrated, with top 5 players holding xx% market share (2024).
- Technological Innovation: Focus on automation, subsea capabilities, and improved materials for enhanced durability and efficiency.
- Regulatory Framework: Stringent safety and environmental regulations impact design, installation, and operation.
- Competitive Substitutes: Alternative wellhead technologies pose a moderate competitive threat.
- End-User Demographics: Primarily oil and gas exploration and production companies, both onshore and offshore.
- M&A Trends: Strategic acquisitions for technological advancement and market expansion.
Christmas Tree Industry Growth Trends & Insights
The global Christmas tree market exhibits steady growth, driven by the increasing demand for oil and gas globally. The market witnessed a CAGR of xx% during the historical period (2019-2024) and is projected to maintain a CAGR of xx% during the forecast period (2025-2033), reaching xx Million units by 2033. This growth is fueled by both onshore and offshore exploration activities, particularly in regions with significant reserves. Technological advancements in subsea Christmas trees, coupled with the rising adoption of automated systems, are further contributing to market expansion. A shift towards more efficient and environmentally friendly designs is also observed. Market penetration in emerging economies is expected to increase significantly, offering substantial growth potential.
Dominant Regions, Countries, or Segments in Christmas Tree Industry
The offshore segment currently dominates the Christmas tree market, accounting for approximately xx% of the total market value in 2024. This is primarily attributed to the increasing investments in deepwater and ultra-deepwater oil and gas exploration and production projects. Regions like the Middle East, North America, and Asia-Pacific are key contributors to the market's growth, fueled by their substantial reserves and ongoing infrastructure development.
- Offshore Segment Dominance: Driven by deepwater exploration and production.
- Key Regions: Middle East, North America, and Asia-Pacific lead market growth.
- Growth Drivers: Rising investments in offshore exploration, technological advancements, and supportive government policies.
Christmas Tree Industry Product Landscape
Christmas trees are evolving from simple valve assemblies to sophisticated, integrated systems incorporating automation, remote control capabilities, and advanced monitoring systems. The key focus is on improving safety, reliability, and efficiency, along with reducing environmental impact. Innovations include lightweight designs for easier deployment and maintenance, and the incorporation of smart sensors for predictive maintenance. Unique selling propositions include enhanced performance, improved durability, and reduced operational costs.
Key Drivers, Barriers & Challenges in Christmas Tree Industry
Key Drivers:
- Increased global demand for oil and gas.
- Rising investments in offshore exploration and production.
- Technological advancements in subsea Christmas trees.
- Government initiatives promoting energy exploration and production.
Challenges & Restraints:
- High initial investment costs associated with Christmas tree systems.
- Stringent safety and environmental regulations.
- Fluctuations in oil and gas prices impacting project investments.
- Supply chain disruptions and material price volatility. This resulted in a xx% increase in production costs in 2024.
Emerging Opportunities in Christmas Tree Industry
Emerging opportunities lie in the development of advanced subsea systems for deepwater applications, the incorporation of digital technologies for enhanced monitoring and control, and the exploration of untapped markets in developing economies. Further growth is anticipated through strategic partnerships between manufacturers and oil and gas operators to offer integrated solutions. The focus on sustainability and reduced environmental impact also presents significant opportunities for innovation.
Growth Accelerators in the Christmas Tree Industry Industry
Technological advancements, particularly in automation, remote operations, and materials science, are significant long-term growth accelerators. Strategic partnerships between manufacturers and oil and gas companies fostering innovation and efficient deployment are crucial. Expansion into new geographical markets, particularly in regions with significant untapped oil and gas reserves, will further stimulate market growth.
Key Players Shaping the Christmas Tree Industry Market
- Yantai Jereh Petroleum Equipment & Technologies Co Ltd
- Shengji Group
- Worldwide Oilfield Machine
- Dril-Quip Inc
- Baker Hughes Company
- Aker Solutions
- INTERA Ltd
- Schlumberger Limited
- TechnipFMC PLC
Notable Milestones in Christmas Tree Industry Sector
- July 2022: CNOOC launched its first self-developed subsea Christmas tree system in the Bohai Sea, demonstrating technological advancement and domestic capability.
- March 2022: Woodside's contract with DOF Subsea for subsea Xmas tree retrieval highlighted the growing decommissioning market segment.
In-Depth Christmas Tree Industry Market Outlook
The Christmas tree market is poised for sustained growth, driven by ongoing exploration and production activities, particularly in offshore environments. Technological innovation, strategic partnerships, and expansion into new markets will be crucial for maximizing future potential. Companies focusing on sustainability and cost-effective solutions will gain a competitive advantage. The market's long-term outlook remains positive, with significant opportunities for growth and innovation.
Christmas Tree Industry Segmentation
-
1. Type
- 1.1. Horizontal Tree
- 1.2. Vertical Tree
-
2. Location of Deployment
- 2.1. Onshore
- 2.2. Offshore
Christmas Tree Industry Segmentation By Geography
- 1. North America
- 2. Europe
- 3. South America
- 4. Asia Pacific
- 5. Middle East and Africa
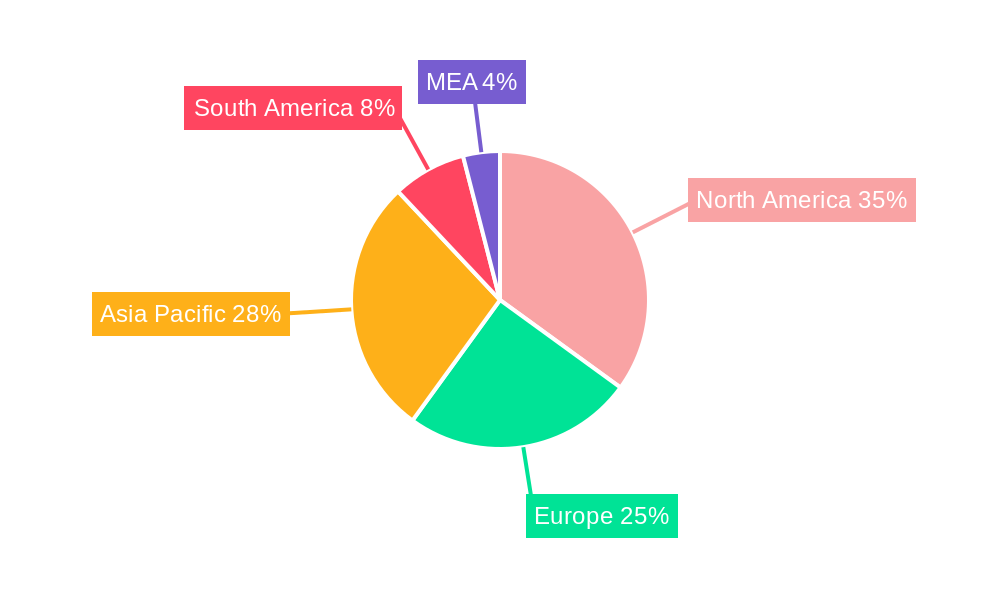
Christmas Tree Industry Regional Market Share
Geographic Coverage of Christmas Tree Industry
Christmas Tree Industry REPORT HIGHLIGHTS
| Aspects | Details |
|---|---|
| Study Period | 2020-2034 |
| Base Year | 2025 |
| Estimated Year | 2026 |
| Forecast Period | 2026-2034 |
| Historical Period | 2020-2025 |
| Growth Rate | CAGR of 4.63% from 2020-2034 |
| Segmentation |
|
Table of Contents
- 1. Introduction
- 1.1. Research Scope
- 1.2. Market Segmentation
- 1.3. Research Methodology
- 1.4. Definitions and Assumptions
- 2. Executive Summary
- 2.1. Introduction
- 3. Market Dynamics
- 3.1. Introduction
- 3.2. Market Drivers
- 3.2.1. 4.; Increasing Investments in Offshore Wind Power Projects4.; Supportive Government Policies
- 3.3. Market Restrains
- 3.3.1. 4.; Increasing Adopting of Alternative Clean Energy Sources (Ex
- 3.4. Market Trends
- 3.4.1. The Onshore Sector is Expected to Dominate the Market
- 4. Market Factor Analysis
- 4.1. Porters Five Forces
- 4.2. Supply/Value Chain
- 4.3. PESTEL analysis
- 4.4. Market Entropy
- 4.5. Patent/Trademark Analysis
- 5. Global Christmas Tree Industry Analysis, Insights and Forecast, 2020-2032
- 5.1. Market Analysis, Insights and Forecast - by Type
- 5.1.1. Horizontal Tree
- 5.1.2. Vertical Tree
- 5.2. Market Analysis, Insights and Forecast - by Location of Deployment
- 5.2.1. Onshore
- 5.2.2. Offshore
- 5.3. Market Analysis, Insights and Forecast - by Region
- 5.3.1. North America
- 5.3.2. Europe
- 5.3.3. South America
- 5.3.4. Asia Pacific
- 5.3.5. Middle East and Africa
- 5.1. Market Analysis, Insights and Forecast - by Type
- 6. North America Christmas Tree Industry Analysis, Insights and Forecast, 2020-2032
- 6.1. Market Analysis, Insights and Forecast - by Type
- 6.1.1. Horizontal Tree
- 6.1.2. Vertical Tree
- 6.2. Market Analysis, Insights and Forecast - by Location of Deployment
- 6.2.1. Onshore
- 6.2.2. Offshore
- 6.1. Market Analysis, Insights and Forecast - by Type
- 7. Europe Christmas Tree Industry Analysis, Insights and Forecast, 2020-2032
- 7.1. Market Analysis, Insights and Forecast - by Type
- 7.1.1. Horizontal Tree
- 7.1.2. Vertical Tree
- 7.2. Market Analysis, Insights and Forecast - by Location of Deployment
- 7.2.1. Onshore
- 7.2.2. Offshore
- 7.1. Market Analysis, Insights and Forecast - by Type
- 8. South America Christmas Tree Industry Analysis, Insights and Forecast, 2020-2032
- 8.1. Market Analysis, Insights and Forecast - by Type
- 8.1.1. Horizontal Tree
- 8.1.2. Vertical Tree
- 8.2. Market Analysis, Insights and Forecast - by Location of Deployment
- 8.2.1. Onshore
- 8.2.2. Offshore
- 8.1. Market Analysis, Insights and Forecast - by Type
- 9. Asia Pacific Christmas Tree Industry Analysis, Insights and Forecast, 2020-2032
- 9.1. Market Analysis, Insights and Forecast - by Type
- 9.1.1. Horizontal Tree
- 9.1.2. Vertical Tree
- 9.2. Market Analysis, Insights and Forecast - by Location of Deployment
- 9.2.1. Onshore
- 9.2.2. Offshore
- 9.1. Market Analysis, Insights and Forecast - by Type
- 10. Middle East and Africa Christmas Tree Industry Analysis, Insights and Forecast, 2020-2032
- 10.1. Market Analysis, Insights and Forecast - by Type
- 10.1.1. Horizontal Tree
- 10.1.2. Vertical Tree
- 10.2. Market Analysis, Insights and Forecast - by Location of Deployment
- 10.2.1. Onshore
- 10.2.2. Offshore
- 10.1. Market Analysis, Insights and Forecast - by Type
- 11. Competitive Analysis
- 11.1. Global Market Share Analysis 2025
- 11.2. Company Profiles
- 11.2.1 Yantai Jereh Petroleum Equipment & Technologies Co Ltd
- 11.2.1.1. Overview
- 11.2.1.2. Products
- 11.2.1.3. SWOT Analysis
- 11.2.1.4. Recent Developments
- 11.2.1.5. Financials (Based on Availability)
- 11.2.2 Shengji Group
- 11.2.2.1. Overview
- 11.2.2.2. Products
- 11.2.2.3. SWOT Analysis
- 11.2.2.4. Recent Developments
- 11.2.2.5. Financials (Based on Availability)
- 11.2.3 Worldwide Oilfield Machine
- 11.2.3.1. Overview
- 11.2.3.2. Products
- 11.2.3.3. SWOT Analysis
- 11.2.3.4. Recent Developments
- 11.2.3.5. Financials (Based on Availability)
- 11.2.4 Dril-Quip Inc
- 11.2.4.1. Overview
- 11.2.4.2. Products
- 11.2.4.3. SWOT Analysis
- 11.2.4.4. Recent Developments
- 11.2.4.5. Financials (Based on Availability)
- 11.2.5 Baker Hughes Company
- 11.2.5.1. Overview
- 11.2.5.2. Products
- 11.2.5.3. SWOT Analysis
- 11.2.5.4. Recent Developments
- 11.2.5.5. Financials (Based on Availability)
- 11.2.6 Aker Solutions
- 11.2.6.1. Overview
- 11.2.6.2. Products
- 11.2.6.3. SWOT Analysis
- 11.2.6.4. Recent Developments
- 11.2.6.5. Financials (Based on Availability)
- 11.2.7 INTERA Ltd*List Not Exhaustive
- 11.2.7.1. Overview
- 11.2.7.2. Products
- 11.2.7.3. SWOT Analysis
- 11.2.7.4. Recent Developments
- 11.2.7.5. Financials (Based on Availability)
- 11.2.8 Schlumberger Limited
- 11.2.8.1. Overview
- 11.2.8.2. Products
- 11.2.8.3. SWOT Analysis
- 11.2.8.4. Recent Developments
- 11.2.8.5. Financials (Based on Availability)
- 11.2.9 TechnipFMC PLC
- 11.2.9.1. Overview
- 11.2.9.2. Products
- 11.2.9.3. SWOT Analysis
- 11.2.9.4. Recent Developments
- 11.2.9.5. Financials (Based on Availability)
- 11.2.1 Yantai Jereh Petroleum Equipment & Technologies Co Ltd
List of Figures
- Figure 1: Global Christmas Tree Industry Revenue Breakdown (billion, %) by Region 2025 & 2033
- Figure 2: Global Christmas Tree Industry Volume Breakdown (K Units, %) by Region 2025 & 2033
- Figure 3: North America Christmas Tree Industry Revenue (billion), by Type 2025 & 2033
- Figure 4: North America Christmas Tree Industry Volume (K Units), by Type 2025 & 2033
- Figure 5: North America Christmas Tree Industry Revenue Share (%), by Type 2025 & 2033
- Figure 6: North America Christmas Tree Industry Volume Share (%), by Type 2025 & 2033
- Figure 7: North America Christmas Tree Industry Revenue (billion), by Location of Deployment 2025 & 2033
- Figure 8: North America Christmas Tree Industry Volume (K Units), by Location of Deployment 2025 & 2033
- Figure 9: North America Christmas Tree Industry Revenue Share (%), by Location of Deployment 2025 & 2033
- Figure 10: North America Christmas Tree Industry Volume Share (%), by Location of Deployment 2025 & 2033
- Figure 11: North America Christmas Tree Industry Revenue (billion), by Country 2025 & 2033
- Figure 12: North America Christmas Tree Industry Volume (K Units), by Country 2025 & 2033
- Figure 13: North America Christmas Tree Industry Revenue Share (%), by Country 2025 & 2033
- Figure 14: North America Christmas Tree Industry Volume Share (%), by Country 2025 & 2033
- Figure 15: Europe Christmas Tree Industry Revenue (billion), by Type 2025 & 2033
- Figure 16: Europe Christmas Tree Industry Volume (K Units), by Type 2025 & 2033
- Figure 17: Europe Christmas Tree Industry Revenue Share (%), by Type 2025 & 2033
- Figure 18: Europe Christmas Tree Industry Volume Share (%), by Type 2025 & 2033
- Figure 19: Europe Christmas Tree Industry Revenue (billion), by Location of Deployment 2025 & 2033
- Figure 20: Europe Christmas Tree Industry Volume (K Units), by Location of Deployment 2025 & 2033
- Figure 21: Europe Christmas Tree Industry Revenue Share (%), by Location of Deployment 2025 & 2033
- Figure 22: Europe Christmas Tree Industry Volume Share (%), by Location of Deployment 2025 & 2033
- Figure 23: Europe Christmas Tree Industry Revenue (billion), by Country 2025 & 2033
- Figure 24: Europe Christmas Tree Industry Volume (K Units), by Country 2025 & 2033
- Figure 25: Europe Christmas Tree Industry Revenue Share (%), by Country 2025 & 2033
- Figure 26: Europe Christmas Tree Industry Volume Share (%), by Country 2025 & 2033
- Figure 27: South America Christmas Tree Industry Revenue (billion), by Type 2025 & 2033
- Figure 28: South America Christmas Tree Industry Volume (K Units), by Type 2025 & 2033
- Figure 29: South America Christmas Tree Industry Revenue Share (%), by Type 2025 & 2033
- Figure 30: South America Christmas Tree Industry Volume Share (%), by Type 2025 & 2033
- Figure 31: South America Christmas Tree Industry Revenue (billion), by Location of Deployment 2025 & 2033
- Figure 32: South America Christmas Tree Industry Volume (K Units), by Location of Deployment 2025 & 2033
- Figure 33: South America Christmas Tree Industry Revenue Share (%), by Location of Deployment 2025 & 2033
- Figure 34: South America Christmas Tree Industry Volume Share (%), by Location of Deployment 2025 & 2033
- Figure 35: South America Christmas Tree Industry Revenue (billion), by Country 2025 & 2033
- Figure 36: South America Christmas Tree Industry Volume (K Units), by Country 2025 & 2033
- Figure 37: South America Christmas Tree Industry Revenue Share (%), by Country 2025 & 2033
- Figure 38: South America Christmas Tree Industry Volume Share (%), by Country 2025 & 2033
- Figure 39: Asia Pacific Christmas Tree Industry Revenue (billion), by Type 2025 & 2033
- Figure 40: Asia Pacific Christmas Tree Industry Volume (K Units), by Type 2025 & 2033
- Figure 41: Asia Pacific Christmas Tree Industry Revenue Share (%), by Type 2025 & 2033
- Figure 42: Asia Pacific Christmas Tree Industry Volume Share (%), by Type 2025 & 2033
- Figure 43: Asia Pacific Christmas Tree Industry Revenue (billion), by Location of Deployment 2025 & 2033
- Figure 44: Asia Pacific Christmas Tree Industry Volume (K Units), by Location of Deployment 2025 & 2033
- Figure 45: Asia Pacific Christmas Tree Industry Revenue Share (%), by Location of Deployment 2025 & 2033
- Figure 46: Asia Pacific Christmas Tree Industry Volume Share (%), by Location of Deployment 2025 & 2033
- Figure 47: Asia Pacific Christmas Tree Industry Revenue (billion), by Country 2025 & 2033
- Figure 48: Asia Pacific Christmas Tree Industry Volume (K Units), by Country 2025 & 2033
- Figure 49: Asia Pacific Christmas Tree Industry Revenue Share (%), by Country 2025 & 2033
- Figure 50: Asia Pacific Christmas Tree Industry Volume Share (%), by Country 2025 & 2033
- Figure 51: Middle East and Africa Christmas Tree Industry Revenue (billion), by Type 2025 & 2033
- Figure 52: Middle East and Africa Christmas Tree Industry Volume (K Units), by Type 2025 & 2033
- Figure 53: Middle East and Africa Christmas Tree Industry Revenue Share (%), by Type 2025 & 2033
- Figure 54: Middle East and Africa Christmas Tree Industry Volume Share (%), by Type 2025 & 2033
- Figure 55: Middle East and Africa Christmas Tree Industry Revenue (billion), by Location of Deployment 2025 & 2033
- Figure 56: Middle East and Africa Christmas Tree Industry Volume (K Units), by Location of Deployment 2025 & 2033
- Figure 57: Middle East and Africa Christmas Tree Industry Revenue Share (%), by Location of Deployment 2025 & 2033
- Figure 58: Middle East and Africa Christmas Tree Industry Volume Share (%), by Location of Deployment 2025 & 2033
- Figure 59: Middle East and Africa Christmas Tree Industry Revenue (billion), by Country 2025 & 2033
- Figure 60: Middle East and Africa Christmas Tree Industry Volume (K Units), by Country 2025 & 2033
- Figure 61: Middle East and Africa Christmas Tree Industry Revenue Share (%), by Country 2025 & 2033
- Figure 62: Middle East and Africa Christmas Tree Industry Volume Share (%), by Country 2025 & 2033
List of Tables
- Table 1: Global Christmas Tree Industry Revenue billion Forecast, by Type 2020 & 2033
- Table 2: Global Christmas Tree Industry Volume K Units Forecast, by Type 2020 & 2033
- Table 3: Global Christmas Tree Industry Revenue billion Forecast, by Location of Deployment 2020 & 2033
- Table 4: Global Christmas Tree Industry Volume K Units Forecast, by Location of Deployment 2020 & 2033
- Table 5: Global Christmas Tree Industry Revenue billion Forecast, by Region 2020 & 2033
- Table 6: Global Christmas Tree Industry Volume K Units Forecast, by Region 2020 & 2033
- Table 7: Global Christmas Tree Industry Revenue billion Forecast, by Type 2020 & 2033
- Table 8: Global Christmas Tree Industry Volume K Units Forecast, by Type 2020 & 2033
- Table 9: Global Christmas Tree Industry Revenue billion Forecast, by Location of Deployment 2020 & 2033
- Table 10: Global Christmas Tree Industry Volume K Units Forecast, by Location of Deployment 2020 & 2033
- Table 11: Global Christmas Tree Industry Revenue billion Forecast, by Country 2020 & 2033
- Table 12: Global Christmas Tree Industry Volume K Units Forecast, by Country 2020 & 2033
- Table 13: Global Christmas Tree Industry Revenue billion Forecast, by Type 2020 & 2033
- Table 14: Global Christmas Tree Industry Volume K Units Forecast, by Type 2020 & 2033
- Table 15: Global Christmas Tree Industry Revenue billion Forecast, by Location of Deployment 2020 & 2033
- Table 16: Global Christmas Tree Industry Volume K Units Forecast, by Location of Deployment 2020 & 2033
- Table 17: Global Christmas Tree Industry Revenue billion Forecast, by Country 2020 & 2033
- Table 18: Global Christmas Tree Industry Volume K Units Forecast, by Country 2020 & 2033
- Table 19: Global Christmas Tree Industry Revenue billion Forecast, by Type 2020 & 2033
- Table 20: Global Christmas Tree Industry Volume K Units Forecast, by Type 2020 & 2033
- Table 21: Global Christmas Tree Industry Revenue billion Forecast, by Location of Deployment 2020 & 2033
- Table 22: Global Christmas Tree Industry Volume K Units Forecast, by Location of Deployment 2020 & 2033
- Table 23: Global Christmas Tree Industry Revenue billion Forecast, by Country 2020 & 2033
- Table 24: Global Christmas Tree Industry Volume K Units Forecast, by Country 2020 & 2033
- Table 25: Global Christmas Tree Industry Revenue billion Forecast, by Type 2020 & 2033
- Table 26: Global Christmas Tree Industry Volume K Units Forecast, by Type 2020 & 2033
- Table 27: Global Christmas Tree Industry Revenue billion Forecast, by Location of Deployment 2020 & 2033
- Table 28: Global Christmas Tree Industry Volume K Units Forecast, by Location of Deployment 2020 & 2033
- Table 29: Global Christmas Tree Industry Revenue billion Forecast, by Country 2020 & 2033
- Table 30: Global Christmas Tree Industry Volume K Units Forecast, by Country 2020 & 2033
- Table 31: Global Christmas Tree Industry Revenue billion Forecast, by Type 2020 & 2033
- Table 32: Global Christmas Tree Industry Volume K Units Forecast, by Type 2020 & 2033
- Table 33: Global Christmas Tree Industry Revenue billion Forecast, by Location of Deployment 2020 & 2033
- Table 34: Global Christmas Tree Industry Volume K Units Forecast, by Location of Deployment 2020 & 2033
- Table 35: Global Christmas Tree Industry Revenue billion Forecast, by Country 2020 & 2033
- Table 36: Global Christmas Tree Industry Volume K Units Forecast, by Country 2020 & 2033
Frequently Asked Questions
1. What is the projected Compound Annual Growth Rate (CAGR) of the Christmas Tree Industry?
The projected CAGR is approximately 4.63%.
2. Which companies are prominent players in the Christmas Tree Industry?
Key companies in the market include Yantai Jereh Petroleum Equipment & Technologies Co Ltd, Shengji Group, Worldwide Oilfield Machine, Dril-Quip Inc, Baker Hughes Company, Aker Solutions, INTERA Ltd*List Not Exhaustive, Schlumberger Limited, TechnipFMC PLC.
3. What are the main segments of the Christmas Tree Industry?
The market segments include Type, Location of Deployment.
4. Can you provide details about the market size?
The market size is estimated to be USD 1.27 billion as of 2022.
5. What are some drivers contributing to market growth?
4.; Increasing Investments in Offshore Wind Power Projects4.; Supportive Government Policies.
6. What are the notable trends driving market growth?
The Onshore Sector is Expected to Dominate the Market.
7. Are there any restraints impacting market growth?
4.; Increasing Adopting of Alternative Clean Energy Sources (Ex: Solar. Hydro).
8. Can you provide examples of recent developments in the market?
July 2022: China National Offshore Oil Corporation (CNOOC) launched its first self-developed subsea Christmas tree (Xmas) system in the Bohai Sea. The subsea Xmas oil and gas extraction system was installed in the Jinzhou 31-1 gas field in the Bohai Sea with a daily trial output of 310,000 cubic meters, able to meet the gas usage needs of 1,500 households for an entire year. The system was designed in a compact structure, weighing 24.8 tons. It is suitable for use in shallow water and has an expected operating life of 15 years.
9. What pricing options are available for accessing the report?
Pricing options include single-user, multi-user, and enterprise licenses priced at USD 4750, USD 5250, and USD 8750 respectively.
10. Is the market size provided in terms of value or volume?
The market size is provided in terms of value, measured in billion and volume, measured in K Units.
11. Are there any specific market keywords associated with the report?
Yes, the market keyword associated with the report is "Christmas Tree Industry," which aids in identifying and referencing the specific market segment covered.
12. How do I determine which pricing option suits my needs best?
The pricing options vary based on user requirements and access needs. Individual users may opt for single-user licenses, while businesses requiring broader access may choose multi-user or enterprise licenses for cost-effective access to the report.
13. Are there any additional resources or data provided in the Christmas Tree Industry report?
While the report offers comprehensive insights, it's advisable to review the specific contents or supplementary materials provided to ascertain if additional resources or data are available.
14. How can I stay updated on further developments or reports in the Christmas Tree Industry?
To stay informed about further developments, trends, and reports in the Christmas Tree Industry, consider subscribing to industry newsletters, following relevant companies and organizations, or regularly checking reputable industry news sources and publications.
Methodology
Step 1 - Identification of Relevant Samples Size from Population Database


Step 2 - Approaches for Defining Global Market Size (Value, Volume* & Price*)

Note*: In applicable scenarios
Step 3 - Data Sources
Primary Research
- Web Analytics
- Survey Reports
- Research Institute
- Latest Research Reports
- Opinion Leaders
Secondary Research
- Annual Reports
- White Paper
- Latest Press Release
- Industry Association
- Paid Database
- Investor Presentations

Step 4 - Data Triangulation
Involves using different sources of information in order to increase the validity of a study
These sources are likely to be stakeholders in a program - participants, other researchers, program staff, other community members, and so on.
Then we put all data in single framework & apply various statistical tools to find out the dynamic on the market.
During the analysis stage, feedback from the stakeholder groups would be compared to determine areas of agreement as well as areas of divergence