

Key Insights
The global ladder industry, currently valued at approximately $XX million (estimated based on available CAGR and market size data), is experiencing robust growth, exhibiting a Compound Annual Growth Rate (CAGR) exceeding 4.50%. This expansion is driven by several key factors. Increased construction activity globally, particularly in developing economies experiencing rapid urbanization, fuels significant demand for ladders across residential, commercial, and industrial sectors. Furthermore, rising safety regulations and awareness of workplace safety are prompting a shift toward higher-quality, more durable ladders, boosting market value. The growing popularity of DIY home improvement projects among consumers is also contributing to the market's upward trajectory. While material costs and supply chain disruptions can pose challenges, innovation in lightweight yet strong materials like aluminum and fiberglass is mitigating some of these restraints. The industry is witnessing a trend toward specialized ladders catering to niche applications, such as telescopic ladders for difficult-to-reach areas and ladders designed for specific professional uses.
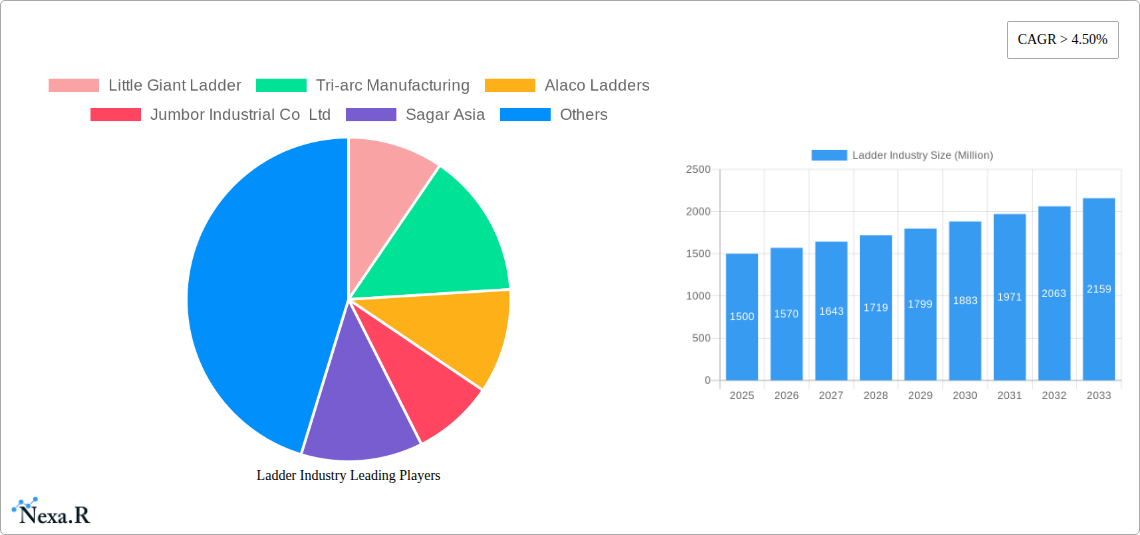
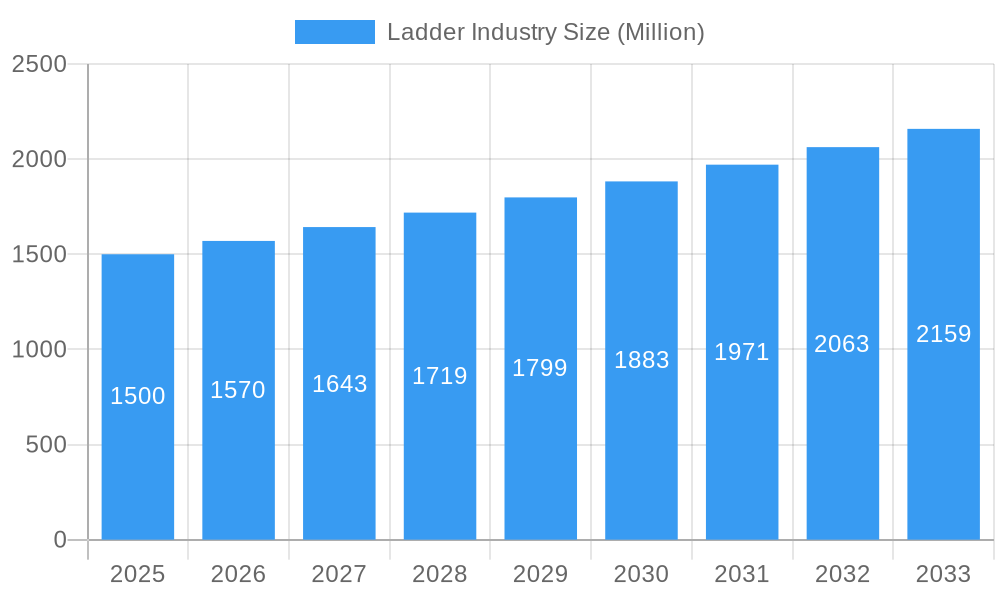
Ladder Industry Market Size (In Billion)
Segment analysis reveals significant market share for aluminum ladders due to their lightweight and corrosion-resistant properties, followed by steel ladders preferred for their strength in heavy-duty applications. The household segment dominates in terms of volume, while the industrial sector contributes significantly to the overall value due to higher-priced, specialized equipment. Geographically, North America and Europe currently hold substantial market shares, but the Asia-Pacific region is projected to experience the fastest growth in the coming years fueled by infrastructure development and expanding industrial sectors. Leading players like Werner Co, Louisville Ladder, and Little Giant Ladder are leveraging innovation and brand recognition to maintain their competitive edge. The forecast period (2025-2033) anticipates sustained growth, with opportunities arising from emerging markets and the ongoing development of innovative ladder designs and materials.
Ladder Industry Company Market Share
Ladder Industry Market Report: 2019-2033
This comprehensive report provides an in-depth analysis of the global ladder industry, encompassing market dynamics, growth trends, regional dominance, product landscape, challenges, opportunities, and key players. The study period spans 2019-2033, with 2025 serving as the base and estimated year. The forecast period is 2025-2033, and the historical period covers 2019-2024. This report is crucial for industry professionals, investors, and anyone seeking to understand this dynamic market. The market size in 2025 is estimated at $XX Million.
Ladder Industry Market Dynamics & Structure
The global ladder market, valued at $XX Million in 2025, exhibits a moderately concentrated structure with key players holding significant market share. Technological innovation, particularly in materials science (lighter, stronger alloys) and safety features (enhanced fall protection), is a crucial driver. Stringent safety regulations, varying across regions, impact product design and manufacturing. Competitive substitutes, such as scaffolding and elevating work platforms, exert pressure on market growth. End-user demographics, primarily construction professionals and homeowners, influence demand patterns. The industry has witnessed a moderate level of M&A activity in recent years, with consolidation expected to continue.
- Market Concentration: Moderately concentrated, with top 5 players holding approximately xx% market share in 2025.
- Technological Innovation: Focus on lightweight, high-strength materials (aluminum alloys, carbon fiber), improved ergonomics, and integrated safety features.
- Regulatory Landscape: Stringent safety standards (e.g., ANSI, EN) influence product design and compliance costs.
- Competitive Substitutes: Scaffolding, aerial work platforms, and other access equipment pose competition.
- End-User Demographics: Significant demand from construction, industrial, and DIY sectors, with household consumers contributing a substantial portion.
- M&A Activity: xx M&A deals recorded between 2019-2024, indicating a moderate level of consolidation.
Ladder Industry Growth Trends & Insights
The global ladder market demonstrates steady growth, driven by robust demand from the construction and industrial sectors. The market experienced a CAGR of xx% during the historical period (2019-2024), and is projected to grow at a CAGR of xx% during the forecast period (2025-2033). This growth is fueled by increasing infrastructure development, rising construction activity globally, and a growing DIY market. Technological advancements, such as the introduction of lightweight yet durable materials and improved safety features, contribute significantly to market expansion. Shifting consumer preferences towards safer and more user-friendly ladders further propel market growth. Market penetration in developing economies remains high, presenting lucrative opportunities for expansion.
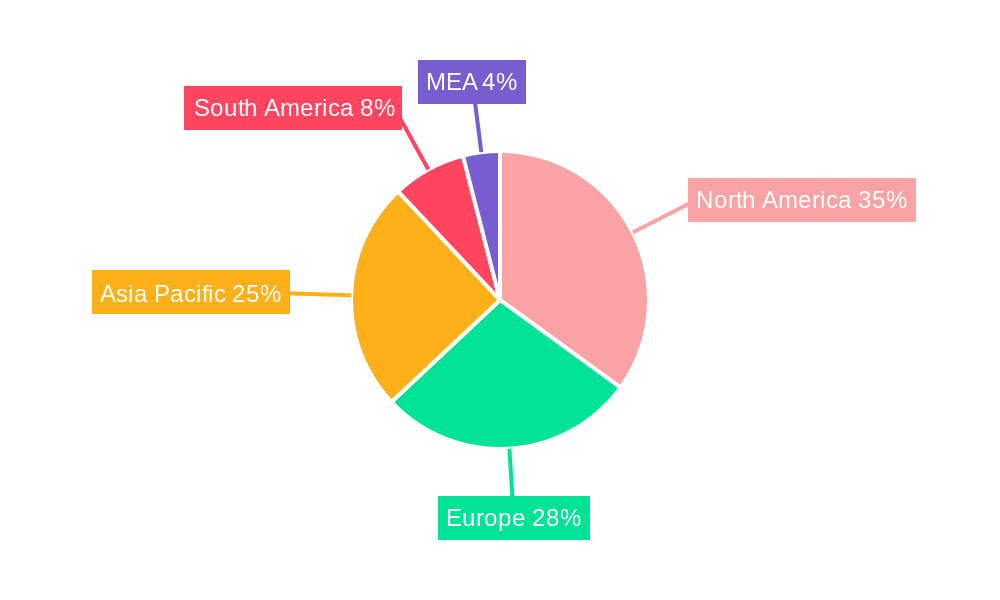
Dominant Regions, Countries, or Segments in Ladder Industry
North America and Europe currently dominate the ladder market, driven by high construction activity and a robust DIY culture. However, Asia-Pacific is witnessing the fastest growth, fueled by rapid urbanization and infrastructure development. Within material types, aluminum ladders hold the largest market share due to their lightweight yet sturdy nature. In terms of application, the commercial and industrial segments dominate, followed by the household sector.
- Leading Regions: North America (xx% market share in 2025), Europe (xx%), Asia-Pacific (xx%).
- Growth Drivers: Robust construction activity (North America, Europe), rapid urbanization (Asia-Pacific), increasing industrialization.
- Dominant Segments: Aluminum ladders (by material), commercial and industrial applications (by application).
- Growth Potential: High growth potential in emerging economies (Asia-Pacific, Latin America) driven by infrastructure investments.
Ladder Industry Product Landscape
The ladder market offers a diverse range of products, including step ladders, extension ladders, scaffold ladders, and specialized industrial ladders. Innovation focuses on lightweight, high-strength materials, enhanced safety features (e.g., integrated fall arrest systems), improved ergonomics, and multi-functional designs. Unique selling propositions include superior weight-bearing capacity, enhanced stability, and user-friendly features. Technological advancements are driven by material science, improved manufacturing techniques, and advanced safety systems.
Key Drivers, Barriers & Challenges in Ladder Industry
Key Drivers:
- Growing infrastructure development and construction activity globally.
- Increasing demand from the industrial and commercial sectors.
- Technological advancements in materials science and safety features.
- Rising disposable incomes and DIY culture in developing economies.
Challenges & Restraints:
- Fluctuations in raw material prices (aluminum, steel).
- Stringent safety regulations and compliance costs.
- Intense competition from established players and new entrants.
- Supply chain disruptions impacting production and distribution. This resulted in a xx% increase in prices in 2022.
Emerging Opportunities in Ladder Industry
- Expansion into untapped markets in developing economies.
- Development of innovative ladder designs for specific applications (e.g., solar panel installation).
- Growing demand for smart ladders with integrated sensors and safety systems.
- Focus on sustainable and eco-friendly ladder materials (e.g., recycled aluminum).
Growth Accelerators in the Ladder Industry
Technological breakthroughs in material science and manufacturing processes are key growth catalysts. Strategic partnerships between ladder manufacturers and construction companies can enhance market penetration. Expansion into new markets, particularly in developing economies, offers significant growth potential.
Key Players Shaping the Ladder Industry Market
- Little Giant Ladder
- Tri-arc Manufacturing
- Alaco Ladders
- Jumbor Industrial Co Ltd
- Sagar Asia
- TB Davies (Cardiff)
- Bauer Ladder Inc
- Louisville Ladder
- Tubesca-comabi
- Werner Co (Werner ladder)
- Gorilla Ladder
Notable Milestones in Ladder Industry Sector
- 2020: Introduction of a new lightweight aluminum ladder by Werner Co.
- 2021: Merger between two regional ladder manufacturers in Europe.
- 2022: Launch of a smart ladder with integrated fall detection system.
- 2023: Implementation of new safety regulations in the US impacting ladder design.
In-Depth Ladder Industry Market Outlook
The ladder industry is poised for continued growth, driven by ongoing infrastructure development, technological advancements, and expansion into new markets. Strategic partnerships, product diversification, and a focus on sustainability will be crucial for success. The market is expected to reach $XX Million by 2033, presenting significant opportunities for established players and new entrants alike.
Ladder Industry Segmentation
- 1. Production Analysis
- 2. Consumption Analysis
- 3. Import Market Analysis (Value & Volume)
- 4. Export Market Analysis (Value & Volume)
- 5. Price Trend Analysis
Ladder Industry Segmentation By Geography
-
1. North America
- 1.1. United States
- 1.2. Canada
- 1.3. Mexico
-
2. South America
- 2.1. Brazil
- 2.2. Argentina
- 2.3. Rest of South America
-
3. Europe
- 3.1. United Kingdom
- 3.2. Germany
- 3.3. France
- 3.4. Italy
- 3.5. Spain
- 3.6. Russia
- 3.7. Benelux
- 3.8. Nordics
- 3.9. Rest of Europe
-
4. Middle East & Africa
- 4.1. Turkey
- 4.2. Israel
- 4.3. GCC
- 4.4. North Africa
- 4.5. South Africa
- 4.6. Rest of Middle East & Africa
-
5. Asia Pacific
- 5.1. China
- 5.2. India
- 5.3. Japan
- 5.4. South Korea
- 5.5. ASEAN
- 5.6. Oceania
- 5.7. Rest of Asia Pacific
Ladder Industry Regional Market Share
Geographic Coverage of Ladder Industry
Ladder Industry REPORT HIGHLIGHTS
| Aspects | Details |
|---|---|
| Study Period | 2020-2034 |
| Base Year | 2025 |
| Estimated Year | 2026 |
| Forecast Period | 2026-2034 |
| Historical Period | 2020-2025 |
| Growth Rate | CAGR of > 4.50% from 2020-2034 |
| Segmentation |
|
Table of Contents
- 1. Introduction
- 1.1. Research Scope
- 1.2. Market Segmentation
- 1.3. Research Objective
- 1.4. Definitions and Assumptions
- 2. Executive Summary
- 2.1. Market Snapshot
- 3. Market Dynamics
- 3.1. Market Drivers
- 3.2. Market Restrains
- 3.3. Market Trends
- 3.4. Market Opportunities
- 4. Market Factor Analysis
- 4.1. Porters Five Forces
- 4.1.1. Bargaining Power of Suppliers
- 4.1.2. Bargaining Power of Buyers
- 4.1.3. Threat of New Entrants
- 4.1.4. Threat of Substitutes
- 4.1.5. Competitive Rivalry
- 4.2. PESTEL analysis
- 4.3. BCG Analysis
- 4.3.1. Stars (High Growth, High Market Share)
- 4.3.2. Cash Cows (Low Growth, High Market Share)
- 4.3.3. Question Mark (High Growth, Low Market Share)
- 4.3.4. Dogs (Low Growth, Low Market Share)
- 4.4. Ansoff Matrix Analysis
- 4.5. Supply Chain Analysis
- 4.6. Regulatory Landscape
- 4.7. Current Market Potential and Opportunity Assessment (TAM–SAM–SOM Framework)
- 4.8. NRP Analyst Note
- 4.1. Porters Five Forces
- 5. Market Analysis, Insights and Forecast 2021-2033
- 5.1. Market Analysis, Insights and Forecast - by Production Analysis
- 5.2. Market Analysis, Insights and Forecast - by Consumption Analysis
- 5.3. Market Analysis, Insights and Forecast - by Import Market Analysis (Value & Volume)
- 5.4. Market Analysis, Insights and Forecast - by Export Market Analysis (Value & Volume)
- 5.5. Market Analysis, Insights and Forecast - by Price Trend Analysis
- 5.6. Market Analysis, Insights and Forecast - by Region
- 5.6.1. North America
- 5.6.2. South America
- 5.6.3. Europe
- 5.6.4. Middle East & Africa
- 5.6.5. Asia Pacific
- 6. Global Ladder Industry Analysis, Insights and Forecast, 2021-2033
- 6.1. Market Analysis, Insights and Forecast - by Production Analysis
- 6.2. Market Analysis, Insights and Forecast - by Consumption Analysis
- 6.3. Market Analysis, Insights and Forecast - by Import Market Analysis (Value & Volume)
- 6.4. Market Analysis, Insights and Forecast - by Export Market Analysis (Value & Volume)
- 6.5. Market Analysis, Insights and Forecast - by Price Trend Analysis
- 7. North America Ladder Industry Analysis, Insights and Forecast, 2020-2032
- 7.1. Market Analysis, Insights and Forecast - by Production Analysis
- 7.2. Market Analysis, Insights and Forecast - by Consumption Analysis
- 7.3. Market Analysis, Insights and Forecast - by Import Market Analysis (Value & Volume)
- 7.4. Market Analysis, Insights and Forecast - by Export Market Analysis (Value & Volume)
- 7.5. Market Analysis, Insights and Forecast - by Price Trend Analysis
- 8. South America Ladder Industry Analysis, Insights and Forecast, 2020-2032
- 8.1. Market Analysis, Insights and Forecast - by Production Analysis
- 8.2. Market Analysis, Insights and Forecast - by Consumption Analysis
- 8.3. Market Analysis, Insights and Forecast - by Import Market Analysis (Value & Volume)
- 8.4. Market Analysis, Insights and Forecast - by Export Market Analysis (Value & Volume)
- 8.5. Market Analysis, Insights and Forecast - by Price Trend Analysis
- 9. Europe Ladder Industry Analysis, Insights and Forecast, 2020-2032
- 9.1. Market Analysis, Insights and Forecast - by Production Analysis
- 9.2. Market Analysis, Insights and Forecast - by Consumption Analysis
- 9.3. Market Analysis, Insights and Forecast - by Import Market Analysis (Value & Volume)
- 9.4. Market Analysis, Insights and Forecast - by Export Market Analysis (Value & Volume)
- 9.5. Market Analysis, Insights and Forecast - by Price Trend Analysis
- 10. Middle East & Africa Ladder Industry Analysis, Insights and Forecast, 2020-2032
- 10.1. Market Analysis, Insights and Forecast - by Production Analysis
- 10.2. Market Analysis, Insights and Forecast - by Consumption Analysis
- 10.3. Market Analysis, Insights and Forecast - by Import Market Analysis (Value & Volume)
- 10.4. Market Analysis, Insights and Forecast - by Export Market Analysis (Value & Volume)
- 10.5. Market Analysis, Insights and Forecast - by Price Trend Analysis
- 11. Asia Pacific Ladder Industry Analysis, Insights and Forecast, 2020-2032
- 11.1. Market Analysis, Insights and Forecast - by Production Analysis
- 11.2. Market Analysis, Insights and Forecast - by Consumption Analysis
- 11.3. Market Analysis, Insights and Forecast - by Import Market Analysis (Value & Volume)
- 11.4. Market Analysis, Insights and Forecast - by Export Market Analysis (Value & Volume)
- 11.5. Market Analysis, Insights and Forecast - by Price Trend Analysis
- 12. Competitive Analysis
- 12.1. Company Profiles
- 12.1.1 Little Giant Ladder
- 12.1.1.1. Company Overview
- 12.1.1.2. Products
- 12.1.1.3. Company Financials
- 12.1.1.4. SWOT Analysis
- 12.1.2 Tri-arc Manufacturing
- 12.1.2.1. Company Overview
- 12.1.2.2. Products
- 12.1.2.3. Company Financials
- 12.1.2.4. SWOT Analysis
- 12.1.3 Alaco Ladders
- 12.1.3.1. Company Overview
- 12.1.3.2. Products
- 12.1.3.3. Company Financials
- 12.1.3.4. SWOT Analysis
- 12.1.4 Jumbor Industrial Co Ltd
- 12.1.4.1. Company Overview
- 12.1.4.2. Products
- 12.1.4.3. Company Financials
- 12.1.4.4. SWOT Analysis
- 12.1.5 Sagar Asia
- 12.1.5.1. Company Overview
- 12.1.5.2. Products
- 12.1.5.3. Company Financials
- 12.1.5.4. SWOT Analysis
- 12.1.6 TB Davies (Cardiff)
- 12.1.6.1. Company Overview
- 12.1.6.2. Products
- 12.1.6.3. Company Financials
- 12.1.6.4. SWOT Analysis
- 12.1.7 Bauer Ladder Inc
- 12.1.7.1. Company Overview
- 12.1.7.2. Products
- 12.1.7.3. Company Financials
- 12.1.7.4. SWOT Analysis
- 12.1.8 Louisville Ladder
- 12.1.8.1. Company Overview
- 12.1.8.2. Products
- 12.1.8.3. Company Financials
- 12.1.8.4. SWOT Analysis
- 12.1.9 Tubesca-comabi
- 12.1.9.1. Company Overview
- 12.1.9.2. Products
- 12.1.9.3. Company Financials
- 12.1.9.4. SWOT Analysis
- 12.1.10 Werner Co ( Werner ladder)
- 12.1.10.1. Company Overview
- 12.1.10.2. Products
- 12.1.10.3. Company Financials
- 12.1.10.4. SWOT Analysis
- 12.1.11 Gorilla Ladder
- 12.1.11.1. Company Overview
- 12.1.11.2. Products
- 12.1.11.3. Company Financials
- 12.1.11.4. SWOT Analysis
- 12.1.1 Little Giant Ladder
- 12.2. Market Entropy
- 12.2.1 Company's Key Areas Served
- 12.2.2 Recent Developments
- 12.3. Company Market Share Analysis 2025
- 12.3.1 Top 5 Companies Market Share Analysis
- 12.3.2 Top 3 Companies Market Share Analysis
- 12.4. List of Potential Customers
- 13. Research Methodology
List of Figures
- Figure 1: Global Ladder Industry Revenue Breakdown (Million, %) by Region 2025 & 2033
- Figure 2: North America Ladder Industry Revenue (Million), by Production Analysis 2025 & 2033
- Figure 3: North America Ladder Industry Revenue Share (%), by Production Analysis 2025 & 2033
- Figure 4: North America Ladder Industry Revenue (Million), by Consumption Analysis 2025 & 2033
- Figure 5: North America Ladder Industry Revenue Share (%), by Consumption Analysis 2025 & 2033
- Figure 6: North America Ladder Industry Revenue (Million), by Import Market Analysis (Value & Volume) 2025 & 2033
- Figure 7: North America Ladder Industry Revenue Share (%), by Import Market Analysis (Value & Volume) 2025 & 2033
- Figure 8: North America Ladder Industry Revenue (Million), by Export Market Analysis (Value & Volume) 2025 & 2033
- Figure 9: North America Ladder Industry Revenue Share (%), by Export Market Analysis (Value & Volume) 2025 & 2033
- Figure 10: North America Ladder Industry Revenue (Million), by Price Trend Analysis 2025 & 2033
- Figure 11: North America Ladder Industry Revenue Share (%), by Price Trend Analysis 2025 & 2033
- Figure 12: North America Ladder Industry Revenue (Million), by Country 2025 & 2033
- Figure 13: North America Ladder Industry Revenue Share (%), by Country 2025 & 2033
- Figure 14: South America Ladder Industry Revenue (Million), by Production Analysis 2025 & 2033
- Figure 15: South America Ladder Industry Revenue Share (%), by Production Analysis 2025 & 2033
- Figure 16: South America Ladder Industry Revenue (Million), by Consumption Analysis 2025 & 2033
- Figure 17: South America Ladder Industry Revenue Share (%), by Consumption Analysis 2025 & 2033
- Figure 18: South America Ladder Industry Revenue (Million), by Import Market Analysis (Value & Volume) 2025 & 2033
- Figure 19: South America Ladder Industry Revenue Share (%), by Import Market Analysis (Value & Volume) 2025 & 2033
- Figure 20: South America Ladder Industry Revenue (Million), by Export Market Analysis (Value & Volume) 2025 & 2033
- Figure 21: South America Ladder Industry Revenue Share (%), by Export Market Analysis (Value & Volume) 2025 & 2033
- Figure 22: South America Ladder Industry Revenue (Million), by Price Trend Analysis 2025 & 2033
- Figure 23: South America Ladder Industry Revenue Share (%), by Price Trend Analysis 2025 & 2033
- Figure 24: South America Ladder Industry Revenue (Million), by Country 2025 & 2033
- Figure 25: South America Ladder Industry Revenue Share (%), by Country 2025 & 2033
- Figure 26: Europe Ladder Industry Revenue (Million), by Production Analysis 2025 & 2033
- Figure 27: Europe Ladder Industry Revenue Share (%), by Production Analysis 2025 & 2033
- Figure 28: Europe Ladder Industry Revenue (Million), by Consumption Analysis 2025 & 2033
- Figure 29: Europe Ladder Industry Revenue Share (%), by Consumption Analysis 2025 & 2033
- Figure 30: Europe Ladder Industry Revenue (Million), by Import Market Analysis (Value & Volume) 2025 & 2033
- Figure 31: Europe Ladder Industry Revenue Share (%), by Import Market Analysis (Value & Volume) 2025 & 2033
- Figure 32: Europe Ladder Industry Revenue (Million), by Export Market Analysis (Value & Volume) 2025 & 2033
- Figure 33: Europe Ladder Industry Revenue Share (%), by Export Market Analysis (Value & Volume) 2025 & 2033
- Figure 34: Europe Ladder Industry Revenue (Million), by Price Trend Analysis 2025 & 2033
- Figure 35: Europe Ladder Industry Revenue Share (%), by Price Trend Analysis 2025 & 2033
- Figure 36: Europe Ladder Industry Revenue (Million), by Country 2025 & 2033
- Figure 37: Europe Ladder Industry Revenue Share (%), by Country 2025 & 2033
- Figure 38: Middle East & Africa Ladder Industry Revenue (Million), by Production Analysis 2025 & 2033
- Figure 39: Middle East & Africa Ladder Industry Revenue Share (%), by Production Analysis 2025 & 2033
- Figure 40: Middle East & Africa Ladder Industry Revenue (Million), by Consumption Analysis 2025 & 2033
- Figure 41: Middle East & Africa Ladder Industry Revenue Share (%), by Consumption Analysis 2025 & 2033
- Figure 42: Middle East & Africa Ladder Industry Revenue (Million), by Import Market Analysis (Value & Volume) 2025 & 2033
- Figure 43: Middle East & Africa Ladder Industry Revenue Share (%), by Import Market Analysis (Value & Volume) 2025 & 2033
- Figure 44: Middle East & Africa Ladder Industry Revenue (Million), by Export Market Analysis (Value & Volume) 2025 & 2033
- Figure 45: Middle East & Africa Ladder Industry Revenue Share (%), by Export Market Analysis (Value & Volume) 2025 & 2033
- Figure 46: Middle East & Africa Ladder Industry Revenue (Million), by Price Trend Analysis 2025 & 2033
- Figure 47: Middle East & Africa Ladder Industry Revenue Share (%), by Price Trend Analysis 2025 & 2033
- Figure 48: Middle East & Africa Ladder Industry Revenue (Million), by Country 2025 & 2033
- Figure 49: Middle East & Africa Ladder Industry Revenue Share (%), by Country 2025 & 2033
- Figure 50: Asia Pacific Ladder Industry Revenue (Million), by Production Analysis 2025 & 2033
- Figure 51: Asia Pacific Ladder Industry Revenue Share (%), by Production Analysis 2025 & 2033
- Figure 52: Asia Pacific Ladder Industry Revenue (Million), by Consumption Analysis 2025 & 2033
- Figure 53: Asia Pacific Ladder Industry Revenue Share (%), by Consumption Analysis 2025 & 2033
- Figure 54: Asia Pacific Ladder Industry Revenue (Million), by Import Market Analysis (Value & Volume) 2025 & 2033
- Figure 55: Asia Pacific Ladder Industry Revenue Share (%), by Import Market Analysis (Value & Volume) 2025 & 2033
- Figure 56: Asia Pacific Ladder Industry Revenue (Million), by Export Market Analysis (Value & Volume) 2025 & 2033
- Figure 57: Asia Pacific Ladder Industry Revenue Share (%), by Export Market Analysis (Value & Volume) 2025 & 2033
- Figure 58: Asia Pacific Ladder Industry Revenue (Million), by Price Trend Analysis 2025 & 2033
- Figure 59: Asia Pacific Ladder Industry Revenue Share (%), by Price Trend Analysis 2025 & 2033
- Figure 60: Asia Pacific Ladder Industry Revenue (Million), by Country 2025 & 2033
- Figure 61: Asia Pacific Ladder Industry Revenue Share (%), by Country 2025 & 2033
List of Tables
- Table 1: Global Ladder Industry Revenue Million Forecast, by Production Analysis 2020 & 2033
- Table 2: Global Ladder Industry Revenue Million Forecast, by Consumption Analysis 2020 & 2033
- Table 3: Global Ladder Industry Revenue Million Forecast, by Import Market Analysis (Value & Volume) 2020 & 2033
- Table 4: Global Ladder Industry Revenue Million Forecast, by Export Market Analysis (Value & Volume) 2020 & 2033
- Table 5: Global Ladder Industry Revenue Million Forecast, by Price Trend Analysis 2020 & 2033
- Table 6: Global Ladder Industry Revenue Million Forecast, by Region 2020 & 2033
- Table 7: Global Ladder Industry Revenue Million Forecast, by Production Analysis 2020 & 2033
- Table 8: Global Ladder Industry Revenue Million Forecast, by Consumption Analysis 2020 & 2033
- Table 9: Global Ladder Industry Revenue Million Forecast, by Import Market Analysis (Value & Volume) 2020 & 2033
- Table 10: Global Ladder Industry Revenue Million Forecast, by Export Market Analysis (Value & Volume) 2020 & 2033
- Table 11: Global Ladder Industry Revenue Million Forecast, by Price Trend Analysis 2020 & 2033
- Table 12: Global Ladder Industry Revenue Million Forecast, by Country 2020 & 2033
- Table 13: United States Ladder Industry Revenue (Million) Forecast, by Application 2020 & 2033
- Table 14: Canada Ladder Industry Revenue (Million) Forecast, by Application 2020 & 2033
- Table 15: Mexico Ladder Industry Revenue (Million) Forecast, by Application 2020 & 2033
- Table 16: Global Ladder Industry Revenue Million Forecast, by Production Analysis 2020 & 2033
- Table 17: Global Ladder Industry Revenue Million Forecast, by Consumption Analysis 2020 & 2033
- Table 18: Global Ladder Industry Revenue Million Forecast, by Import Market Analysis (Value & Volume) 2020 & 2033
- Table 19: Global Ladder Industry Revenue Million Forecast, by Export Market Analysis (Value & Volume) 2020 & 2033
- Table 20: Global Ladder Industry Revenue Million Forecast, by Price Trend Analysis 2020 & 2033
- Table 21: Global Ladder Industry Revenue Million Forecast, by Country 2020 & 2033
- Table 22: Brazil Ladder Industry Revenue (Million) Forecast, by Application 2020 & 2033
- Table 23: Argentina Ladder Industry Revenue (Million) Forecast, by Application 2020 & 2033
- Table 24: Rest of South America Ladder Industry Revenue (Million) Forecast, by Application 2020 & 2033
- Table 25: Global Ladder Industry Revenue Million Forecast, by Production Analysis 2020 & 2033
- Table 26: Global Ladder Industry Revenue Million Forecast, by Consumption Analysis 2020 & 2033
- Table 27: Global Ladder Industry Revenue Million Forecast, by Import Market Analysis (Value & Volume) 2020 & 2033
- Table 28: Global Ladder Industry Revenue Million Forecast, by Export Market Analysis (Value & Volume) 2020 & 2033
- Table 29: Global Ladder Industry Revenue Million Forecast, by Price Trend Analysis 2020 & 2033
- Table 30: Global Ladder Industry Revenue Million Forecast, by Country 2020 & 2033
- Table 31: United Kingdom Ladder Industry Revenue (Million) Forecast, by Application 2020 & 2033
- Table 32: Germany Ladder Industry Revenue (Million) Forecast, by Application 2020 & 2033
- Table 33: France Ladder Industry Revenue (Million) Forecast, by Application 2020 & 2033
- Table 34: Italy Ladder Industry Revenue (Million) Forecast, by Application 2020 & 2033
- Table 35: Spain Ladder Industry Revenue (Million) Forecast, by Application 2020 & 2033
- Table 36: Russia Ladder Industry Revenue (Million) Forecast, by Application 2020 & 2033
- Table 37: Benelux Ladder Industry Revenue (Million) Forecast, by Application 2020 & 2033
- Table 38: Nordics Ladder Industry Revenue (Million) Forecast, by Application 2020 & 2033
- Table 39: Rest of Europe Ladder Industry Revenue (Million) Forecast, by Application 2020 & 2033
- Table 40: Global Ladder Industry Revenue Million Forecast, by Production Analysis 2020 & 2033
- Table 41: Global Ladder Industry Revenue Million Forecast, by Consumption Analysis 2020 & 2033
- Table 42: Global Ladder Industry Revenue Million Forecast, by Import Market Analysis (Value & Volume) 2020 & 2033
- Table 43: Global Ladder Industry Revenue Million Forecast, by Export Market Analysis (Value & Volume) 2020 & 2033
- Table 44: Global Ladder Industry Revenue Million Forecast, by Price Trend Analysis 2020 & 2033
- Table 45: Global Ladder Industry Revenue Million Forecast, by Country 2020 & 2033
- Table 46: Turkey Ladder Industry Revenue (Million) Forecast, by Application 2020 & 2033
- Table 47: Israel Ladder Industry Revenue (Million) Forecast, by Application 2020 & 2033
- Table 48: GCC Ladder Industry Revenue (Million) Forecast, by Application 2020 & 2033
- Table 49: North Africa Ladder Industry Revenue (Million) Forecast, by Application 2020 & 2033
- Table 50: South Africa Ladder Industry Revenue (Million) Forecast, by Application 2020 & 2033
- Table 51: Rest of Middle East & Africa Ladder Industry Revenue (Million) Forecast, by Application 2020 & 2033
- Table 52: Global Ladder Industry Revenue Million Forecast, by Production Analysis 2020 & 2033
- Table 53: Global Ladder Industry Revenue Million Forecast, by Consumption Analysis 2020 & 2033
- Table 54: Global Ladder Industry Revenue Million Forecast, by Import Market Analysis (Value & Volume) 2020 & 2033
- Table 55: Global Ladder Industry Revenue Million Forecast, by Export Market Analysis (Value & Volume) 2020 & 2033
- Table 56: Global Ladder Industry Revenue Million Forecast, by Price Trend Analysis 2020 & 2033
- Table 57: Global Ladder Industry Revenue Million Forecast, by Country 2020 & 2033
- Table 58: China Ladder Industry Revenue (Million) Forecast, by Application 2020 & 2033
- Table 59: India Ladder Industry Revenue (Million) Forecast, by Application 2020 & 2033
- Table 60: Japan Ladder Industry Revenue (Million) Forecast, by Application 2020 & 2033
- Table 61: South Korea Ladder Industry Revenue (Million) Forecast, by Application 2020 & 2033
- Table 62: ASEAN Ladder Industry Revenue (Million) Forecast, by Application 2020 & 2033
- Table 63: Oceania Ladder Industry Revenue (Million) Forecast, by Application 2020 & 2033
- Table 64: Rest of Asia Pacific Ladder Industry Revenue (Million) Forecast, by Application 2020 & 2033
Frequently Asked Questions
1. What is the projected Compound Annual Growth Rate (CAGR) of the Ladder Industry?
The projected CAGR is approximately > 4.50%.
2. Which companies are prominent players in the Ladder Industry?
Key companies in the market include Little Giant Ladder, Tri-arc Manufacturing, Alaco Ladders, Jumbor Industrial Co Ltd, Sagar Asia, TB Davies (Cardiff), Bauer Ladder Inc, Louisville Ladder, Tubesca-comabi, Werner Co ( Werner ladder), Gorilla Ladder.
3. What are the main segments of the Ladder Industry?
The market segments include Production Analysis, Consumption Analysis, Import Market Analysis (Value & Volume), Export Market Analysis (Value & Volume), Price Trend Analysis.
4. Can you provide details about the market size?
The market size is estimated to be USD XX Million as of 2022.
5. What are some drivers contributing to market growth?
Increasing Online Sales is Driving the Market; Growing Urbanization is Driving Need for Cookware.
6. What are the notable trends driving market growth?
Aluminum Metal Ladders are Dominantly Used in the Market While Fiber Glass Ladder are Expected to Grow Fastest..
7. Are there any restraints impacting market growth?
Changing Needs of Customers; Limited Usage of the Product.
8. Can you provide examples of recent developments in the market?
N/A
9. What pricing options are available for accessing the report?
Pricing options include single-user, multi-user, and enterprise licenses priced at USD 4750, USD 5250, and USD 8750 respectively.
10. Is the market size provided in terms of value or volume?
The market size is provided in terms of value, measured in Million.
11. Are there any specific market keywords associated with the report?
Yes, the market keyword associated with the report is "Ladder Industry," which aids in identifying and referencing the specific market segment covered.
12. How do I determine which pricing option suits my needs best?
The pricing options vary based on user requirements and access needs. Individual users may opt for single-user licenses, while businesses requiring broader access may choose multi-user or enterprise licenses for cost-effective access to the report.
13. Are there any additional resources or data provided in the Ladder Industry report?
While the report offers comprehensive insights, it's advisable to review the specific contents or supplementary materials provided to ascertain if additional resources or data are available.
14. How can I stay updated on further developments or reports in the Ladder Industry?
To stay informed about further developments, trends, and reports in the Ladder Industry, consider subscribing to industry newsletters, following relevant companies and organizations, or regularly checking reputable industry news sources and publications.
Methodology
Step 1 - Identification of Relevant Samples Size from Population Database


Step 2 - Approaches for Defining Global Market Size (Value, Volume* & Price*)

Note*: In applicable scenarios
Step 3 - Data Sources
Primary Research
- Web Analytics
- Survey Reports
- Research Institute
- Latest Research Reports
- Opinion Leaders
Secondary Research
- Annual Reports
- White Paper
- Latest Press Release
- Industry Association
- Paid Database
- Investor Presentations

Step 4 - Data Triangulation
Involves using different sources of information in order to increase the validity of a study
These sources are likely to be stakeholders in a program - participants, other researchers, program staff, other community members, and so on.
Then we put all data in single framework & apply various statistical tools to find out the dynamic on the market.
During the analysis stage, feedback from the stakeholder groups would be compared to determine areas of agreement as well as areas of divergence