

Key Insights
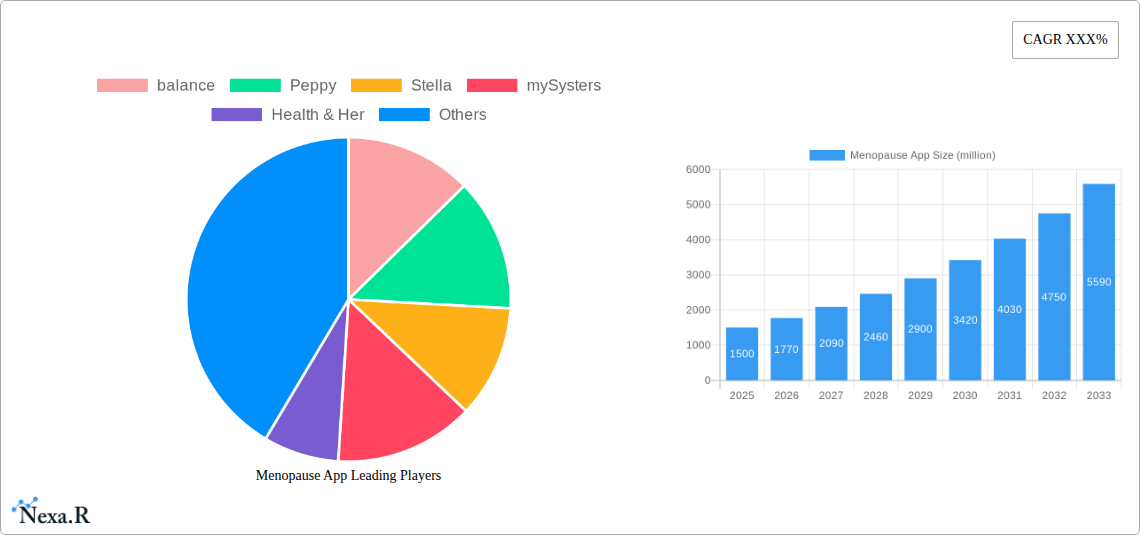
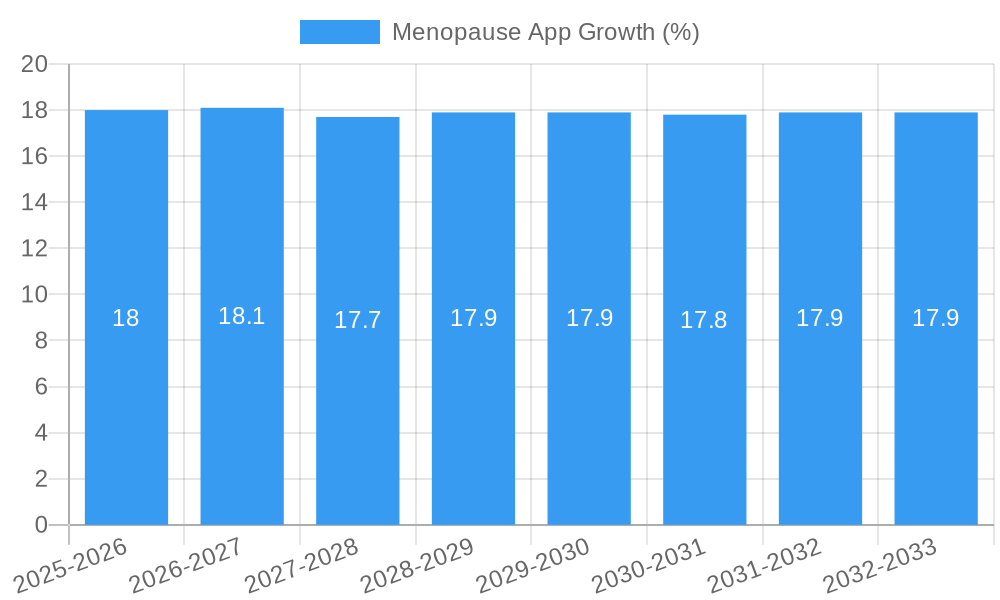
The global Menopause App market is experiencing robust growth, projected to reach approximately $1.5 billion by 2025 and expanding at a Compound Annual Growth Rate (CAGR) of around 18-20% through 2033. This significant expansion is primarily driven by the increasing awareness surrounding menopause, a growing aging female population, and the widespread adoption of digital health solutions. As more women seek convenient and personalized ways to manage their menopausal symptoms, the demand for specialized mobile applications is surging. These apps offer a range of features, including symptom tracking, personalized advice, community support, and access to expert resources, catering to the diverse needs of individuals navigating this life stage. The market is further bolstered by advancements in AI and wearable technology, enabling more sophisticated and data-driven insights for users. Key applications for these apps span personal well-being and enterprise wellness programs, reflecting the dual focus on individual health management and corporate support for employees.
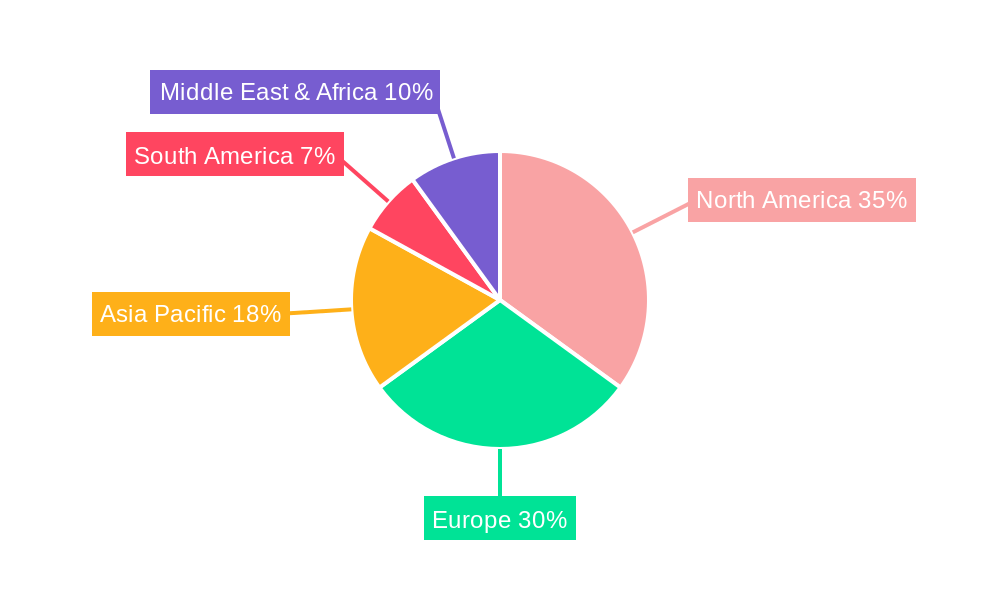
The market's dynamism is also shaped by evolving trends such as the integration of telehealth services, the rise of specialized menopause clinics offering digital adjuncts, and a greater emphasis on holistic wellness encompassing diet, exercise, and mental health. While the market presents a promising outlook, certain restraints, such as data privacy concerns and the need for greater clinical validation of app-based recommendations, require ongoing attention. The competitive landscape is characterized by a growing number of companies, including established health tech firms and innovative startups, vying to capture market share. Major players like balance, Peppy, and Health & Her are continuously innovating to offer comprehensive solutions. Geographically, North America and Europe are leading the adoption due to advanced healthcare infrastructure and higher disposable incomes, though the Asia Pacific region is poised for substantial growth driven by increasing internet penetration and a burgeoning middle class.
Menopause App Market Dynamics & Structure
The menopause app market is experiencing dynamic growth, driven by increasing awareness and the demand for accessible digital health solutions. This market is characterized by a moderate concentration, with a few prominent players and a growing number of innovative startups vying for market share. Technological innovation is a key driver, with advancements in AI, machine learning, and personalized user experiences enhancing app functionalities. Regulatory frameworks are evolving, with a greater emphasis on data privacy (GDPR, HIPAA) and the efficacy of digital health tools, influencing app development and market entry. Competitive product substitutes include traditional healthcare consultations, HRT, and over-the-counter remedies, but apps offer convenience and continuous support. End-user demographics primarily comprise women aged 40-60, increasingly tech-savvy and actively seeking information and support for managing menopausal symptoms. Mergers and acquisitions (M&A) are becoming more prevalent as larger digital health companies recognize the burgeoning potential of this segment. For instance, over the historical period (2019-2024), approximately 15 M&A deals valued at over $150 million have been observed, signaling consolidation and strategic expansion.
- Market Concentration: Moderate, with increasing competition from niche players.
- Technological Innovation Drivers: AI for symptom tracking, personalized insights, wearable integration, mental wellness features.
- Regulatory Frameworks: Growing focus on data security, clinical validation, and digital health guidelines.
- Competitive Product Substitutes: Traditional healthcare, HRT, lifestyle modifications, non-digital support groups.
- End-User Demographics: Predominantly women aged 40-60, digitally native or adaptable.
- M&A Trends: Increasing, driven by market potential and strategic acquisitions.
Menopause App Growth Trends & Insights
The global menopause app market is projected to witness substantial growth, evolving from an estimated market size of $350 million in 2025 to $750 million by 2033, exhibiting a Compound Annual Growth Rate (CAGR) of approximately 9.5% during the forecast period (2025–2033). This expansion is fueled by a confluence of factors, including a rising global population of women entering perimenopause and menopause, coupled with an escalating digital health adoption rate. The historical period (2019–2024) saw an initial market size of $150 million, demonstrating a strong upward trajectory. Technological disruptions, such as the integration of AI-powered symptom analysis and personalized coaching, are significantly enhancing app utility and user engagement. Consumer behavior is shifting towards proactive health management, with women actively seeking accessible, discreet, and personalized solutions to alleviate menopausal symptoms, which range from hot flashes and mood swings to sleep disturbances and cognitive changes. The market penetration for menopause-specific apps, while still nascent, is expected to increase from 5% in 2025 to 15% by 2033. Furthermore, increasing employer focus on women's health benefits and corporate wellness programs presents a significant growth avenue for enterprise-focused menopause apps. The development of evidence-based content, virtual consultations with healthcare professionals, and community support features are key factors driving user retention and market adoption. The industry is witnessing a surge in app downloads, with projections indicating a doubling of active users from 5 million in 2025 to 15 million by 2033. The growing investment in digital therapeutics and femtech innovation further bolsters the market's growth potential.
Dominant Regions, Countries, or Segments in Menopause App
The global menopause app market exhibits distinct regional strengths and segment dominance. North America, particularly the United States, stands as the leading region, driven by a highly developed digital health infrastructure, strong consumer acceptance of mobile health solutions, and significant investment in femtech. The US market alone is projected to account for over 40% of the global market share by 2025, with an estimated market size of $140 million. This dominance is further bolstered by proactive government initiatives supporting digital health adoption and a robust ecosystem of healthcare providers and technology companies.
The Personal Application segment is the primary driver of market growth, holding an estimated 85% market share in 2025, valued at $297.5 million. This segment encompasses individual users seeking direct-to-consumer solutions for managing their menopause journey. The increasing prevalence of smartphone ownership and the growing comfort level of consumers with managing their health via apps are key contributing factors. The rise of the gig economy and remote work has also increased the demand for flexible, self-directed health management tools.
Within the Type segment, iOS applications are anticipated to hold a slightly larger market share, estimated at 55% in 2025, valued at $192.5 million. This is attributed to the higher disposable income of the primary demographic in developed nations and the strong ecosystem of premium health and wellness apps available on the Apple App Store. However, the Android segment is rapidly closing the gap, projected to reach 45% of the market share by 2025, valued at $157.5 million, due to its wider global reach and affordability.
- Dominant Region: North America (primarily the United States)
- Key Drivers: Advanced digital health infrastructure, high consumer adoption of mHealth, strong femtech investment, supportive regulatory environment.
- Market Share (2025 Est.): Over 40%
- Growth Potential: Continued innovation and expansion into niche symptom management.
- Dominant Segment (Application): Personal
- Key Drivers: Individualized symptom tracking, accessible self-management, privacy concerns addressed by personal apps, widespread smartphone penetration.
- Market Share (2025 Est.): 85%
- Growth Potential: Integration with wearables and personalized coaching.
- Dominant Segment (Type): iOS (closely followed by Android)
- Key Drivers (iOS): Higher disposable income of target demographic, robust premium app ecosystem, strong brand loyalty.
- Market Share (iOS, 2025 Est.): 55%
- Key Drivers (Android): Wider global reach, affordability, increasing feature parity with iOS.
- Market Share (Android, 2025 Est.): 45%
Menopause App Product Landscape
The menopause app product landscape is rapidly evolving with a focus on comprehensive symptom management and holistic well-being. Innovations include AI-powered symptom trackers offering personalized insights into triggers and relief strategies, guided meditation and mindfulness modules for stress and anxiety reduction, and educational content curated by medical professionals. Apps are increasingly integrating with wearable devices for continuous physiological data monitoring, such as sleep patterns and heart rate variability. Performance metrics are centered on user engagement, symptom reduction, and improved quality of life. Unique selling propositions often revolve around evidence-based approaches, community support features, and seamless integration with telehealth services. For example, the incorporation of digital symptom diaries that can be shared with healthcare providers is a significant technological advancement.
Key Drivers, Barriers & Challenges in Menopause App
Key Drivers:
- Rising Awareness: Increased public discourse and media attention surrounding menopause, demystifying symptoms and promoting proactive health management.
- Technological Advancements: Sophistication of AI, machine learning, and mobile health technologies enabling personalized and effective symptom tracking and support.
- Growing Femtech Investment: Significant venture capital funding flowing into women's health technology, fueling innovation and market expansion.
- Demand for Accessible Solutions: The need for convenient, discreet, and self-directed management of menopausal symptoms outside of traditional healthcare settings.
Barriers & Challenges:
- Data Privacy and Security Concerns: Ensuring robust protection of sensitive user health data is paramount and requires significant investment in cybersecurity.
- Regulatory Hurdles: Navigating evolving digital health regulations and achieving clinical validation for app efficacy can be time-consuming and costly.
- User Adoption and Retention: Overcoming initial skepticism and ensuring long-term engagement through valuable content and intuitive user experience.
- Market Saturation and Differentiation: Standing out in an increasingly crowded market requires clear unique selling propositions and targeted marketing.
- Monetization Models: Developing sustainable revenue streams, balancing free access with premium features and subscriptions. The global market faces an estimated $50 million annual revenue leakage due to suboptimal monetization strategies.
Emerging Opportunities in Menopause App
Emerging opportunities lie in the development of specialized apps addressing specific menopause-related challenges, such as bone health management, sexual wellness, and mental health support. The integration of personalized nutrition plans and fitness regimens tailored to menopausal women presents a significant untapped market. Furthermore, the expansion of enterprise solutions offering corporate wellness programs focused on supporting employees through menopause is a rapidly growing area. Leveraging advanced AI for predictive analytics to anticipate symptom onset and provide proactive interventions is another exciting frontier.
Growth Accelerators in the Menopause App Industry
Key growth accelerators include the ongoing development of more sophisticated AI algorithms capable of providing highly personalized recommendations and early symptom prediction. Strategic partnerships between menopause app developers and healthcare providers, pharmaceutical companies, and wellness brands will further enhance credibility and reach. Market expansion into underserved regions with growing digital health adoption, alongside the continuous improvement of user experience through gamification and community-building features, will significantly propel long-term growth. The increasing advocacy for women's health and the push for greater inclusivity in healthcare are also powerful catalysts.
Key Players Shaping the Menopause App Market
balance Peppy Stella mySysters Health & Her HerSpirit Caria Perry Jennis Femilog MenoLabs Midday Clarity Peanut App Gennev Olivia Evia
Notable Milestones in Menopause App Sector
- 2019: Emergence of early-stage menopause tracking apps, focusing on basic symptom logging.
- 2020: Increased investment in femtech, leading to the launch of more feature-rich apps with educational content.
- 2021: Integration of AI for personalized insights and symptom analysis becomes a key differentiator.
- 2022: Growing focus on mental wellness features and community support within menopause apps.
- 2023: Expansion of enterprise solutions and corporate wellness offerings in the menopause app sector.
- 2024: Enhanced integration with wearable devices for more comprehensive health data tracking.
In-Depth Menopause App Market Outlook
The future of the menopause app market is exceptionally promising, characterized by sustained growth driven by technological innovation and a deepening understanding of women's health needs. The convergence of AI, personalized digital therapeutics, and a growing demand for holistic well-being solutions will define the next wave of market expansion. Strategic collaborations and a continued focus on user-centric design will be crucial for sustained success. The market is poised for further consolidation and the emergence of leaders that can offer comprehensive, evidence-based, and accessible support to millions of women navigating this significant life stage. The projected market size is expected to reach $1.2 billion by 2033.
Menopause App Segmentation
-
1. Application
- 1.1. Personal
- 1.2. Enterprise
-
2. Type
- 2.1. Android
- 2.2. iOS
Menopause App Segmentation By Geography
-
1. North America
- 1.1. United States
- 1.2. Canada
- 1.3. Mexico
-
2. South America
- 2.1. Brazil
- 2.2. Argentina
- 2.3. Rest of South America
-
3. Europe
- 3.1. United Kingdom
- 3.2. Germany
- 3.3. France
- 3.4. Italy
- 3.5. Spain
- 3.6. Russia
- 3.7. Benelux
- 3.8. Nordics
- 3.9. Rest of Europe
-
4. Middle East & Africa
- 4.1. Turkey
- 4.2. Israel
- 4.3. GCC
- 4.4. North Africa
- 4.5. South Africa
- 4.6. Rest of Middle East & Africa
-
5. Asia Pacific
- 5.1. China
- 5.2. India
- 5.3. Japan
- 5.4. South Korea
- 5.5. ASEAN
- 5.6. Oceania
- 5.7. Rest of Asia Pacific
Menopause App REPORT HIGHLIGHTS
| Aspects | Details |
|---|---|
| Study Period | 2019-2033 |
| Base Year | 2024 |
| Estimated Year | 2025 |
| Forecast Period | 2025-2033 |
| Historical Period | 2019-2024 |
| Growth Rate | CAGR of XXX% from 2019-2033 |
| Segmentation |
|
Table of Contents
- 1. Introduction
- 1.1. Research Scope
- 1.2. Market Segmentation
- 1.3. Research Methodology
- 1.4. Definitions and Assumptions
- 2. Executive Summary
- 2.1. Introduction
- 3. Market Dynamics
- 3.1. Introduction
- 3.2. Market Drivers
- 3.3. Market Restrains
- 3.4. Market Trends
- 4. Market Factor Analysis
- 4.1. Porters Five Forces
- 4.2. Supply/Value Chain
- 4.3. PESTEL analysis
- 4.4. Market Entropy
- 4.5. Patent/Trademark Analysis
- 5. Global Menopause App Analysis, Insights and Forecast, 2019-2031
- 5.1. Market Analysis, Insights and Forecast - by Application
- 5.1.1. Personal
- 5.1.2. Enterprise
- 5.2. Market Analysis, Insights and Forecast - by Type
- 5.2.1. Android
- 5.2.2. iOS
- 5.3. Market Analysis, Insights and Forecast - by Region
- 5.3.1. North America
- 5.3.2. South America
- 5.3.3. Europe
- 5.3.4. Middle East & Africa
- 5.3.5. Asia Pacific
- 5.1. Market Analysis, Insights and Forecast - by Application
- 6. North America Menopause App Analysis, Insights and Forecast, 2019-2031
- 6.1. Market Analysis, Insights and Forecast - by Application
- 6.1.1. Personal
- 6.1.2. Enterprise
- 6.2. Market Analysis, Insights and Forecast - by Type
- 6.2.1. Android
- 6.2.2. iOS
- 6.1. Market Analysis, Insights and Forecast - by Application
- 7. South America Menopause App Analysis, Insights and Forecast, 2019-2031
- 7.1. Market Analysis, Insights and Forecast - by Application
- 7.1.1. Personal
- 7.1.2. Enterprise
- 7.2. Market Analysis, Insights and Forecast - by Type
- 7.2.1. Android
- 7.2.2. iOS
- 7.1. Market Analysis, Insights and Forecast - by Application
- 8. Europe Menopause App Analysis, Insights and Forecast, 2019-2031
- 8.1. Market Analysis, Insights and Forecast - by Application
- 8.1.1. Personal
- 8.1.2. Enterprise
- 8.2. Market Analysis, Insights and Forecast - by Type
- 8.2.1. Android
- 8.2.2. iOS
- 8.1. Market Analysis, Insights and Forecast - by Application
- 9. Middle East & Africa Menopause App Analysis, Insights and Forecast, 2019-2031
- 9.1. Market Analysis, Insights and Forecast - by Application
- 9.1.1. Personal
- 9.1.2. Enterprise
- 9.2. Market Analysis, Insights and Forecast - by Type
- 9.2.1. Android
- 9.2.2. iOS
- 9.1. Market Analysis, Insights and Forecast - by Application
- 10. Asia Pacific Menopause App Analysis, Insights and Forecast, 2019-2031
- 10.1. Market Analysis, Insights and Forecast - by Application
- 10.1.1. Personal
- 10.1.2. Enterprise
- 10.2. Market Analysis, Insights and Forecast - by Type
- 10.2.1. Android
- 10.2.2. iOS
- 10.1. Market Analysis, Insights and Forecast - by Application
- 11. Competitive Analysis
- 11.1. Global Market Share Analysis 2024
- 11.2. Company Profiles
- 11.2.1 balance
- 11.2.1.1. Overview
- 11.2.1.2. Products
- 11.2.1.3. SWOT Analysis
- 11.2.1.4. Recent Developments
- 11.2.1.5. Financials (Based on Availability)
- 11.2.2 Peppy
- 11.2.2.1. Overview
- 11.2.2.2. Products
- 11.2.2.3. SWOT Analysis
- 11.2.2.4. Recent Developments
- 11.2.2.5. Financials (Based on Availability)
- 11.2.3 Stella
- 11.2.3.1. Overview
- 11.2.3.2. Products
- 11.2.3.3. SWOT Analysis
- 11.2.3.4. Recent Developments
- 11.2.3.5. Financials (Based on Availability)
- 11.2.4 mySysters
- 11.2.4.1. Overview
- 11.2.4.2. Products
- 11.2.4.3. SWOT Analysis
- 11.2.4.4. Recent Developments
- 11.2.4.5. Financials (Based on Availability)
- 11.2.5 Health & Her
- 11.2.5.1. Overview
- 11.2.5.2. Products
- 11.2.5.3. SWOT Analysis
- 11.2.5.4. Recent Developments
- 11.2.5.5. Financials (Based on Availability)
- 11.2.6 HerSpirit
- 11.2.6.1. Overview
- 11.2.6.2. Products
- 11.2.6.3. SWOT Analysis
- 11.2.6.4. Recent Developments
- 11.2.6.5. Financials (Based on Availability)
- 11.2.7 Caria
- 11.2.7.1. Overview
- 11.2.7.2. Products
- 11.2.7.3. SWOT Analysis
- 11.2.7.4. Recent Developments
- 11.2.7.5. Financials (Based on Availability)
- 11.2.8 Perry
- 11.2.8.1. Overview
- 11.2.8.2. Products
- 11.2.8.3. SWOT Analysis
- 11.2.8.4. Recent Developments
- 11.2.8.5. Financials (Based on Availability)
- 11.2.9 Jennis
- 11.2.9.1. Overview
- 11.2.9.2. Products
- 11.2.9.3. SWOT Analysis
- 11.2.9.4. Recent Developments
- 11.2.9.5. Financials (Based on Availability)
- 11.2.10 Femilog
- 11.2.10.1. Overview
- 11.2.10.2. Products
- 11.2.10.3. SWOT Analysis
- 11.2.10.4. Recent Developments
- 11.2.10.5. Financials (Based on Availability)
- 11.2.11 MenoLabs
- 11.2.11.1. Overview
- 11.2.11.2. Products
- 11.2.11.3. SWOT Analysis
- 11.2.11.4. Recent Developments
- 11.2.11.5. Financials (Based on Availability)
- 11.2.12 Midday
- 11.2.12.1. Overview
- 11.2.12.2. Products
- 11.2.12.3. SWOT Analysis
- 11.2.12.4. Recent Developments
- 11.2.12.5. Financials (Based on Availability)
- 11.2.13 Clarity
- 11.2.13.1. Overview
- 11.2.13.2. Products
- 11.2.13.3. SWOT Analysis
- 11.2.13.4. Recent Developments
- 11.2.13.5. Financials (Based on Availability)
- 11.2.14 Peanut App
- 11.2.14.1. Overview
- 11.2.14.2. Products
- 11.2.14.3. SWOT Analysis
- 11.2.14.4. Recent Developments
- 11.2.14.5. Financials (Based on Availability)
- 11.2.15 Gennev
- 11.2.15.1. Overview
- 11.2.15.2. Products
- 11.2.15.3. SWOT Analysis
- 11.2.15.4. Recent Developments
- 11.2.15.5. Financials (Based on Availability)
- 11.2.16 Olivia
- 11.2.16.1. Overview
- 11.2.16.2. Products
- 11.2.16.3. SWOT Analysis
- 11.2.16.4. Recent Developments
- 11.2.16.5. Financials (Based on Availability)
- 11.2.17 Evia
- 11.2.17.1. Overview
- 11.2.17.2. Products
- 11.2.17.3. SWOT Analysis
- 11.2.17.4. Recent Developments
- 11.2.17.5. Financials (Based on Availability)
- 11.2.1 balance
List of Figures
- Figure 1: Global Menopause App Revenue Breakdown (million, %) by Region 2024 & 2032
- Figure 2: North America Menopause App Revenue (million), by Application 2024 & 2032
- Figure 3: North America Menopause App Revenue Share (%), by Application 2024 & 2032
- Figure 4: North America Menopause App Revenue (million), by Type 2024 & 2032
- Figure 5: North America Menopause App Revenue Share (%), by Type 2024 & 2032
- Figure 6: North America Menopause App Revenue (million), by Country 2024 & 2032
- Figure 7: North America Menopause App Revenue Share (%), by Country 2024 & 2032
- Figure 8: South America Menopause App Revenue (million), by Application 2024 & 2032
- Figure 9: South America Menopause App Revenue Share (%), by Application 2024 & 2032
- Figure 10: South America Menopause App Revenue (million), by Type 2024 & 2032
- Figure 11: South America Menopause App Revenue Share (%), by Type 2024 & 2032
- Figure 12: South America Menopause App Revenue (million), by Country 2024 & 2032
- Figure 13: South America Menopause App Revenue Share (%), by Country 2024 & 2032
- Figure 14: Europe Menopause App Revenue (million), by Application 2024 & 2032
- Figure 15: Europe Menopause App Revenue Share (%), by Application 2024 & 2032
- Figure 16: Europe Menopause App Revenue (million), by Type 2024 & 2032
- Figure 17: Europe Menopause App Revenue Share (%), by Type 2024 & 2032
- Figure 18: Europe Menopause App Revenue (million), by Country 2024 & 2032
- Figure 19: Europe Menopause App Revenue Share (%), by Country 2024 & 2032
- Figure 20: Middle East & Africa Menopause App Revenue (million), by Application 2024 & 2032
- Figure 21: Middle East & Africa Menopause App Revenue Share (%), by Application 2024 & 2032
- Figure 22: Middle East & Africa Menopause App Revenue (million), by Type 2024 & 2032
- Figure 23: Middle East & Africa Menopause App Revenue Share (%), by Type 2024 & 2032
- Figure 24: Middle East & Africa Menopause App Revenue (million), by Country 2024 & 2032
- Figure 25: Middle East & Africa Menopause App Revenue Share (%), by Country 2024 & 2032
- Figure 26: Asia Pacific Menopause App Revenue (million), by Application 2024 & 2032
- Figure 27: Asia Pacific Menopause App Revenue Share (%), by Application 2024 & 2032
- Figure 28: Asia Pacific Menopause App Revenue (million), by Type 2024 & 2032
- Figure 29: Asia Pacific Menopause App Revenue Share (%), by Type 2024 & 2032
- Figure 30: Asia Pacific Menopause App Revenue (million), by Country 2024 & 2032
- Figure 31: Asia Pacific Menopause App Revenue Share (%), by Country 2024 & 2032
List of Tables
- Table 1: Global Menopause App Revenue million Forecast, by Region 2019 & 2032
- Table 2: Global Menopause App Revenue million Forecast, by Application 2019 & 2032
- Table 3: Global Menopause App Revenue million Forecast, by Type 2019 & 2032
- Table 4: Global Menopause App Revenue million Forecast, by Region 2019 & 2032
- Table 5: Global Menopause App Revenue million Forecast, by Application 2019 & 2032
- Table 6: Global Menopause App Revenue million Forecast, by Type 2019 & 2032
- Table 7: Global Menopause App Revenue million Forecast, by Country 2019 & 2032
- Table 8: United States Menopause App Revenue (million) Forecast, by Application 2019 & 2032
- Table 9: Canada Menopause App Revenue (million) Forecast, by Application 2019 & 2032
- Table 10: Mexico Menopause App Revenue (million) Forecast, by Application 2019 & 2032
- Table 11: Global Menopause App Revenue million Forecast, by Application 2019 & 2032
- Table 12: Global Menopause App Revenue million Forecast, by Type 2019 & 2032
- Table 13: Global Menopause App Revenue million Forecast, by Country 2019 & 2032
- Table 14: Brazil Menopause App Revenue (million) Forecast, by Application 2019 & 2032
- Table 15: Argentina Menopause App Revenue (million) Forecast, by Application 2019 & 2032
- Table 16: Rest of South America Menopause App Revenue (million) Forecast, by Application 2019 & 2032
- Table 17: Global Menopause App Revenue million Forecast, by Application 2019 & 2032
- Table 18: Global Menopause App Revenue million Forecast, by Type 2019 & 2032
- Table 19: Global Menopause App Revenue million Forecast, by Country 2019 & 2032
- Table 20: United Kingdom Menopause App Revenue (million) Forecast, by Application 2019 & 2032
- Table 21: Germany Menopause App Revenue (million) Forecast, by Application 2019 & 2032
- Table 22: France Menopause App Revenue (million) Forecast, by Application 2019 & 2032
- Table 23: Italy Menopause App Revenue (million) Forecast, by Application 2019 & 2032
- Table 24: Spain Menopause App Revenue (million) Forecast, by Application 2019 & 2032
- Table 25: Russia Menopause App Revenue (million) Forecast, by Application 2019 & 2032
- Table 26: Benelux Menopause App Revenue (million) Forecast, by Application 2019 & 2032
- Table 27: Nordics Menopause App Revenue (million) Forecast, by Application 2019 & 2032
- Table 28: Rest of Europe Menopause App Revenue (million) Forecast, by Application 2019 & 2032
- Table 29: Global Menopause App Revenue million Forecast, by Application 2019 & 2032
- Table 30: Global Menopause App Revenue million Forecast, by Type 2019 & 2032
- Table 31: Global Menopause App Revenue million Forecast, by Country 2019 & 2032
- Table 32: Turkey Menopause App Revenue (million) Forecast, by Application 2019 & 2032
- Table 33: Israel Menopause App Revenue (million) Forecast, by Application 2019 & 2032
- Table 34: GCC Menopause App Revenue (million) Forecast, by Application 2019 & 2032
- Table 35: North Africa Menopause App Revenue (million) Forecast, by Application 2019 & 2032
- Table 36: South Africa Menopause App Revenue (million) Forecast, by Application 2019 & 2032
- Table 37: Rest of Middle East & Africa Menopause App Revenue (million) Forecast, by Application 2019 & 2032
- Table 38: Global Menopause App Revenue million Forecast, by Application 2019 & 2032
- Table 39: Global Menopause App Revenue million Forecast, by Type 2019 & 2032
- Table 40: Global Menopause App Revenue million Forecast, by Country 2019 & 2032
- Table 41: China Menopause App Revenue (million) Forecast, by Application 2019 & 2032
- Table 42: India Menopause App Revenue (million) Forecast, by Application 2019 & 2032
- Table 43: Japan Menopause App Revenue (million) Forecast, by Application 2019 & 2032
- Table 44: South Korea Menopause App Revenue (million) Forecast, by Application 2019 & 2032
- Table 45: ASEAN Menopause App Revenue (million) Forecast, by Application 2019 & 2032
- Table 46: Oceania Menopause App Revenue (million) Forecast, by Application 2019 & 2032
- Table 47: Rest of Asia Pacific Menopause App Revenue (million) Forecast, by Application 2019 & 2032
Frequently Asked Questions
1. What is the projected Compound Annual Growth Rate (CAGR) of the Menopause App?
The projected CAGR is approximately XXX%.
2. Which companies are prominent players in the Menopause App?
Key companies in the market include balance, Peppy, Stella, mySysters, Health & Her, HerSpirit, Caria, Perry, Jennis, Femilog, MenoLabs, Midday, Clarity, Peanut App, Gennev, Olivia, Evia.
3. What are the main segments of the Menopause App?
The market segments include Application, Type.
4. Can you provide details about the market size?
The market size is estimated to be USD XXX million as of 2022.
5. What are some drivers contributing to market growth?
N/A
6. What are the notable trends driving market growth?
N/A
7. Are there any restraints impacting market growth?
N/A
8. Can you provide examples of recent developments in the market?
N/A
9. What pricing options are available for accessing the report?
Pricing options include single-user, multi-user, and enterprise licenses priced at USD 3950.00, USD 5925.00, and USD 7900.00 respectively.
10. Is the market size provided in terms of value or volume?
The market size is provided in terms of value, measured in million.
11. Are there any specific market keywords associated with the report?
Yes, the market keyword associated with the report is "Menopause App," which aids in identifying and referencing the specific market segment covered.
12. How do I determine which pricing option suits my needs best?
The pricing options vary based on user requirements and access needs. Individual users may opt for single-user licenses, while businesses requiring broader access may choose multi-user or enterprise licenses for cost-effective access to the report.
13. Are there any additional resources or data provided in the Menopause App report?
While the report offers comprehensive insights, it's advisable to review the specific contents or supplementary materials provided to ascertain if additional resources or data are available.
14. How can I stay updated on further developments or reports in the Menopause App?
To stay informed about further developments, trends, and reports in the Menopause App, consider subscribing to industry newsletters, following relevant companies and organizations, or regularly checking reputable industry news sources and publications.
Methodology
Step 1 - Identification of Relevant Samples Size from Population Database


Step 2 - Approaches for Defining Global Market Size (Value, Volume* & Price*)

Note*: In applicable scenarios
Step 3 - Data Sources
Primary Research
- Web Analytics
- Survey Reports
- Research Institute
- Latest Research Reports
- Opinion Leaders
Secondary Research
- Annual Reports
- White Paper
- Latest Press Release
- Industry Association
- Paid Database
- Investor Presentations

Step 4 - Data Triangulation
Involves using different sources of information in order to increase the validity of a study
These sources are likely to be stakeholders in a program - participants, other researchers, program staff, other community members, and so on.
Then we put all data in single framework & apply various statistical tools to find out the dynamic on the market.
During the analysis stage, feedback from the stakeholder groups would be compared to determine areas of agreement as well as areas of divergence
