

Key Insights
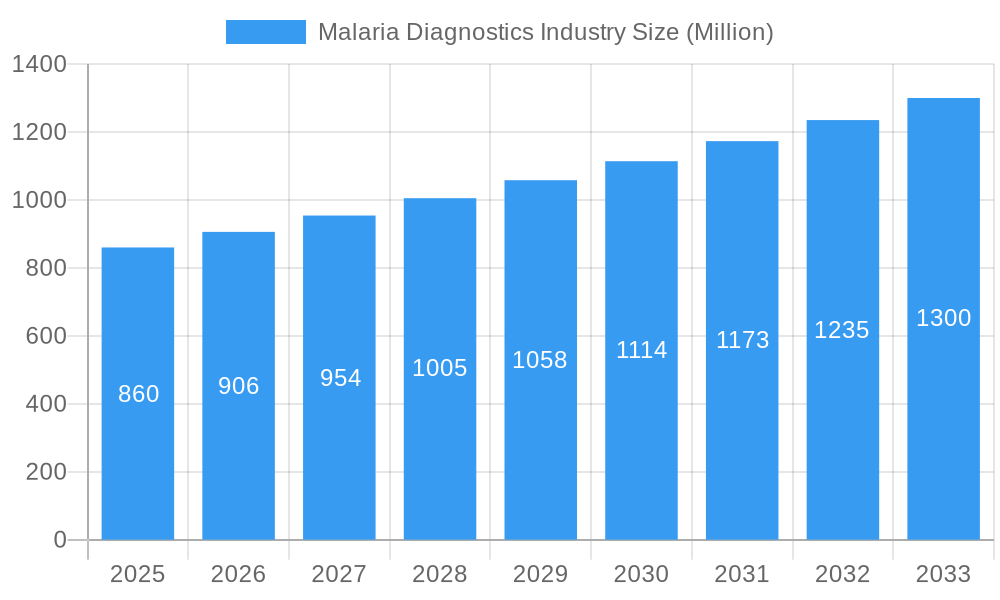
The global malaria diagnostics market, valued at $0.86 billion in 2025, is projected to experience robust growth, driven by increasing malaria prevalence in endemic regions, particularly in sub-Saharan Africa and Southeast Asia. A Compound Annual Growth Rate (CAGR) of 5.23% from 2025 to 2033 indicates a significant market expansion. This growth is fueled by several factors. Firstly, advancements in diagnostic technologies, such as rapid diagnostic tests (RDTs) and molecular diagnostics (like PCR), are offering faster, more accurate, and user-friendly solutions compared to traditional microscopic methods. Secondly, increased global health initiatives and funding focused on malaria eradication are driving the adoption of these improved diagnostics. Thirdly, the growing awareness among healthcare professionals and the public about the importance of early diagnosis and treatment is further bolstering market expansion. However, challenges remain, including infrastructure limitations in many endemic areas, particularly regarding access to reliable electricity for advanced molecular diagnostics, and cost considerations related to new technologies. The market segmentation shows significant demand for RDTs due to their ease of use and portability, while the molecular diagnostics segment is expected to witness the fastest growth due to its enhanced sensitivity and specificity. The competitive landscape involves major players like Abbott Laboratories, Bio-Rad Laboratories, and Thermo Fisher Scientific, alongside numerous regional players.
Malaria Diagnostics Industry Market Size (In Million)
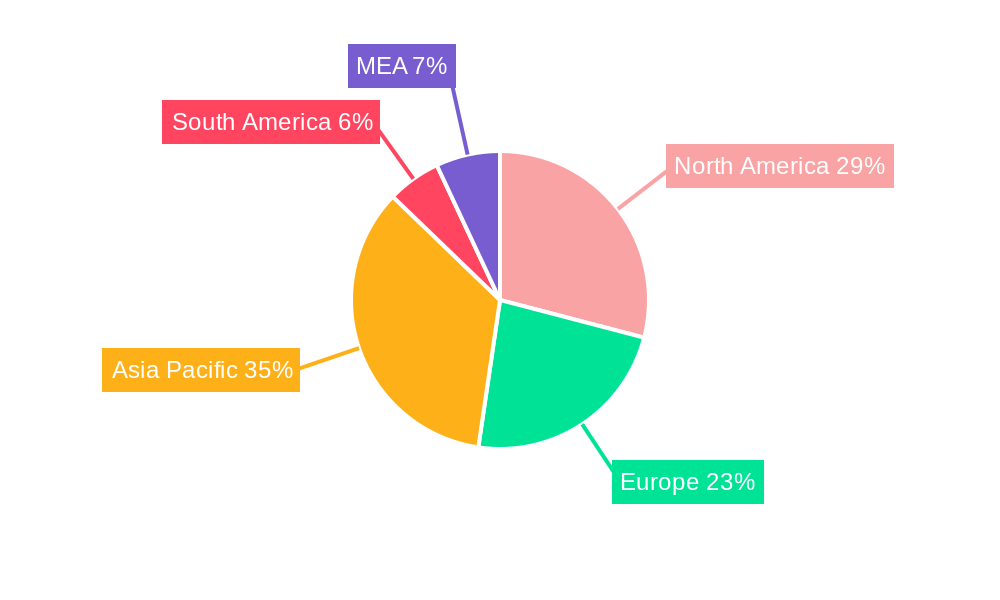
The regional distribution of the malaria diagnostics market reflects the global burden of the disease. North America and Europe, while having lower malaria incidence, contribute significantly due to their advanced healthcare infrastructure and research activities. However, the Asia-Pacific region, particularly countries like India and China, and sub-Saharan Africa are expected to dominate market growth, driven by high disease prevalence and increasing healthcare investments in these regions. The ongoing efforts toward malaria elimination programs and the development of innovative diagnostic tools will likely shape future market dynamics. The market is poised for continued expansion, albeit at a pace moderated by ongoing challenges related to access, affordability, and the emergence of drug-resistant strains of malaria. Understanding these diverse factors is crucial for successful market participation and strategic planning.
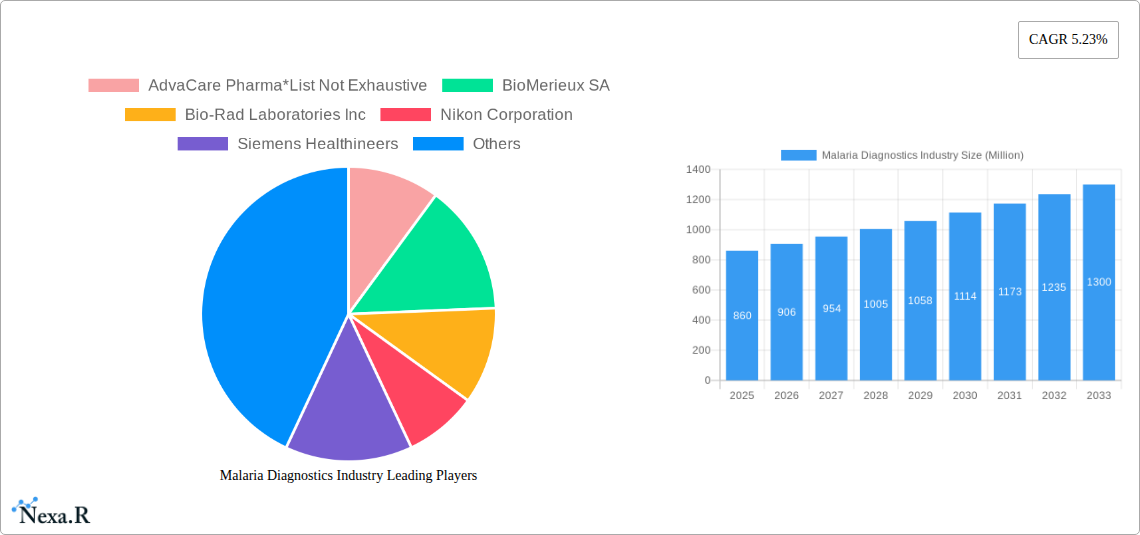
Malaria Diagnostics Industry Company Market Share
Malaria Diagnostics Industry Market Report: 2019-2033
This comprehensive report provides a detailed analysis of the Malaria Diagnostics Industry, encompassing market dynamics, growth trends, regional segmentation, product landscape, key players, and future outlook. With a study period spanning 2019-2033, a base year of 2025, and a forecast period of 2025-2033, this report is an invaluable resource for industry professionals, investors, and researchers seeking to understand and capitalize on the opportunities within this crucial sector. The report covers parent markets of Diagnostics and the child market of Malaria Diagnostics, allowing for a deeper understanding of the industry's position and potential. Market values are presented in millions of USD.
Malaria Diagnostics Industry Market Dynamics & Structure
The Malaria Diagnostics market is characterized by a moderately concentrated landscape with several key players holding significant market share. Technological innovation, particularly in rapid diagnostic tests (RDTs) and molecular diagnostics, is a key driver of growth. Regulatory frameworks, varying across regions, influence market access and product adoption. The market faces competition from alternative diagnostic methods and the emergence of new technologies. End-user demographics, primarily focused on healthcare settings and regions with high malaria prevalence, shape demand. M&A activity, while not excessively frequent, plays a role in market consolidation and expansion.
- Market Concentration: Moderate, with top 5 players holding approximately xx% of market share in 2025.
- Technological Innovation: Focus on improving RDT sensitivity, speed, and cost-effectiveness; advancements in molecular diagnostics.
- Regulatory Landscape: Varying approval processes and reimbursement policies across different geographies.
- Competitive Substitutes: Alternative diagnostic methods and evolving technologies present competitive challenges.
- End-User Demographics: High concentration in Sub-Saharan Africa, South Asia, and other malaria-endemic regions.
- M&A Activity: xx deals recorded between 2019 and 2024, primarily focused on technology acquisition and market expansion.
Malaria Diagnostics Industry Growth Trends & Insights
The Malaria Diagnostics market experienced robust growth during the historical period (2019-2024), driven by increasing malaria prevalence in certain regions, rising healthcare expenditure, and advancements in diagnostic technologies. The market is expected to continue expanding at a Compound Annual Growth Rate (CAGR) of xx% during the forecast period (2025-2033), reaching xx million USD by 2033. This growth is fueled by factors such as increased government initiatives to combat malaria, rising awareness of the disease, and the development of more accurate and affordable diagnostic tools. Adoption rates for newer technologies, such as molecular diagnostics, are gradually increasing. Consumer behavior is shifting towards convenient and rapid diagnostic options.
Dominant Regions, Countries, or Segments in Malaria Diagnostics Industry
Sub-Saharan Africa holds the largest market share within the Malaria Diagnostics industry, driven by high malaria prevalence and increasing investments in healthcare infrastructure. India and other South Asian countries also represent substantial market segments. Within the technology segments, Rapid Diagnostic Tests (RDTs) currently dominate due to their ease of use, affordability, and suitability for point-of-care testing. However, molecular diagnostics are expected to witness significant growth in the coming years, driven by their superior accuracy and ability to detect drug resistance.
- Key Drivers in Sub-Saharan Africa: High malaria burden, government initiatives for disease eradication, and increasing healthcare spending.
- Key Drivers in India and South Asia: High population density, increasing awareness, and growing healthcare infrastructure.
- Technology Segment Dominance: RDTs currently lead, with molecular diagnostics showing strong growth potential.
Malaria Diagnostics Industry Product Landscape
The Malaria Diagnostics market offers a range of products including RDTs, microscopic diagnostics, molecular diagnostic assays, and clinical diagnostic tests. Recent innovations have focused on improving the sensitivity and specificity of RDTs, developing more affordable and portable molecular diagnostics, and integrating digital technologies for improved data management and disease surveillance. Unique selling propositions include improved diagnostic accuracy, reduced turnaround time, and ease of use. Technological advancements are enabling point-of-care diagnostics and remote disease monitoring.
Key Drivers, Barriers & Challenges in Malaria Diagnostics Industry
Key Drivers: The global fight against malaria is intensifying, propelled by a persistent and widespread prevalence in endemic regions. This, coupled with increasing healthcare spending and robust government initiatives specifically targeting malaria control, creates a fertile ground for market expansion. Significant advancements in diagnostic technologies, ranging from rapid diagnostic tests (RDTs) to more sophisticated molecular assays, are enhancing detection capabilities. Furthermore, a growing awareness among populations about the disease and the importance of early diagnosis further fuels demand. For instance, substantial investments by organizations like The Global Fund in comprehensive malaria control programs directly translate into a heightened market demand for effective diagnostic solutions.
Key Challenges: Despite the positive momentum, the malaria diagnostics industry faces several hurdles. The high initial investment costs associated with adopting advanced diagnostic technologies can be a significant barrier for healthcare facilities, particularly in resource-constrained settings. Limited access to essential diagnostic services in remote and underserved rural areas remains a critical challenge, hindering timely diagnosis and treatment. Inadequate healthcare infrastructure in many endemic regions further complicates the effective deployment and utilization of diagnostic tools. Navigating complex regulatory hurdles can also impact market entry and the efficient distribution of diagnostic products. Moreover, disruptions in global supply chains can lead to critical shortages and price volatility, as evidenced by significant price increases in RDTs observed in recent years due to such issues. The intensely competitive landscape among existing players also exerts pressure on market dynamics, influencing pricing strategies and innovation.
Emerging Opportunities in Malaria Diagnostics Industry
The malaria diagnostics landscape is ripe with emerging opportunities. A significant area of growth lies in expanding diagnostic services to reach previously underserved rural and remote populations, ensuring equitable access to critical testing. The development and adoption of integrated diagnostic platforms that can simultaneously detect multiple pathogens, including different malaria species and co-infections, offer a more comprehensive and efficient diagnostic approach. The increasing integration of digital technologies, such as mobile health (mHealth) applications and cloud-based data analysis systems, is revolutionizing disease surveillance, enabling real-time tracking of outbreaks and improving public health responses. The incorporation of artificial intelligence (AI) and machine learning (ML) into diagnostic tools holds immense promise for enhancing diagnostic accuracy, automating analysis, and optimizing resource allocation. Untapped market potential exists in regions experiencing a burgeoning investment in healthcare infrastructure and a growing commitment to disease elimination.
Growth Accelerators in the Malaria Diagnostics Industry
Technological breakthroughs in molecular diagnostics, coupled with increasing affordability, are significant growth accelerators. Strategic partnerships between diagnostic companies, healthcare organizations, and government agencies are crucial for market expansion and access to underserved populations. Expansion into new markets, particularly in regions with high malaria prevalence and increasing healthcare infrastructure, will drive long-term growth.
Key Players Shaping the Malaria Diagnostics Industry Market
- AdvaCare Pharma
- BioMérieux SA
- Bio-Rad Laboratories, Inc.
- Nikon Corporation
- Siemens Healthineers
- Abbott Laboratories
- Ortho Clinical Diagnostics
- Premier Medical Corporation Pvt Ltd
- Advy Chemical Pvt Ltd
- Zephyr Biomedicals
- Access Bio, Inc.
- Thermo Fisher Scientific
Notable Milestones in Malaria Diagnostics Industry Sector
- June 2022: SC Johnson and The Global Fund announced a significant partnership aimed at eradicating malaria. The Global Fund's substantial commitment of over USD 16 billion towards malaria control programs underscores the critical role of sustained funding in driving market demand and fostering innovation in diagnostics.
- February 2022: The Kenya Medical Research Institute (KEMRI) successfully launched the Plasmochek diagnostic kit, representing a valuable addition to the market and a testament to advancements in local diagnostic development.
In-Depth Malaria Diagnostics Industry Market Outlook
The Malaria Diagnostics market is on a trajectory of sustained and robust growth. This expansion is primarily fueled by continuous technological innovations that are leading to more accurate, faster, and accessible diagnostic solutions. Increased global and national funding allocated to malaria control and elimination programs provides the necessary financial impetus for market development. Coupled with this is a growing public and healthcare provider awareness regarding the critical importance of early and precise diagnosis for effective disease management. Strategic collaborations between research institutions, diagnostic manufacturers, and public health organizations are crucial for accelerating product development and market penetration. Expanding diagnostic services into previously underserved and remote regions remains a key strategic imperative for capturing future market potential. The ongoing development of innovative diagnostic solutions, with a particular focus on affordable and user-friendly point-of-care (POC) diagnostics and enhanced diagnostic accuracy, will continue to be the defining forces shaping the dynamics and future trajectory of the malaria diagnostics market.
Malaria Diagnostics Industry Segmentation
-
1. Technology
- 1.1. Clinical Diagnostics
- 1.2. Microscopic Diagnostics
- 1.3. Rapid Diagnostic Tests (RDTs)
- 1.4. Molecular Diagnostics
- 1.5. Other Technologies
Malaria Diagnostics Industry Segmentation By Geography
-
1. Americas
- 1.1. Venezuela
- 1.2. Brazil
- 1.3. Colombia
- 1.4. Rest of the Americas
-
2. Europe
- 2.1. Germany
- 2.2. United Kingdom
- 2.3. France
- 2.4. Turkey
- 2.5. Spain
- 2.6. Rest of Europe
- 3. Asia Pacific
-
4. India
- 4.1. Myanmar
- 4.2. Indonesia
- 4.3. Pakistan
- 4.4. China
- 4.5. Papua New Guinea
- 4.6. Cambodia
- 4.7. Rest of Asia Pacific
-
5. Africa
- 5.1. Democratic Republic of Congo
- 5.2. Nigeria
- 5.3. Uganda
- 5.4. Rest of Africa
Malaria Diagnostics Industry Regional Market Share
Geographic Coverage of Malaria Diagnostics Industry
Malaria Diagnostics Industry REPORT HIGHLIGHTS
| Aspects | Details |
|---|---|
| Study Period | 2020-2034 |
| Base Year | 2025 |
| Estimated Year | 2026 |
| Forecast Period | 2026-2034 |
| Historical Period | 2020-2025 |
| Growth Rate | CAGR of 5.23% from 2020-2034 |
| Segmentation |
|
Table of Contents
- 1. Introduction
- 1.1. Research Scope
- 1.2. Market Segmentation
- 1.3. Research Objective
- 1.4. Definitions and Assumptions
- 2. Executive Summary
- 2.1. Market Snapshot
- 3. Market Dynamics
- 3.1. Market Drivers
- 3.2. Market Restrains
- 3.3. Market Trends
- 3.4. Market Opportunities
- 4. Market Factor Analysis
- 4.1. Porters Five Forces
- 4.1.1. Bargaining Power of Suppliers
- 4.1.2. Bargaining Power of Buyers
- 4.1.3. Threat of New Entrants
- 4.1.4. Threat of Substitutes
- 4.1.5. Competitive Rivalry
- 4.2. PESTEL analysis
- 4.3. BCG Analysis
- 4.3.1. Stars (High Growth, High Market Share)
- 4.3.2. Cash Cows (Low Growth, High Market Share)
- 4.3.3. Question Mark (High Growth, Low Market Share)
- 4.3.4. Dogs (Low Growth, Low Market Share)
- 4.4. Ansoff Matrix Analysis
- 4.5. Supply Chain Analysis
- 4.6. Regulatory Landscape
- 4.7. Current Market Potential and Opportunity Assessment (TAM–SAM–SOM Framework)
- 4.8. NRP Analyst Note
- 4.1. Porters Five Forces
- 5. Market Analysis, Insights and Forecast 2021-2033
- 5.1. Market Analysis, Insights and Forecast - by Technology
- 5.1.1. Clinical Diagnostics
- 5.1.2. Microscopic Diagnostics
- 5.1.3. Rapid Diagnostic Tests (RDTs)
- 5.1.4. Molecular Diagnostics
- 5.1.5. Other Technologies
- 5.2. Market Analysis, Insights and Forecast - by Region
- 5.2.1. Americas
- 5.2.2. Europe
- 5.2.3. Asia Pacific
- 5.2.4. India
- 5.2.5. Africa
- 5.1. Market Analysis, Insights and Forecast - by Technology
- 6. Global Malaria Diagnostics Industry Analysis, Insights and Forecast, 2021-2033
- 6.1. Market Analysis, Insights and Forecast - by Technology
- 6.1.1. Clinical Diagnostics
- 6.1.2. Microscopic Diagnostics
- 6.1.3. Rapid Diagnostic Tests (RDTs)
- 6.1.4. Molecular Diagnostics
- 6.1.5. Other Technologies
- 6.1. Market Analysis, Insights and Forecast - by Technology
- 7. Americas Malaria Diagnostics Industry Analysis, Insights and Forecast, 2020-2032
- 7.1. Market Analysis, Insights and Forecast - by Technology
- 7.1.1. Clinical Diagnostics
- 7.1.2. Microscopic Diagnostics
- 7.1.3. Rapid Diagnostic Tests (RDTs)
- 7.1.4. Molecular Diagnostics
- 7.1.5. Other Technologies
- 7.1. Market Analysis, Insights and Forecast - by Technology
- 8. Europe Malaria Diagnostics Industry Analysis, Insights and Forecast, 2020-2032
- 8.1. Market Analysis, Insights and Forecast - by Technology
- 8.1.1. Clinical Diagnostics
- 8.1.2. Microscopic Diagnostics
- 8.1.3. Rapid Diagnostic Tests (RDTs)
- 8.1.4. Molecular Diagnostics
- 8.1.5. Other Technologies
- 8.1. Market Analysis, Insights and Forecast - by Technology
- 9. Asia Pacific Malaria Diagnostics Industry Analysis, Insights and Forecast, 2020-2032
- 9.1. Market Analysis, Insights and Forecast - by Technology
- 9.1.1. Clinical Diagnostics
- 9.1.2. Microscopic Diagnostics
- 9.1.3. Rapid Diagnostic Tests (RDTs)
- 9.1.4. Molecular Diagnostics
- 9.1.5. Other Technologies
- 9.1. Market Analysis, Insights and Forecast - by Technology
- 10. India Malaria Diagnostics Industry Analysis, Insights and Forecast, 2020-2032
- 10.1. Market Analysis, Insights and Forecast - by Technology
- 10.1.1. Clinical Diagnostics
- 10.1.2. Microscopic Diagnostics
- 10.1.3. Rapid Diagnostic Tests (RDTs)
- 10.1.4. Molecular Diagnostics
- 10.1.5. Other Technologies
- 10.1. Market Analysis, Insights and Forecast - by Technology
- 11. Africa Malaria Diagnostics Industry Analysis, Insights and Forecast, 2020-2032
- 11.1. Market Analysis, Insights and Forecast - by Technology
- 11.1.1. Clinical Diagnostics
- 11.1.2. Microscopic Diagnostics
- 11.1.3. Rapid Diagnostic Tests (RDTs)
- 11.1.4. Molecular Diagnostics
- 11.1.5. Other Technologies
- 11.1. Market Analysis, Insights and Forecast - by Technology
- 12. Competitive Analysis
- 12.1. Company Profiles
- 12.1.1 AdvaCare Pharma*List Not Exhaustive
- 12.1.1.1. Company Overview
- 12.1.1.2. Products
- 12.1.1.3. Company Financials
- 12.1.1.4. SWOT Analysis
- 12.1.2 BioMerieux SA
- 12.1.2.1. Company Overview
- 12.1.2.2. Products
- 12.1.2.3. Company Financials
- 12.1.2.4. SWOT Analysis
- 12.1.3 Bio-Rad Laboratories Inc
- 12.1.3.1. Company Overview
- 12.1.3.2. Products
- 12.1.3.3. Company Financials
- 12.1.3.4. SWOT Analysis
- 12.1.4 Nikon Corporation
- 12.1.4.1. Company Overview
- 12.1.4.2. Products
- 12.1.4.3. Company Financials
- 12.1.4.4. SWOT Analysis
- 12.1.5 Siemens Healthineers
- 12.1.5.1. Company Overview
- 12.1.5.2. Products
- 12.1.5.3. Company Financials
- 12.1.5.4. SWOT Analysis
- 12.1.6 Abbott Laboratories
- 12.1.6.1. Company Overview
- 12.1.6.2. Products
- 12.1.6.3. Company Financials
- 12.1.6.4. SWOT Analysis
- 12.1.7 Ortho Clinical Diagnostics
- 12.1.7.1. Company Overview
- 12.1.7.2. Products
- 12.1.7.3. Company Financials
- 12.1.7.4. SWOT Analysis
- 12.1.8 Premier Medical Corporation Pvt Ltd
- 12.1.8.1. Company Overview
- 12.1.8.2. Products
- 12.1.8.3. Company Financials
- 12.1.8.4. SWOT Analysis
- 12.1.9 Advy Chemical Pvt Ltd
- 12.1.9.1. Company Overview
- 12.1.9.2. Products
- 12.1.9.3. Company Financials
- 12.1.9.4. SWOT Analysis
- 12.1.10 Zephyr Biomedicals
- 12.1.10.1. Company Overview
- 12.1.10.2. Products
- 12.1.10.3. Company Financials
- 12.1.10.4. SWOT Analysis
- 12.1.11 Access Bio Inc
- 12.1.11.1. Company Overview
- 12.1.11.2. Products
- 12.1.11.3. Company Financials
- 12.1.11.4. SWOT Analysis
- 12.1.12 Thermo Fisher Scientific
- 12.1.12.1. Company Overview
- 12.1.12.2. Products
- 12.1.12.3. Company Financials
- 12.1.12.4. SWOT Analysis
- 12.1.1 AdvaCare Pharma*List Not Exhaustive
- 12.2. Market Entropy
- 12.2.1 Company's Key Areas Served
- 12.2.2 Recent Developments
- 12.3. Company Market Share Analysis 2025
- 12.3.1 Top 5 Companies Market Share Analysis
- 12.3.2 Top 3 Companies Market Share Analysis
- 12.4. List of Potential Customers
- 13. Research Methodology
List of Figures
- Figure 1: Global Malaria Diagnostics Industry Revenue Breakdown (Million, %) by Region 2025 & 2033
- Figure 2: Americas Malaria Diagnostics Industry Revenue (Million), by Technology 2025 & 2033
- Figure 3: Americas Malaria Diagnostics Industry Revenue Share (%), by Technology 2025 & 2033
- Figure 4: Americas Malaria Diagnostics Industry Revenue (Million), by Country 2025 & 2033
- Figure 5: Americas Malaria Diagnostics Industry Revenue Share (%), by Country 2025 & 2033
- Figure 6: Europe Malaria Diagnostics Industry Revenue (Million), by Technology 2025 & 2033
- Figure 7: Europe Malaria Diagnostics Industry Revenue Share (%), by Technology 2025 & 2033
- Figure 8: Europe Malaria Diagnostics Industry Revenue (Million), by Country 2025 & 2033
- Figure 9: Europe Malaria Diagnostics Industry Revenue Share (%), by Country 2025 & 2033
- Figure 10: Asia Pacific Malaria Diagnostics Industry Revenue (Million), by Technology 2025 & 2033
- Figure 11: Asia Pacific Malaria Diagnostics Industry Revenue Share (%), by Technology 2025 & 2033
- Figure 12: Asia Pacific Malaria Diagnostics Industry Revenue (Million), by Country 2025 & 2033
- Figure 13: Asia Pacific Malaria Diagnostics Industry Revenue Share (%), by Country 2025 & 2033
- Figure 14: India Malaria Diagnostics Industry Revenue (Million), by Technology 2025 & 2033
- Figure 15: India Malaria Diagnostics Industry Revenue Share (%), by Technology 2025 & 2033
- Figure 16: India Malaria Diagnostics Industry Revenue (Million), by Country 2025 & 2033
- Figure 17: India Malaria Diagnostics Industry Revenue Share (%), by Country 2025 & 2033
- Figure 18: Africa Malaria Diagnostics Industry Revenue (Million), by Technology 2025 & 2033
- Figure 19: Africa Malaria Diagnostics Industry Revenue Share (%), by Technology 2025 & 2033
- Figure 20: Africa Malaria Diagnostics Industry Revenue (Million), by Country 2025 & 2033
- Figure 21: Africa Malaria Diagnostics Industry Revenue Share (%), by Country 2025 & 2033
List of Tables
- Table 1: Global Malaria Diagnostics Industry Revenue Million Forecast, by Technology 2020 & 2033
- Table 2: Global Malaria Diagnostics Industry Revenue Million Forecast, by Region 2020 & 2033
- Table 3: Global Malaria Diagnostics Industry Revenue Million Forecast, by Technology 2020 & 2033
- Table 4: Global Malaria Diagnostics Industry Revenue Million Forecast, by Country 2020 & 2033
- Table 5: Venezuela Malaria Diagnostics Industry Revenue (Million) Forecast, by Application 2020 & 2033
- Table 6: Brazil Malaria Diagnostics Industry Revenue (Million) Forecast, by Application 2020 & 2033
- Table 7: Colombia Malaria Diagnostics Industry Revenue (Million) Forecast, by Application 2020 & 2033
- Table 8: Rest of the Americas Malaria Diagnostics Industry Revenue (Million) Forecast, by Application 2020 & 2033
- Table 9: Global Malaria Diagnostics Industry Revenue Million Forecast, by Technology 2020 & 2033
- Table 10: Global Malaria Diagnostics Industry Revenue Million Forecast, by Country 2020 & 2033
- Table 11: Germany Malaria Diagnostics Industry Revenue (Million) Forecast, by Application 2020 & 2033
- Table 12: United Kingdom Malaria Diagnostics Industry Revenue (Million) Forecast, by Application 2020 & 2033
- Table 13: France Malaria Diagnostics Industry Revenue (Million) Forecast, by Application 2020 & 2033
- Table 14: Turkey Malaria Diagnostics Industry Revenue (Million) Forecast, by Application 2020 & 2033
- Table 15: Spain Malaria Diagnostics Industry Revenue (Million) Forecast, by Application 2020 & 2033
- Table 16: Rest of Europe Malaria Diagnostics Industry Revenue (Million) Forecast, by Application 2020 & 2033
- Table 17: Global Malaria Diagnostics Industry Revenue Million Forecast, by Technology 2020 & 2033
- Table 18: Global Malaria Diagnostics Industry Revenue Million Forecast, by Country 2020 & 2033
- Table 19: Global Malaria Diagnostics Industry Revenue Million Forecast, by Technology 2020 & 2033
- Table 20: Global Malaria Diagnostics Industry Revenue Million Forecast, by Country 2020 & 2033
- Table 21: Myanmar Malaria Diagnostics Industry Revenue (Million) Forecast, by Application 2020 & 2033
- Table 22: Indonesia Malaria Diagnostics Industry Revenue (Million) Forecast, by Application 2020 & 2033
- Table 23: Pakistan Malaria Diagnostics Industry Revenue (Million) Forecast, by Application 2020 & 2033
- Table 24: China Malaria Diagnostics Industry Revenue (Million) Forecast, by Application 2020 & 2033
- Table 25: Papua New Guinea Malaria Diagnostics Industry Revenue (Million) Forecast, by Application 2020 & 2033
- Table 26: Cambodia Malaria Diagnostics Industry Revenue (Million) Forecast, by Application 2020 & 2033
- Table 27: Rest of Asia Pacific Malaria Diagnostics Industry Revenue (Million) Forecast, by Application 2020 & 2033
- Table 28: Global Malaria Diagnostics Industry Revenue Million Forecast, by Technology 2020 & 2033
- Table 29: Global Malaria Diagnostics Industry Revenue Million Forecast, by Country 2020 & 2033
- Table 30: Democratic Republic of Congo Malaria Diagnostics Industry Revenue (Million) Forecast, by Application 2020 & 2033
- Table 31: Nigeria Malaria Diagnostics Industry Revenue (Million) Forecast, by Application 2020 & 2033
- Table 32: Uganda Malaria Diagnostics Industry Revenue (Million) Forecast, by Application 2020 & 2033
- Table 33: Rest of Africa Malaria Diagnostics Industry Revenue (Million) Forecast, by Application 2020 & 2033
Frequently Asked Questions
1. What is the projected Compound Annual Growth Rate (CAGR) of the Malaria Diagnostics Industry?
The projected CAGR is approximately 5.23%.
2. Which companies are prominent players in the Malaria Diagnostics Industry?
Key companies in the market include AdvaCare Pharma*List Not Exhaustive, BioMerieux SA, Bio-Rad Laboratories Inc, Nikon Corporation, Siemens Healthineers, Abbott Laboratories, Ortho Clinical Diagnostics, Premier Medical Corporation Pvt Ltd, Advy Chemical Pvt Ltd, Zephyr Biomedicals, Access Bio Inc, Thermo Fisher Scientific.
3. What are the main segments of the Malaria Diagnostics Industry?
The market segments include Technology.
4. Can you provide details about the market size?
The market size is estimated to be USD 0.86 Million as of 2022.
5. What are some drivers contributing to market growth?
Growing Demand for Diagnostic Tools in Malaria-endemic Regions; Increasing Technological Advancements and Efficient Diagnostics; Scale-up of Rapid Diagnostic Tests and Universal Access to Diagnosis.
6. What are the notable trends driving market growth?
Microscopic Diagnostics is Expected to Hold the Highest Market Share in the Technology Segment.
7. Are there any restraints impacting market growth?
Increasing Number of Malaria-free Countries; Rising Demand for Low-cost Diagnostic Tools.
8. Can you provide examples of recent developments in the market?
In June 2022, SC Johnson and Global Fund partnered to eradicate malaria. The Global Fund provides 56% of all international financing for malaria programs (39% of total available resources) and invested more than USD 16 billion in malaria control programs to date.
9. What pricing options are available for accessing the report?
Pricing options include single-user, multi-user, and enterprise licenses priced at USD 4750, USD 5250, and USD 8750 respectively.
10. Is the market size provided in terms of value or volume?
The market size is provided in terms of value, measured in Million.
11. Are there any specific market keywords associated with the report?
Yes, the market keyword associated with the report is "Malaria Diagnostics Industry," which aids in identifying and referencing the specific market segment covered.
12. How do I determine which pricing option suits my needs best?
The pricing options vary based on user requirements and access needs. Individual users may opt for single-user licenses, while businesses requiring broader access may choose multi-user or enterprise licenses for cost-effective access to the report.
13. Are there any additional resources or data provided in the Malaria Diagnostics Industry report?
While the report offers comprehensive insights, it's advisable to review the specific contents or supplementary materials provided to ascertain if additional resources or data are available.
14. How can I stay updated on further developments or reports in the Malaria Diagnostics Industry?
To stay informed about further developments, trends, and reports in the Malaria Diagnostics Industry, consider subscribing to industry newsletters, following relevant companies and organizations, or regularly checking reputable industry news sources and publications.
Methodology
Step 1 - Identification of Relevant Samples Size from Population Database


Step 2 - Approaches for Defining Global Market Size (Value, Volume* & Price*)

Note*: In applicable scenarios
Step 3 - Data Sources
Primary Research
- Web Analytics
- Survey Reports
- Research Institute
- Latest Research Reports
- Opinion Leaders
Secondary Research
- Annual Reports
- White Paper
- Latest Press Release
- Industry Association
- Paid Database
- Investor Presentations

Step 4 - Data Triangulation
Involves using different sources of information in order to increase the validity of a study
These sources are likely to be stakeholders in a program - participants, other researchers, program staff, other community members, and so on.
Then we put all data in single framework & apply various statistical tools to find out the dynamic on the market.
During the analysis stage, feedback from the stakeholder groups would be compared to determine areas of agreement as well as areas of divergence