

Key Insights
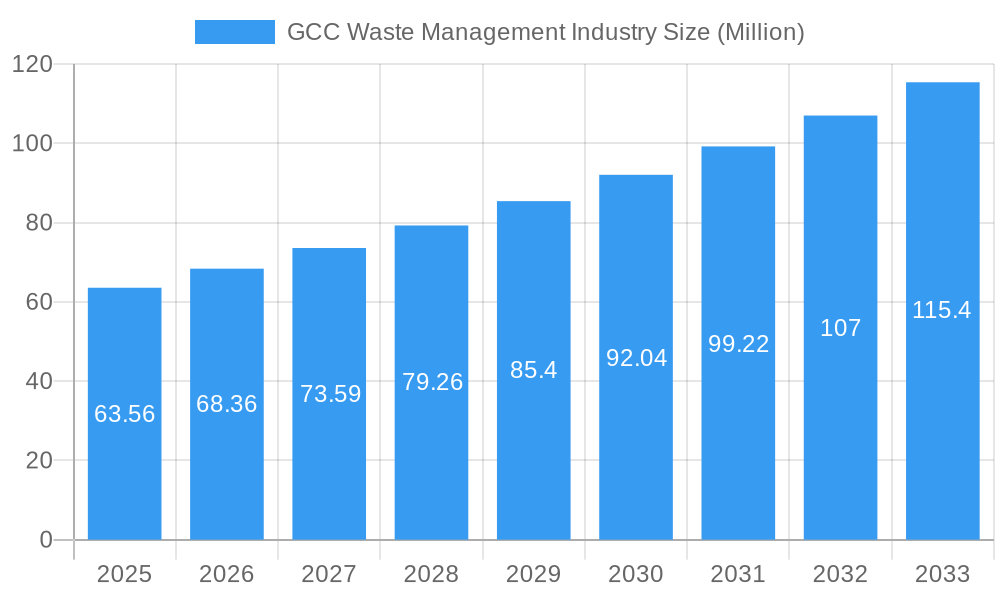
The GCC waste management market, valued at $63.56 million in 2025, is experiencing robust growth, projected to expand at a Compound Annual Growth Rate (CAGR) of 7.38% from 2025 to 2033. This surge is driven by several key factors. Increasing urbanization and population growth across the GCC nations are generating significantly larger volumes of waste. Simultaneously, heightened environmental awareness among governments and citizens is fueling demand for sustainable waste management solutions, including recycling and waste-to-energy initiatives. Stringent government regulations aimed at improving environmental standards and reducing landfill reliance further contribute to market expansion. The region is witnessing increased adoption of advanced waste management technologies, such as smart bins and automated waste collection systems, boosting efficiency and reducing operational costs. Furthermore, private sector investment in innovative waste processing technologies and infrastructure development is playing a significant role in driving market growth.
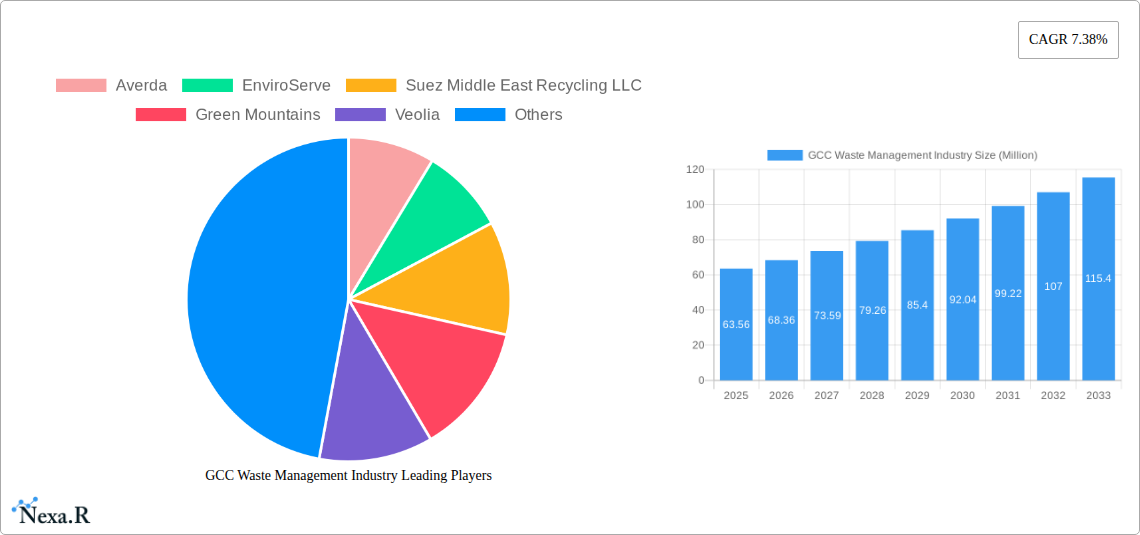
GCC Waste Management Industry Market Size (In Million)
Key players like Averda, Suez Middle East Recycling LLC, Veolia, and Bee'ah are actively shaping the market landscape through strategic partnerships, technological advancements, and expansion into new service areas. However, challenges remain. High infrastructure costs associated with establishing modern waste processing facilities can be a barrier to entry for smaller companies. Furthermore, inconsistencies in waste segregation practices across different regions and the lack of public awareness regarding proper waste disposal remain significant hurdles. Overcoming these challenges through public-private partnerships and targeted awareness campaigns will be crucial for sustainable growth of the GCC waste management industry. Future projections indicate continued strong growth, fueled by ongoing infrastructural development, evolving environmental regulations, and the increasing focus on circular economy principles.
GCC Waste Management Industry Company Market Share
GCC Waste Management Industry: Market Report 2019-2033
This comprehensive report provides an in-depth analysis of the GCC waste management industry, encompassing market dynamics, growth trends, key players, and future outlook. With a study period spanning 2019-2033 (base year 2025, forecast period 2025-2033), this report is an indispensable resource for industry professionals, investors, and strategic decision-makers. The report covers the parent market of environmental services and the child market of waste management specifically within the Gulf Cooperation Council (GCC) region.
GCC Waste Management Industry Market Dynamics & Structure
The GCC waste management market is characterized by a moderately consolidated structure, with both large multinational corporations and regional players vying for market share. Market size in 2025 is estimated at xx Million. The industry is driven by stringent government regulations promoting sustainable waste management practices and increasing environmental awareness among consumers. Technological innovation, particularly in waste-to-energy and recycling technologies, is a significant growth driver. However, high initial investment costs and the need for skilled labor can act as barriers to entry.
Market Structure:
- Market Concentration: Moderately consolidated, with a few dominant players holding significant market share (estimated at xx% collectively in 2025).
- Technological Innovation: Focus on waste-to-energy, advanced recycling techniques, and smart waste management solutions.
- Regulatory Framework: Stringent environmental regulations driving adoption of sustainable practices and technological upgrades.
- Competitive Substitutes: Limited direct substitutes; however, cost-effective informal waste management practices remain a competitive pressure.
- End-User Demographics: Rapid urbanization and population growth contribute to increasing waste generation, fueling demand for efficient waste management services.
- M&A Trends: Moderate level of M&A activity, with larger players acquiring smaller companies to expand their service portfolios and geographical reach. An estimated xx M&A deals occurred between 2019 and 2024.
GCC Waste Management Industry Growth Trends & Insights
The GCC waste management market is experiencing robust growth, driven by factors such as increasing urbanization, rising environmental concerns, and supportive government policies. The market is projected to exhibit a CAGR of xx% during the forecast period (2025-2033), reaching an estimated value of xx Million by 2033. This growth is being propelled by technological advancements, such as the implementation of smart waste management systems and waste-to-energy plants, and a shift towards more sustainable waste disposal methods. Market penetration of advanced recycling technologies is expected to increase significantly. Consumer awareness regarding environmental sustainability is also playing a pivotal role in driving market growth. The adoption rate of waste segregation at the household level is expected to increase from xx% in 2025 to xx% by 2033.
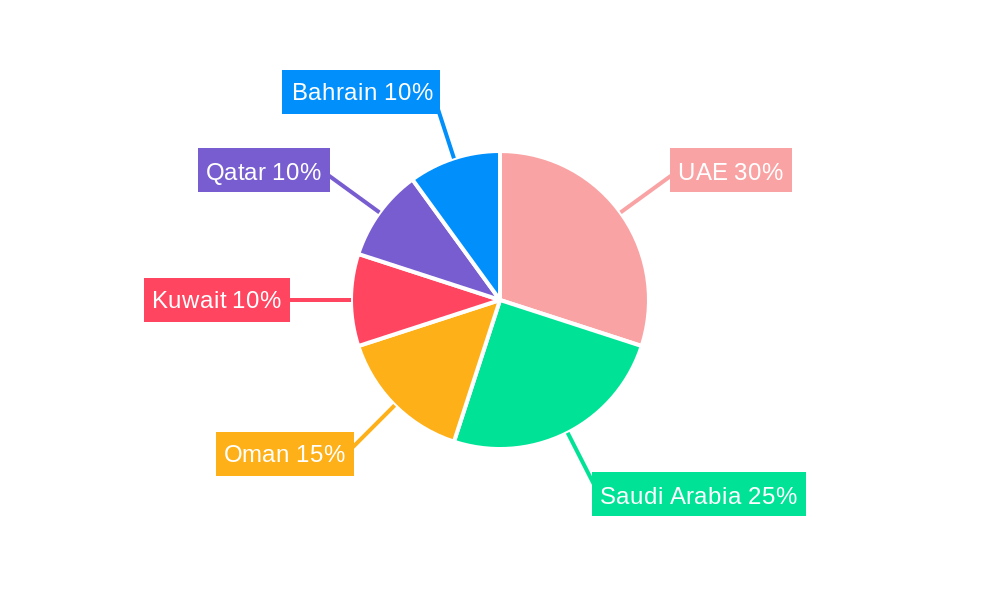
Dominant Regions, Countries, or Segments in GCC Waste Management Industry
The UAE and Saudi Arabia are currently the dominant markets within the GCC region, accounting for the largest share of the total market value. This dominance is attributed to their advanced infrastructure, robust economies, and strong government support for sustainable waste management initiatives. Further growth is expected in other GCC countries, particularly those experiencing rapid urbanization and industrialization.
Key Drivers:
- Strong Economic Growth: High disposable incomes and robust economic activity lead to increased waste generation and greater spending on waste management solutions.
- Government Initiatives: Stringent regulations, supportive policies, and substantial investments in waste management infrastructure.
- Infrastructure Development: Expansion of urban areas and industrial zones requires commensurate improvements in waste management systems.
- Tourism Sector: The growth of tourism in the region further increases the volume of waste generated, necessitating effective waste management strategies.
GCC Waste Management Industry Product Landscape
The GCC waste management industry offers a diverse range of products and services, encompassing collection, transportation, processing, recycling, and disposal solutions. Significant advancements have been made in waste-to-energy technologies, with increased efficiency and reduced environmental impact. Smart waste management systems utilizing IoT and data analytics are gaining traction, enabling optimized waste collection routes and improved resource allocation. Unique selling propositions include the use of innovative technologies, tailored solutions for specific waste streams, and focus on sustainability and environmental protection.
Key Drivers, Barriers & Challenges in GCC Waste Management Industry
Key Drivers:
- Government regulations: Stringent environmental policies and financial incentives promote sustainable waste management practices.
- Technological advancements: Innovative solutions, such as waste-to-energy plants and smart bins, increase efficiency and reduce environmental impact.
- Rising environmental awareness: Growing public concern about pollution and waste disposal is driving demand for eco-friendly solutions.
Challenges and Restraints:
- High infrastructure costs: The initial investment for establishing and maintaining efficient waste management systems can be significant.
- Lack of skilled labor: The sector faces a shortage of trained professionals specializing in waste management technologies and operations.
- Land scarcity: Finding suitable land for landfill sites in densely populated areas presents a major challenge. This results in an estimated xx Million shortfall in landfill capacity by 2030.
Emerging Opportunities in GCC Waste Management Industry
- Waste-to-energy projects: Growing interest in converting waste into renewable energy offers significant opportunities for investment and innovation.
- Advanced recycling technologies: Opportunities to develop and implement advanced recycling processes for plastic, e-waste, and other challenging materials.
- Circular economy initiatives: Developing closed-loop systems for waste management, promoting reuse and resource recovery.
Growth Accelerators in the GCC Waste Management Industry
Strategic partnerships between private sector companies and government entities are crucial for accelerating growth. Technological advancements, particularly in AI-powered waste management systems and advanced recycling technologies, offer significant opportunities for market expansion. The development of efficient waste-to-energy infrastructure will further enhance the sustainability of waste management operations within the GCC.
Key Players Shaping the GCC Waste Management Industry Market
- Averda
- EnviroServe
- Suez Middle East Recycling LLC
- Green Mountains
- Veolia
- Blue LLC
- Envac
- SEPCO Environment
- Wasco
- Saudi Investment Recycling Company
- Dulsco Waste Management Services
- Bee'ah
- Power Waste Management and Transport LLC
- Al Haya Enviro
- Bin-Ovation
- United Waste Management Company
- Kuwait Waste Collection and Recycling Company
- List Not Exhaustive
Notable Milestones in GCC Waste Management Industry Sector
- December 2023: Wardwizard Innovations and Mobility partnered with BEEAH Group to promote electric vehicles in GCC and Africa, impacting waste management through sustainable transportation.
- October 2022: Marafiq commenced construction of a new 300,000 m3/d sewage treatment plant at Jeddah Airport II, highlighting infrastructure investment in waste management.
- September 2022: Ashghal awarded a USD 1.48 billion contract for a 150,000 cubic meter per day sewage treatment facility, showcasing large-scale investment in the sector.
In-Depth GCC Waste Management Industry Market Outlook
The GCC waste management industry presents a promising outlook for long-term growth, driven by increasing urbanization, stringent regulations, and technological innovation. Strategic partnerships, investments in sustainable infrastructure, and the adoption of advanced technologies will play a vital role in shaping the future of the market. The focus on circular economy principles and waste-to-energy solutions will unlock significant opportunities for both established players and new entrants. The market is expected to continue its robust growth trajectory, exceeding xx Million by 2033.
GCC Waste Management Industry Segmentation
-
1. Waste Type
- 1.1. Industrial Waste
- 1.2. Municipal Solid Waste
- 1.3. Hazardous Waste
- 1.4. E-Waste
- 1.5. Plastic Waste
- 1.6. Bio-Medical Waste
-
2. Disposal Method
- 2.1. Collection
- 2.2. Landfills
- 2.3. Incineration
- 2.4. Recycling
GCC Waste Management Industry Segmentation By Geography
-
1. North America
- 1.1. United States
- 1.2. Canada
- 1.3. Mexico
-
2. South America
- 2.1. Brazil
- 2.2. Argentina
- 2.3. Rest of South America
-
3. Europe
- 3.1. United Kingdom
- 3.2. Germany
- 3.3. France
- 3.4. Italy
- 3.5. Spain
- 3.6. Russia
- 3.7. Benelux
- 3.8. Nordics
- 3.9. Rest of Europe
-
4. Middle East & Africa
- 4.1. Turkey
- 4.2. Israel
- 4.3. GCC
- 4.4. North Africa
- 4.5. South Africa
- 4.6. Rest of Middle East & Africa
-
5. Asia Pacific
- 5.1. China
- 5.2. India
- 5.3. Japan
- 5.4. South Korea
- 5.5. ASEAN
- 5.6. Oceania
- 5.7. Rest of Asia Pacific
GCC Waste Management Industry Regional Market Share
Geographic Coverage of GCC Waste Management Industry
GCC Waste Management Industry REPORT HIGHLIGHTS
| Aspects | Details |
|---|---|
| Study Period | 2020-2034 |
| Base Year | 2025 |
| Estimated Year | 2026 |
| Forecast Period | 2026-2034 |
| Historical Period | 2020-2025 |
| Growth Rate | CAGR of 7.38% from 2020-2034 |
| Segmentation |
|
Table of Contents
- 1. Introduction
- 1.1. Research Scope
- 1.2. Market Segmentation
- 1.3. Research Objective
- 1.4. Definitions and Assumptions
- 2. Executive Summary
- 2.1. Market Snapshot
- 3. Market Dynamics
- 3.1. Market Drivers
- 3.2. Market Restrains
- 3.3. Market Trends
- 3.4. Market Opportunities
- 4. Market Factor Analysis
- 4.1. Porters Five Forces
- 4.1.1. Bargaining Power of Suppliers
- 4.1.2. Bargaining Power of Buyers
- 4.1.3. Threat of New Entrants
- 4.1.4. Threat of Substitutes
- 4.1.5. Competitive Rivalry
- 4.2. PESTEL analysis
- 4.3. BCG Analysis
- 4.3.1. Stars (High Growth, High Market Share)
- 4.3.2. Cash Cows (Low Growth, High Market Share)
- 4.3.3. Question Mark (High Growth, Low Market Share)
- 4.3.4. Dogs (Low Growth, Low Market Share)
- 4.4. Ansoff Matrix Analysis
- 4.5. Supply Chain Analysis
- 4.6. Regulatory Landscape
- 4.7. Current Market Potential and Opportunity Assessment (TAM–SAM–SOM Framework)
- 4.8. NRP Analyst Note
- 4.1. Porters Five Forces
- 5. Market Analysis, Insights and Forecast 2021-2033
- 5.1. Market Analysis, Insights and Forecast - by Waste Type
- 5.1.1. Industrial Waste
- 5.1.2. Municipal Solid Waste
- 5.1.3. Hazardous Waste
- 5.1.4. E-Waste
- 5.1.5. Plastic Waste
- 5.1.6. Bio-Medical Waste
- 5.2. Market Analysis, Insights and Forecast - by Disposal Method
- 5.2.1. Collection
- 5.2.2. Landfills
- 5.2.3. Incineration
- 5.2.4. Recycling
- 5.3. Market Analysis, Insights and Forecast - by Region
- 5.3.1. North America
- 5.3.2. South America
- 5.3.3. Europe
- 5.3.4. Middle East & Africa
- 5.3.5. Asia Pacific
- 5.1. Market Analysis, Insights and Forecast - by Waste Type
- 6. Global GCC Waste Management Industry Analysis, Insights and Forecast, 2021-2033
- 6.1. Market Analysis, Insights and Forecast - by Waste Type
- 6.1.1. Industrial Waste
- 6.1.2. Municipal Solid Waste
- 6.1.3. Hazardous Waste
- 6.1.4. E-Waste
- 6.1.5. Plastic Waste
- 6.1.6. Bio-Medical Waste
- 6.2. Market Analysis, Insights and Forecast - by Disposal Method
- 6.2.1. Collection
- 6.2.2. Landfills
- 6.2.3. Incineration
- 6.2.4. Recycling
- 6.1. Market Analysis, Insights and Forecast - by Waste Type
- 7. North America GCC Waste Management Industry Analysis, Insights and Forecast, 2020-2032
- 7.1. Market Analysis, Insights and Forecast - by Waste Type
- 7.1.1. Industrial Waste
- 7.1.2. Municipal Solid Waste
- 7.1.3. Hazardous Waste
- 7.1.4. E-Waste
- 7.1.5. Plastic Waste
- 7.1.6. Bio-Medical Waste
- 7.2. Market Analysis, Insights and Forecast - by Disposal Method
- 7.2.1. Collection
- 7.2.2. Landfills
- 7.2.3. Incineration
- 7.2.4. Recycling
- 7.1. Market Analysis, Insights and Forecast - by Waste Type
- 8. South America GCC Waste Management Industry Analysis, Insights and Forecast, 2020-2032
- 8.1. Market Analysis, Insights and Forecast - by Waste Type
- 8.1.1. Industrial Waste
- 8.1.2. Municipal Solid Waste
- 8.1.3. Hazardous Waste
- 8.1.4. E-Waste
- 8.1.5. Plastic Waste
- 8.1.6. Bio-Medical Waste
- 8.2. Market Analysis, Insights and Forecast - by Disposal Method
- 8.2.1. Collection
- 8.2.2. Landfills
- 8.2.3. Incineration
- 8.2.4. Recycling
- 8.1. Market Analysis, Insights and Forecast - by Waste Type
- 9. Europe GCC Waste Management Industry Analysis, Insights and Forecast, 2020-2032
- 9.1. Market Analysis, Insights and Forecast - by Waste Type
- 9.1.1. Industrial Waste
- 9.1.2. Municipal Solid Waste
- 9.1.3. Hazardous Waste
- 9.1.4. E-Waste
- 9.1.5. Plastic Waste
- 9.1.6. Bio-Medical Waste
- 9.2. Market Analysis, Insights and Forecast - by Disposal Method
- 9.2.1. Collection
- 9.2.2. Landfills
- 9.2.3. Incineration
- 9.2.4. Recycling
- 9.1. Market Analysis, Insights and Forecast - by Waste Type
- 10. Middle East & Africa GCC Waste Management Industry Analysis, Insights and Forecast, 2020-2032
- 10.1. Market Analysis, Insights and Forecast - by Waste Type
- 10.1.1. Industrial Waste
- 10.1.2. Municipal Solid Waste
- 10.1.3. Hazardous Waste
- 10.1.4. E-Waste
- 10.1.5. Plastic Waste
- 10.1.6. Bio-Medical Waste
- 10.2. Market Analysis, Insights and Forecast - by Disposal Method
- 10.2.1. Collection
- 10.2.2. Landfills
- 10.2.3. Incineration
- 10.2.4. Recycling
- 10.1. Market Analysis, Insights and Forecast - by Waste Type
- 11. Asia Pacific GCC Waste Management Industry Analysis, Insights and Forecast, 2020-2032
- 11.1. Market Analysis, Insights and Forecast - by Waste Type
- 11.1.1. Industrial Waste
- 11.1.2. Municipal Solid Waste
- 11.1.3. Hazardous Waste
- 11.1.4. E-Waste
- 11.1.5. Plastic Waste
- 11.1.6. Bio-Medical Waste
- 11.2. Market Analysis, Insights and Forecast - by Disposal Method
- 11.2.1. Collection
- 11.2.2. Landfills
- 11.2.3. Incineration
- 11.2.4. Recycling
- 11.1. Market Analysis, Insights and Forecast - by Waste Type
- 12. Competitive Analysis
- 12.1. Company Profiles
- 12.1.1 Averda
- 12.1.1.1. Company Overview
- 12.1.1.2. Products
- 12.1.1.3. Company Financials
- 12.1.1.4. SWOT Analysis
- 12.1.2 EnviroServe
- 12.1.2.1. Company Overview
- 12.1.2.2. Products
- 12.1.2.3. Company Financials
- 12.1.2.4. SWOT Analysis
- 12.1.3 Suez Middle East Recycling LLC
- 12.1.3.1. Company Overview
- 12.1.3.2. Products
- 12.1.3.3. Company Financials
- 12.1.3.4. SWOT Analysis
- 12.1.4 Green Mountains
- 12.1.4.1. Company Overview
- 12.1.4.2. Products
- 12.1.4.3. Company Financials
- 12.1.4.4. SWOT Analysis
- 12.1.5 Veolia
- 12.1.5.1. Company Overview
- 12.1.5.2. Products
- 12.1.5.3. Company Financials
- 12.1.5.4. SWOT Analysis
- 12.1.6 Blue LLC
- 12.1.6.1. Company Overview
- 12.1.6.2. Products
- 12.1.6.3. Company Financials
- 12.1.6.4. SWOT Analysis
- 12.1.7 Envac
- 12.1.7.1. Company Overview
- 12.1.7.2. Products
- 12.1.7.3. Company Financials
- 12.1.7.4. SWOT Analysis
- 12.1.8 SEPCO Environment
- 12.1.8.1. Company Overview
- 12.1.8.2. Products
- 12.1.8.3. Company Financials
- 12.1.8.4. SWOT Analysis
- 12.1.9 Wasco
- 12.1.9.1. Company Overview
- 12.1.9.2. Products
- 12.1.9.3. Company Financials
- 12.1.9.4. SWOT Analysis
- 12.1.10 Saudi Investment Recycling Company
- 12.1.10.1. Company Overview
- 12.1.10.2. Products
- 12.1.10.3. Company Financials
- 12.1.10.4. SWOT Analysis
- 12.1.11 Dulsco Waste Management Services
- 12.1.11.1. Company Overview
- 12.1.11.2. Products
- 12.1.11.3. Company Financials
- 12.1.11.4. SWOT Analysis
- 12.1.12 Bee'ah
- 12.1.12.1. Company Overview
- 12.1.12.2. Products
- 12.1.12.3. Company Financials
- 12.1.12.4. SWOT Analysis
- 12.1.13 Power Waste Management and Transport LLC
- 12.1.13.1. Company Overview
- 12.1.13.2. Products
- 12.1.13.3. Company Financials
- 12.1.13.4. SWOT Analysis
- 12.1.14 Al Haya Enviro
- 12.1.14.1. Company Overview
- 12.1.14.2. Products
- 12.1.14.3. Company Financials
- 12.1.14.4. SWOT Analysis
- 12.1.15 Bin-Ovation
- 12.1.15.1. Company Overview
- 12.1.15.2. Products
- 12.1.15.3. Company Financials
- 12.1.15.4. SWOT Analysis
- 12.1.16 United Waste Management Company
- 12.1.16.1. Company Overview
- 12.1.16.2. Products
- 12.1.16.3. Company Financials
- 12.1.16.4. SWOT Analysis
- 12.1.17 Kuwait Waste Collection and Recycling Company**List Not Exhaustive
- 12.1.17.1. Company Overview
- 12.1.17.2. Products
- 12.1.17.3. Company Financials
- 12.1.17.4. SWOT Analysis
- 12.1.1 Averda
- 12.2. Market Entropy
- 12.2.1 Company's Key Areas Served
- 12.2.2 Recent Developments
- 12.3. Company Market Share Analysis 2025
- 12.3.1 Top 5 Companies Market Share Analysis
- 12.3.2 Top 3 Companies Market Share Analysis
- 12.4. List of Potential Customers
- 13. Research Methodology
List of Figures
- Figure 1: Global GCC Waste Management Industry Revenue Breakdown (Million, %) by Region 2025 & 2033
- Figure 2: Global GCC Waste Management Industry Volume Breakdown (Billion, %) by Region 2025 & 2033
- Figure 3: North America GCC Waste Management Industry Revenue (Million), by Waste Type 2025 & 2033
- Figure 4: North America GCC Waste Management Industry Volume (Billion), by Waste Type 2025 & 2033
- Figure 5: North America GCC Waste Management Industry Revenue Share (%), by Waste Type 2025 & 2033
- Figure 6: North America GCC Waste Management Industry Volume Share (%), by Waste Type 2025 & 2033
- Figure 7: North America GCC Waste Management Industry Revenue (Million), by Disposal Method 2025 & 2033
- Figure 8: North America GCC Waste Management Industry Volume (Billion), by Disposal Method 2025 & 2033
- Figure 9: North America GCC Waste Management Industry Revenue Share (%), by Disposal Method 2025 & 2033
- Figure 10: North America GCC Waste Management Industry Volume Share (%), by Disposal Method 2025 & 2033
- Figure 11: North America GCC Waste Management Industry Revenue (Million), by Country 2025 & 2033
- Figure 12: North America GCC Waste Management Industry Volume (Billion), by Country 2025 & 2033
- Figure 13: North America GCC Waste Management Industry Revenue Share (%), by Country 2025 & 2033
- Figure 14: North America GCC Waste Management Industry Volume Share (%), by Country 2025 & 2033
- Figure 15: South America GCC Waste Management Industry Revenue (Million), by Waste Type 2025 & 2033
- Figure 16: South America GCC Waste Management Industry Volume (Billion), by Waste Type 2025 & 2033
- Figure 17: South America GCC Waste Management Industry Revenue Share (%), by Waste Type 2025 & 2033
- Figure 18: South America GCC Waste Management Industry Volume Share (%), by Waste Type 2025 & 2033
- Figure 19: South America GCC Waste Management Industry Revenue (Million), by Disposal Method 2025 & 2033
- Figure 20: South America GCC Waste Management Industry Volume (Billion), by Disposal Method 2025 & 2033
- Figure 21: South America GCC Waste Management Industry Revenue Share (%), by Disposal Method 2025 & 2033
- Figure 22: South America GCC Waste Management Industry Volume Share (%), by Disposal Method 2025 & 2033
- Figure 23: South America GCC Waste Management Industry Revenue (Million), by Country 2025 & 2033
- Figure 24: South America GCC Waste Management Industry Volume (Billion), by Country 2025 & 2033
- Figure 25: South America GCC Waste Management Industry Revenue Share (%), by Country 2025 & 2033
- Figure 26: South America GCC Waste Management Industry Volume Share (%), by Country 2025 & 2033
- Figure 27: Europe GCC Waste Management Industry Revenue (Million), by Waste Type 2025 & 2033
- Figure 28: Europe GCC Waste Management Industry Volume (Billion), by Waste Type 2025 & 2033
- Figure 29: Europe GCC Waste Management Industry Revenue Share (%), by Waste Type 2025 & 2033
- Figure 30: Europe GCC Waste Management Industry Volume Share (%), by Waste Type 2025 & 2033
- Figure 31: Europe GCC Waste Management Industry Revenue (Million), by Disposal Method 2025 & 2033
- Figure 32: Europe GCC Waste Management Industry Volume (Billion), by Disposal Method 2025 & 2033
- Figure 33: Europe GCC Waste Management Industry Revenue Share (%), by Disposal Method 2025 & 2033
- Figure 34: Europe GCC Waste Management Industry Volume Share (%), by Disposal Method 2025 & 2033
- Figure 35: Europe GCC Waste Management Industry Revenue (Million), by Country 2025 & 2033
- Figure 36: Europe GCC Waste Management Industry Volume (Billion), by Country 2025 & 2033
- Figure 37: Europe GCC Waste Management Industry Revenue Share (%), by Country 2025 & 2033
- Figure 38: Europe GCC Waste Management Industry Volume Share (%), by Country 2025 & 2033
- Figure 39: Middle East & Africa GCC Waste Management Industry Revenue (Million), by Waste Type 2025 & 2033
- Figure 40: Middle East & Africa GCC Waste Management Industry Volume (Billion), by Waste Type 2025 & 2033
- Figure 41: Middle East & Africa GCC Waste Management Industry Revenue Share (%), by Waste Type 2025 & 2033
- Figure 42: Middle East & Africa GCC Waste Management Industry Volume Share (%), by Waste Type 2025 & 2033
- Figure 43: Middle East & Africa GCC Waste Management Industry Revenue (Million), by Disposal Method 2025 & 2033
- Figure 44: Middle East & Africa GCC Waste Management Industry Volume (Billion), by Disposal Method 2025 & 2033
- Figure 45: Middle East & Africa GCC Waste Management Industry Revenue Share (%), by Disposal Method 2025 & 2033
- Figure 46: Middle East & Africa GCC Waste Management Industry Volume Share (%), by Disposal Method 2025 & 2033
- Figure 47: Middle East & Africa GCC Waste Management Industry Revenue (Million), by Country 2025 & 2033
- Figure 48: Middle East & Africa GCC Waste Management Industry Volume (Billion), by Country 2025 & 2033
- Figure 49: Middle East & Africa GCC Waste Management Industry Revenue Share (%), by Country 2025 & 2033
- Figure 50: Middle East & Africa GCC Waste Management Industry Volume Share (%), by Country 2025 & 2033
- Figure 51: Asia Pacific GCC Waste Management Industry Revenue (Million), by Waste Type 2025 & 2033
- Figure 52: Asia Pacific GCC Waste Management Industry Volume (Billion), by Waste Type 2025 & 2033
- Figure 53: Asia Pacific GCC Waste Management Industry Revenue Share (%), by Waste Type 2025 & 2033
- Figure 54: Asia Pacific GCC Waste Management Industry Volume Share (%), by Waste Type 2025 & 2033
- Figure 55: Asia Pacific GCC Waste Management Industry Revenue (Million), by Disposal Method 2025 & 2033
- Figure 56: Asia Pacific GCC Waste Management Industry Volume (Billion), by Disposal Method 2025 & 2033
- Figure 57: Asia Pacific GCC Waste Management Industry Revenue Share (%), by Disposal Method 2025 & 2033
- Figure 58: Asia Pacific GCC Waste Management Industry Volume Share (%), by Disposal Method 2025 & 2033
- Figure 59: Asia Pacific GCC Waste Management Industry Revenue (Million), by Country 2025 & 2033
- Figure 60: Asia Pacific GCC Waste Management Industry Volume (Billion), by Country 2025 & 2033
- Figure 61: Asia Pacific GCC Waste Management Industry Revenue Share (%), by Country 2025 & 2033
- Figure 62: Asia Pacific GCC Waste Management Industry Volume Share (%), by Country 2025 & 2033
List of Tables
- Table 1: Global GCC Waste Management Industry Revenue Million Forecast, by Waste Type 2020 & 2033
- Table 2: Global GCC Waste Management Industry Volume Billion Forecast, by Waste Type 2020 & 2033
- Table 3: Global GCC Waste Management Industry Revenue Million Forecast, by Disposal Method 2020 & 2033
- Table 4: Global GCC Waste Management Industry Volume Billion Forecast, by Disposal Method 2020 & 2033
- Table 5: Global GCC Waste Management Industry Revenue Million Forecast, by Region 2020 & 2033
- Table 6: Global GCC Waste Management Industry Volume Billion Forecast, by Region 2020 & 2033
- Table 7: Global GCC Waste Management Industry Revenue Million Forecast, by Waste Type 2020 & 2033
- Table 8: Global GCC Waste Management Industry Volume Billion Forecast, by Waste Type 2020 & 2033
- Table 9: Global GCC Waste Management Industry Revenue Million Forecast, by Disposal Method 2020 & 2033
- Table 10: Global GCC Waste Management Industry Volume Billion Forecast, by Disposal Method 2020 & 2033
- Table 11: Global GCC Waste Management Industry Revenue Million Forecast, by Country 2020 & 2033
- Table 12: Global GCC Waste Management Industry Volume Billion Forecast, by Country 2020 & 2033
- Table 13: United States GCC Waste Management Industry Revenue (Million) Forecast, by Application 2020 & 2033
- Table 14: United States GCC Waste Management Industry Volume (Billion) Forecast, by Application 2020 & 2033
- Table 15: Canada GCC Waste Management Industry Revenue (Million) Forecast, by Application 2020 & 2033
- Table 16: Canada GCC Waste Management Industry Volume (Billion) Forecast, by Application 2020 & 2033
- Table 17: Mexico GCC Waste Management Industry Revenue (Million) Forecast, by Application 2020 & 2033
- Table 18: Mexico GCC Waste Management Industry Volume (Billion) Forecast, by Application 2020 & 2033
- Table 19: Global GCC Waste Management Industry Revenue Million Forecast, by Waste Type 2020 & 2033
- Table 20: Global GCC Waste Management Industry Volume Billion Forecast, by Waste Type 2020 & 2033
- Table 21: Global GCC Waste Management Industry Revenue Million Forecast, by Disposal Method 2020 & 2033
- Table 22: Global GCC Waste Management Industry Volume Billion Forecast, by Disposal Method 2020 & 2033
- Table 23: Global GCC Waste Management Industry Revenue Million Forecast, by Country 2020 & 2033
- Table 24: Global GCC Waste Management Industry Volume Billion Forecast, by Country 2020 & 2033
- Table 25: Brazil GCC Waste Management Industry Revenue (Million) Forecast, by Application 2020 & 2033
- Table 26: Brazil GCC Waste Management Industry Volume (Billion) Forecast, by Application 2020 & 2033
- Table 27: Argentina GCC Waste Management Industry Revenue (Million) Forecast, by Application 2020 & 2033
- Table 28: Argentina GCC Waste Management Industry Volume (Billion) Forecast, by Application 2020 & 2033
- Table 29: Rest of South America GCC Waste Management Industry Revenue (Million) Forecast, by Application 2020 & 2033
- Table 30: Rest of South America GCC Waste Management Industry Volume (Billion) Forecast, by Application 2020 & 2033
- Table 31: Global GCC Waste Management Industry Revenue Million Forecast, by Waste Type 2020 & 2033
- Table 32: Global GCC Waste Management Industry Volume Billion Forecast, by Waste Type 2020 & 2033
- Table 33: Global GCC Waste Management Industry Revenue Million Forecast, by Disposal Method 2020 & 2033
- Table 34: Global GCC Waste Management Industry Volume Billion Forecast, by Disposal Method 2020 & 2033
- Table 35: Global GCC Waste Management Industry Revenue Million Forecast, by Country 2020 & 2033
- Table 36: Global GCC Waste Management Industry Volume Billion Forecast, by Country 2020 & 2033
- Table 37: United Kingdom GCC Waste Management Industry Revenue (Million) Forecast, by Application 2020 & 2033
- Table 38: United Kingdom GCC Waste Management Industry Volume (Billion) Forecast, by Application 2020 & 2033
- Table 39: Germany GCC Waste Management Industry Revenue (Million) Forecast, by Application 2020 & 2033
- Table 40: Germany GCC Waste Management Industry Volume (Billion) Forecast, by Application 2020 & 2033
- Table 41: France GCC Waste Management Industry Revenue (Million) Forecast, by Application 2020 & 2033
- Table 42: France GCC Waste Management Industry Volume (Billion) Forecast, by Application 2020 & 2033
- Table 43: Italy GCC Waste Management Industry Revenue (Million) Forecast, by Application 2020 & 2033
- Table 44: Italy GCC Waste Management Industry Volume (Billion) Forecast, by Application 2020 & 2033
- Table 45: Spain GCC Waste Management Industry Revenue (Million) Forecast, by Application 2020 & 2033
- Table 46: Spain GCC Waste Management Industry Volume (Billion) Forecast, by Application 2020 & 2033
- Table 47: Russia GCC Waste Management Industry Revenue (Million) Forecast, by Application 2020 & 2033
- Table 48: Russia GCC Waste Management Industry Volume (Billion) Forecast, by Application 2020 & 2033
- Table 49: Benelux GCC Waste Management Industry Revenue (Million) Forecast, by Application 2020 & 2033
- Table 50: Benelux GCC Waste Management Industry Volume (Billion) Forecast, by Application 2020 & 2033
- Table 51: Nordics GCC Waste Management Industry Revenue (Million) Forecast, by Application 2020 & 2033
- Table 52: Nordics GCC Waste Management Industry Volume (Billion) Forecast, by Application 2020 & 2033
- Table 53: Rest of Europe GCC Waste Management Industry Revenue (Million) Forecast, by Application 2020 & 2033
- Table 54: Rest of Europe GCC Waste Management Industry Volume (Billion) Forecast, by Application 2020 & 2033
- Table 55: Global GCC Waste Management Industry Revenue Million Forecast, by Waste Type 2020 & 2033
- Table 56: Global GCC Waste Management Industry Volume Billion Forecast, by Waste Type 2020 & 2033
- Table 57: Global GCC Waste Management Industry Revenue Million Forecast, by Disposal Method 2020 & 2033
- Table 58: Global GCC Waste Management Industry Volume Billion Forecast, by Disposal Method 2020 & 2033
- Table 59: Global GCC Waste Management Industry Revenue Million Forecast, by Country 2020 & 2033
- Table 60: Global GCC Waste Management Industry Volume Billion Forecast, by Country 2020 & 2033
- Table 61: Turkey GCC Waste Management Industry Revenue (Million) Forecast, by Application 2020 & 2033
- Table 62: Turkey GCC Waste Management Industry Volume (Billion) Forecast, by Application 2020 & 2033
- Table 63: Israel GCC Waste Management Industry Revenue (Million) Forecast, by Application 2020 & 2033
- Table 64: Israel GCC Waste Management Industry Volume (Billion) Forecast, by Application 2020 & 2033
- Table 65: GCC GCC Waste Management Industry Revenue (Million) Forecast, by Application 2020 & 2033
- Table 66: GCC GCC Waste Management Industry Volume (Billion) Forecast, by Application 2020 & 2033
- Table 67: North Africa GCC Waste Management Industry Revenue (Million) Forecast, by Application 2020 & 2033
- Table 68: North Africa GCC Waste Management Industry Volume (Billion) Forecast, by Application 2020 & 2033
- Table 69: South Africa GCC Waste Management Industry Revenue (Million) Forecast, by Application 2020 & 2033
- Table 70: South Africa GCC Waste Management Industry Volume (Billion) Forecast, by Application 2020 & 2033
- Table 71: Rest of Middle East & Africa GCC Waste Management Industry Revenue (Million) Forecast, by Application 2020 & 2033
- Table 72: Rest of Middle East & Africa GCC Waste Management Industry Volume (Billion) Forecast, by Application 2020 & 2033
- Table 73: Global GCC Waste Management Industry Revenue Million Forecast, by Waste Type 2020 & 2033
- Table 74: Global GCC Waste Management Industry Volume Billion Forecast, by Waste Type 2020 & 2033
- Table 75: Global GCC Waste Management Industry Revenue Million Forecast, by Disposal Method 2020 & 2033
- Table 76: Global GCC Waste Management Industry Volume Billion Forecast, by Disposal Method 2020 & 2033
- Table 77: Global GCC Waste Management Industry Revenue Million Forecast, by Country 2020 & 2033
- Table 78: Global GCC Waste Management Industry Volume Billion Forecast, by Country 2020 & 2033
- Table 79: China GCC Waste Management Industry Revenue (Million) Forecast, by Application 2020 & 2033
- Table 80: China GCC Waste Management Industry Volume (Billion) Forecast, by Application 2020 & 2033
- Table 81: India GCC Waste Management Industry Revenue (Million) Forecast, by Application 2020 & 2033
- Table 82: India GCC Waste Management Industry Volume (Billion) Forecast, by Application 2020 & 2033
- Table 83: Japan GCC Waste Management Industry Revenue (Million) Forecast, by Application 2020 & 2033
- Table 84: Japan GCC Waste Management Industry Volume (Billion) Forecast, by Application 2020 & 2033
- Table 85: South Korea GCC Waste Management Industry Revenue (Million) Forecast, by Application 2020 & 2033
- Table 86: South Korea GCC Waste Management Industry Volume (Billion) Forecast, by Application 2020 & 2033
- Table 87: ASEAN GCC Waste Management Industry Revenue (Million) Forecast, by Application 2020 & 2033
- Table 88: ASEAN GCC Waste Management Industry Volume (Billion) Forecast, by Application 2020 & 2033
- Table 89: Oceania GCC Waste Management Industry Revenue (Million) Forecast, by Application 2020 & 2033
- Table 90: Oceania GCC Waste Management Industry Volume (Billion) Forecast, by Application 2020 & 2033
- Table 91: Rest of Asia Pacific GCC Waste Management Industry Revenue (Million) Forecast, by Application 2020 & 2033
- Table 92: Rest of Asia Pacific GCC Waste Management Industry Volume (Billion) Forecast, by Application 2020 & 2033
Frequently Asked Questions
1. What is the projected Compound Annual Growth Rate (CAGR) of the GCC Waste Management Industry?
The projected CAGR is approximately 7.38%.
2. Which companies are prominent players in the GCC Waste Management Industry?
Key companies in the market include Averda, EnviroServe, Suez Middle East Recycling LLC, Green Mountains, Veolia, Blue LLC, Envac, SEPCO Environment, Wasco, Saudi Investment Recycling Company, Dulsco Waste Management Services, Bee'ah, Power Waste Management and Transport LLC, Al Haya Enviro, Bin-Ovation, United Waste Management Company, Kuwait Waste Collection and Recycling Company**List Not Exhaustive.
3. What are the main segments of the GCC Waste Management Industry?
The market segments include Waste Type, Disposal Method.
4. Can you provide details about the market size?
The market size is estimated to be USD 63.56 Million as of 2022.
5. What are some drivers contributing to market growth?
4.; Increasing demand for mining waste co-disposable.
6. What are the notable trends driving market growth?
Increasing E-waste Generation in Gulf Cooperation Council Region.
7. Are there any restraints impacting market growth?
4.; Increasing demand for mining waste co-disposable.
8. Can you provide examples of recent developments in the market?
December 2023: Electric mobility firm Wardwizard Innovations and Mobility entered into an agreement with the Sharjah Government co-owned sustainable waste management company BEEAH Group (BG) for the manufacturing of electric vehicles. Under this collaboration, Wardwizard Innovations and Mobility, along with BEEAH Group, will jointly promote electric vehicles in GCC nations and the African region.
9. What pricing options are available for accessing the report?
Pricing options include single-user, multi-user, and enterprise licenses priced at USD 3800, USD 4500, and USD 5800 respectively.
10. Is the market size provided in terms of value or volume?
The market size is provided in terms of value, measured in Million and volume, measured in Billion.
11. Are there any specific market keywords associated with the report?
Yes, the market keyword associated with the report is "GCC Waste Management Industry," which aids in identifying and referencing the specific market segment covered.
12. How do I determine which pricing option suits my needs best?
The pricing options vary based on user requirements and access needs. Individual users may opt for single-user licenses, while businesses requiring broader access may choose multi-user or enterprise licenses for cost-effective access to the report.
13. Are there any additional resources or data provided in the GCC Waste Management Industry report?
While the report offers comprehensive insights, it's advisable to review the specific contents or supplementary materials provided to ascertain if additional resources or data are available.
14. How can I stay updated on further developments or reports in the GCC Waste Management Industry?
To stay informed about further developments, trends, and reports in the GCC Waste Management Industry, consider subscribing to industry newsletters, following relevant companies and organizations, or regularly checking reputable industry news sources and publications.
Methodology
Step 1 - Identification of Relevant Samples Size from Population Database


Step 2 - Approaches for Defining Global Market Size (Value, Volume* & Price*)

Note*: In applicable scenarios
Step 3 - Data Sources
Primary Research
- Web Analytics
- Survey Reports
- Research Institute
- Latest Research Reports
- Opinion Leaders
Secondary Research
- Annual Reports
- White Paper
- Latest Press Release
- Industry Association
- Paid Database
- Investor Presentations

Step 4 - Data Triangulation
Involves using different sources of information in order to increase the validity of a study
These sources are likely to be stakeholders in a program - participants, other researchers, program staff, other community members, and so on.
Then we put all data in single framework & apply various statistical tools to find out the dynamic on the market.
During the analysis stage, feedback from the stakeholder groups would be compared to determine areas of agreement as well as areas of divergence