

Key Insights
The global Network Performance Monitoring (NPM) tool market is experiencing robust expansion, projected to reach a significant valuation of approximately $10,500 million by 2025. This growth is fueled by an estimated Compound Annual Growth Rate (CAGR) of 8.5% over the forecast period extending to 2033, indicating sustained momentum. The increasing complexity of modern IT infrastructures, characterized by hybrid and multi-cloud environments, the proliferation of IoT devices, and the growing demand for real-time data analytics, are primary drivers. Organizations are increasingly reliant on seamless network operations for critical business functions, making proactive monitoring and performance optimization paramount. This imperative is driving adoption of advanced NPM solutions that offer comprehensive visibility, intelligent anomaly detection, and automated remediation capabilities. The market caters to a diverse range of customers, with both large enterprises and Small and Medium-sized Enterprises (SMEs) recognizing the indispensable role of effective network management.
Cloud-based NPM solutions are witnessing accelerated adoption due to their inherent scalability, flexibility, and cost-effectiveness, allowing businesses to adapt swiftly to evolving IT landscapes. While on-premises solutions continue to hold relevance for organizations with specific security or regulatory compliance needs, the trend clearly favors cloud-native architectures. Key market restraints, however, include the high initial investment for comprehensive NPM deployments and the shortage of skilled IT professionals capable of managing and interpreting the data generated by these sophisticated tools. Despite these challenges, the relentless digital transformation across industries, coupled with the ever-present threat of cyberattacks and the need for uninterrupted service delivery, ensures a bright future for the Network Performance Monitoring Tool market. Leading players like SolarWinds, LogicMonitor, Auvik Networks, and Splunk are continually innovating to offer more integrated and intelligent solutions, further shaping market dynamics.
Network Performance Monitoring Tool Market Dynamics & Structure
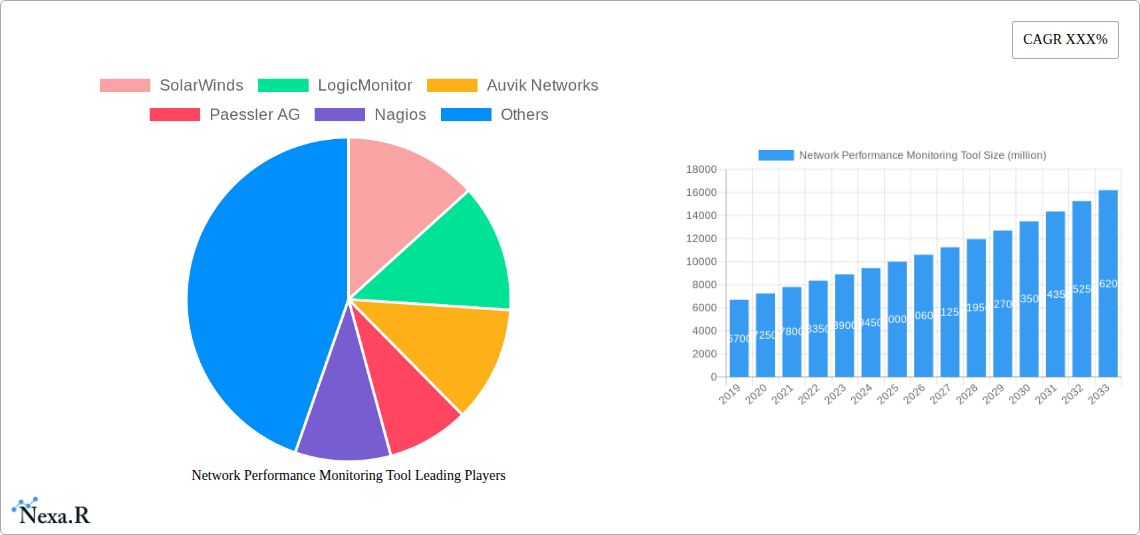
The global Network Performance Monitoring (NPM) tool market is characterized by a dynamic competitive landscape with a moderate level of concentration. Key players like SolarWinds, LogicMonitor, and Auvik Networks are vying for market share, driven by continuous technological innovation and the increasing complexity of enterprise networks. Regulatory frameworks, while not overtly restrictive, often necessitate adherence to industry standards for data security and privacy, indirectly influencing product development. Competitive product substitutes, such as broader IT infrastructure management suites, present a challenge, but specialized NPM solutions offer deeper insights. End-user demographics span from Large Enterprises, accounting for approximately 65% of the market, to SMEs, comprising the remaining 35%. Mergers and acquisitions (M&A) are a significant trend, with an estimated 15-20 M&A deals occurring annually, aimed at consolidating market presence and acquiring innovative technologies. For instance, the acquisition of a niche AI-driven anomaly detection company by a major NPM vendor in 2023 significantly boosted its capabilities. Barriers to innovation primarily revolve around the high cost of research and development for advanced analytics, the need for skilled personnel, and the challenge of integrating with diverse legacy systems.
- Market Concentration: Moderate, with top 5 players holding approximately 55% of the market share.
- Technological Innovation Drivers: AI/ML for predictive analytics, real-time traffic analysis, cloud-native monitoring, and IoT network visibility.
- Regulatory Frameworks: Focus on data privacy (e.g., GDPR, CCPA) and cybersecurity compliance, impacting data handling features.
- Competitive Product Substitutes: Comprehensive IT infrastructure monitoring platforms, cybersecurity solutions with basic monitoring capabilities.
- End-User Demographics: Large Enterprises (65% market share), SMEs (35% market share).
- M&A Trends: An average of 15-20 deals per year, driven by technology acquisition and market consolidation.
Network Performance Monitoring Tool Growth Trends & Insights
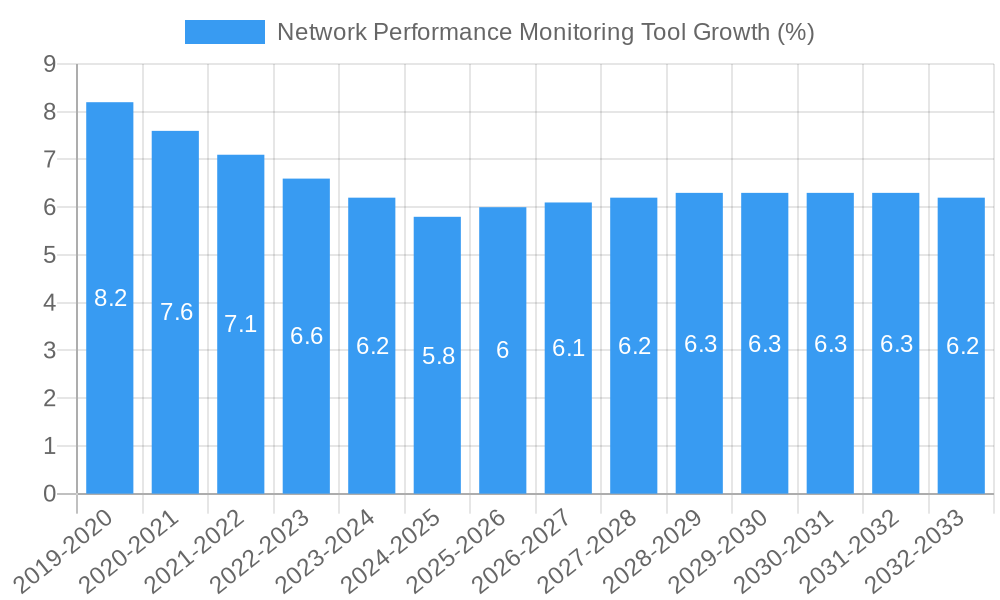
The Network Performance Monitoring (NPM) tool market is projected for substantial growth, driven by an escalating demand for resilient and high-performing digital infrastructures. The market size, estimated at $7.2 billion in 2024, is anticipated to expand to $15.5 billion by 2033, exhibiting a Compound Annual Growth Rate (CAGR) of approximately 8.9%. This trajectory is fueled by the pervasive adoption of cloud-based services, the proliferation of the Internet of Things (IoT), and the increasing reliance on complex hybrid network environments by organizations of all sizes. The shift towards cloud-based NPM solutions, projected to capture over 70% of the market by 2033, is a significant trend, offering scalability, flexibility, and reduced operational overhead for businesses. Conversely, on-premises solutions, while still relevant for highly regulated industries or specific security requirements, are expected to see a slower growth rate.
Technological disruptions are rapidly reshaping the NPM landscape. The integration of Artificial Intelligence (AI) and Machine Learning (ML) algorithms is a key differentiator, enabling predictive analytics, automated root cause analysis, and proactive issue resolution, thereby minimizing downtime and enhancing user experience. This advanced analytics capability is becoming a critical factor for large enterprises that manage vast and intricate networks. Consumer behavior shifts are also playing a pivotal role. IT departments are increasingly prioritizing solutions that offer comprehensive visibility across the entire network stack, from the edge to the cloud, and from applications to end-users. This demand for unified visibility is pushing vendors to develop integrated platforms rather than standalone tools. The market penetration of advanced NPM solutions is expected to reach 75% among large enterprises and 50% among SMEs by 2033.
The growing adoption of Software-Defined Networking (SDN) and Network Functions Virtualization (NFV) necessitates sophisticated monitoring tools capable of handling dynamic and virtualized network environments. NPM solutions are evolving to provide granular visibility into these complex architectures. Furthermore, the increasing sophistication of cyber threats requires NPM tools to not only monitor performance but also detect anomalous behavior that could indicate a security breach. This convergence of performance monitoring and security analytics is a key trend. The global market for NPM tools is expected to be valued at $8.1 billion in 2025, with a projected CAGR of 8.9% from 2025 to 2033, reaching an estimated $15.5 billion by the end of the forecast period. The historical market size from 2019 to 2024 shows a steady upward trend, indicating a consistent demand for these solutions.
Dominant Regions, Countries, or Segments in Network Performance Monitoring Tool
The global Network Performance Monitoring (NPM) tool market is experiencing significant growth, with Cloud-Based deployment models emerging as the dominant force, particularly within the Large Enterprises segment. This dominance is underpinned by several interconnected factors, including the inherent scalability, cost-effectiveness, and agility offered by cloud infrastructure, which align perfectly with the complex and rapidly evolving network demands of large organizations. The global market for NPM tools is projected for robust expansion, with the cloud-based segment expected to represent approximately 70% of the total market share by 2033.
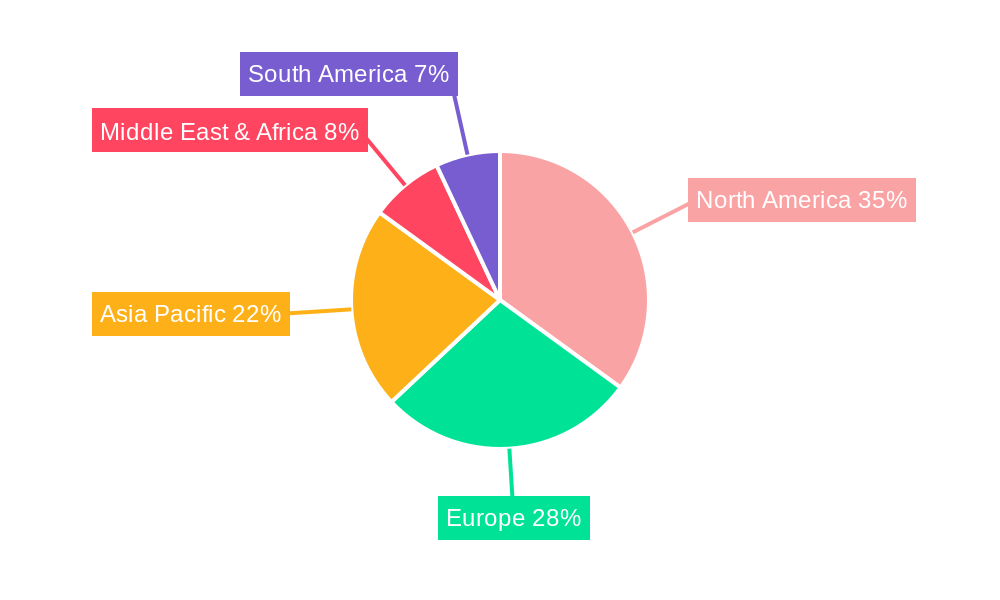
The North America region currently holds the largest market share, estimated at around 35%, driven by its mature IT infrastructure, high adoption of advanced technologies, and the presence of numerous large enterprises. The United States, in particular, is a key contributor, with significant investments in digital transformation and cloud migration strategies. This economic environment fosters a continuous demand for sophisticated NPM solutions that can ensure the reliability and performance of critical business operations.
For Large Enterprises, the adoption of cloud-based NPM solutions is driven by the need for seamless monitoring of hybrid and multi-cloud environments. These organizations manage vast networks spanning data centers, branch offices, and public cloud platforms, making on-premises solutions impractical and cost-prohibitive. Cloud-based NPM tools provide centralized visibility and control, enabling IT teams to manage network performance proactively across dispersed locations. The market share of cloud-based NPM solutions within the Large Enterprise segment is projected to exceed 75% by 2033.
Key drivers for this dominance include:
- Economic Policies: Favorable government initiatives promoting digital transformation and cloud adoption in key regions like North America and Europe.
- Infrastructure: Highly developed digital infrastructure, including widespread broadband penetration and robust data center capabilities, supports the widespread use of cloud services.
- Technological Advancements: Continuous innovation in AI/ML for network analytics and the increasing adoption of IoT devices, which require constant performance oversight.
- Scalability and Flexibility: Cloud-based NPM solutions can easily scale up or down to meet fluctuating business needs, offering unparalleled flexibility for large enterprises.
- Cost Efficiency: Reduced capital expenditure on hardware and software, coupled with a predictable subscription-based pricing model, makes cloud solutions attractive.
- Remote Work Trends: The ongoing shift towards remote and hybrid work models necessitates robust network performance and visibility, driving demand for accessible, cloud-based monitoring tools.
While SMEs also contribute to market growth, their adoption patterns often differ. SMEs may favor cloud-based solutions for their ease of deployment and management, but budget constraints can sometimes lead to a preference for more cost-effective on-premises or hybrid models. However, the growing realization of the importance of network uptime and performance for business continuity is increasingly driving SMEs towards scalable cloud solutions as well. The overall growth potential for cloud-based NPM tools remains exceptionally high across both segments, solidifying its position as the leading deployment type in the market.
Network Performance Monitoring Tool Product Landscape
The Network Performance Monitoring (NPM) tool product landscape is defined by its continuous evolution towards smarter, more integrated, and user-centric solutions. Vendors are heavily investing in AI and machine learning capabilities to enable predictive analytics, automated anomaly detection, and intelligent root cause analysis, moving beyond traditional reactive monitoring. Key innovations include real-time traffic analysis, deep packet inspection for granular application performance insights, and broad coverage of diverse network environments, including physical, virtual, cloud, and hybrid infrastructures. Performance metrics are increasingly sophisticated, focusing on user experience, application availability, and proactive identification of potential bottlenecks before they impact end-users. Unique selling propositions often lie in the depth of visibility, the accuracy of predictive insights, and the seamless integration with other IT management tools, such as ITSM and security information and event management (SIEM) systems.
Key Drivers, Barriers & Challenges in Network Performance Monitoring Tool
The Network Performance Monitoring (NPM) tool market is propelled by several key drivers, including the accelerating digital transformation across industries, the burgeoning adoption of cloud computing and hybrid environments, and the increasing demand for enhanced user experience and application performance. The proliferation of IoT devices and the growing complexity of enterprise networks also necessitate robust monitoring capabilities. Technological advancements, particularly in AI/ML for predictive analytics and automation, are further fueling market growth.
However, the market faces several significant barriers and challenges. The high cost of implementing and maintaining advanced NPM solutions, especially for SMEs, can be a restraint. The complexity of integrating new tools with existing legacy systems is another hurdle. Furthermore, a shortage of skilled IT professionals capable of effectively utilizing and managing these sophisticated tools poses a challenge. Supply chain disruptions, though less impactful for software, can indirectly affect hardware-dependent monitoring solutions. Regulatory compliance, particularly around data privacy and security, adds a layer of complexity to product development and deployment. Competitive pressures from broader IT management suites that offer basic monitoring functionalities also represent a challenge.
Emerging Opportunities in Network Performance Monitoring Tool
Emerging opportunities in the Network Performance Monitoring (NPM) tool market lie in the increasing demand for AI-powered network observability and intent-based networking solutions. The growing adoption of 5G technology presents a significant untapped market for specialized NPM tools designed to monitor the performance of these high-speed, low-latency networks. Furthermore, the convergence of NPM with cybersecurity solutions, offering integrated security and performance monitoring, is a burgeoning trend. The expansion of NPM tools into emerging markets and the development of specialized solutions for niche industries like healthcare and manufacturing, which have unique network performance requirements, also represent significant growth avenues. Evolving consumer preferences for seamless digital experiences are driving the need for proactive performance management across all service delivery layers.
Growth Accelerators in the Network Performance Monitoring Tool Industry
Several growth accelerators are poised to propel the Network Performance Monitoring (NPM) tool industry forward. The continuous advancement and widespread adoption of Artificial Intelligence and Machine Learning (AI/ML) algorithms for predictive analytics and automated troubleshooting are a primary catalyst. The increasing complexity and heterogeneity of modern IT infrastructures, including hybrid and multi-cloud environments, demand sophisticated monitoring solutions, thereby accelerating market growth. Strategic partnerships between NPM vendors and cloud providers, as well as with cybersecurity firms, are creating integrated ecosystems and expanding market reach. Furthermore, market expansion strategies targeting underserved regions and the development of specialized NPM solutions tailored to specific industry verticals will continue to drive adoption and revenue growth.
Key Players Shaping the Network Performance Monitoring Tool Market
- SolarWinds
- LogicMonitor
- Auvik Networks
- Paessler AG
- Nagios
- Zabbix
- Progress
- Cisco Systems
- Splunk
- ManageEngine
- HelpSystems
- Icinga
- Aterlo Networks
- NETSCOUT SYSTEMS
- Quest Software
- Perforce
- HPE
- TeleMate
- Pingman Tools
- LiveAction
- ITRS Group
- SevOne
Notable Milestones in Network Performance Monitoring Tool Sector
- 2021: Significant advancements in AI/ML integration across leading NPM platforms, enabling more sophisticated anomaly detection and predictive analytics.
- 2022: Increased focus on cloud-native NPM solutions, with vendors enhancing their offerings for monitoring AWS, Azure, and Google Cloud environments.
- 2023: A surge in M&A activity as larger players acquire innovative startups to bolster their AI capabilities and expand their service portfolios.
- 2023: Launch of enhanced synthetic monitoring capabilities by several vendors, offering deeper insights into end-user experience from various geographic locations.
- 2024: Growing emphasis on observability platforms that unify network, application, and infrastructure monitoring, moving beyond traditional NPM.
- 2024: Increased integration of NPM tools with cybersecurity platforms to provide correlated threat and performance insights.
- 2025 (Estimated): Expected broader adoption of AI-driven automation for network remediation and self-healing capabilities.
In-Depth Network Performance Monitoring Tool Market Outlook
The future of the Network Performance Monitoring (NPM) tool market is exceptionally bright, driven by ongoing technological innovation and an ever-increasing reliance on robust and high-performing digital infrastructures. Growth accelerators such as the pervasive integration of AI/ML for predictive and prescriptive analytics, the expansion of hybrid and multi-cloud environments requiring comprehensive visibility, and the critical need for seamless user experience will continue to fuel market expansion. Strategic partnerships and the development of specialized NPM solutions for emerging technologies like 5G and IoT will unlock new market segments. The market is poised for sustained growth, offering significant opportunities for vendors to innovate and for organizations to enhance their network resilience and operational efficiency, ultimately contributing to a more connected and productive digital world.
Network Performance Monitoring Tool Segmentation
-
1. Application
- 1.1. Large Enterprises
- 1.2. SMEs
-
2. Type
- 2.1. Cloud Based
- 2.2. On Premises
Network Performance Monitoring Tool Segmentation By Geography
-
1. North America
- 1.1. United States
- 1.2. Canada
- 1.3. Mexico
-
2. South America
- 2.1. Brazil
- 2.2. Argentina
- 2.3. Rest of South America
-
3. Europe
- 3.1. United Kingdom
- 3.2. Germany
- 3.3. France
- 3.4. Italy
- 3.5. Spain
- 3.6. Russia
- 3.7. Benelux
- 3.8. Nordics
- 3.9. Rest of Europe
-
4. Middle East & Africa
- 4.1. Turkey
- 4.2. Israel
- 4.3. GCC
- 4.4. North Africa
- 4.5. South Africa
- 4.6. Rest of Middle East & Africa
-
5. Asia Pacific
- 5.1. China
- 5.2. India
- 5.3. Japan
- 5.4. South Korea
- 5.5. ASEAN
- 5.6. Oceania
- 5.7. Rest of Asia Pacific
Network Performance Monitoring Tool REPORT HIGHLIGHTS
| Aspects | Details |
|---|---|
| Study Period | 2019-2033 |
| Base Year | 2024 |
| Estimated Year | 2025 |
| Forecast Period | 2025-2033 |
| Historical Period | 2019-2024 |
| Growth Rate | CAGR of XXX% from 2019-2033 |
| Segmentation |
|
Table of Contents
- 1. Introduction
- 1.1. Research Scope
- 1.2. Market Segmentation
- 1.3. Research Methodology
- 1.4. Definitions and Assumptions
- 2. Executive Summary
- 2.1. Introduction
- 3. Market Dynamics
- 3.1. Introduction
- 3.2. Market Drivers
- 3.3. Market Restrains
- 3.4. Market Trends
- 4. Market Factor Analysis
- 4.1. Porters Five Forces
- 4.2. Supply/Value Chain
- 4.3. PESTEL analysis
- 4.4. Market Entropy
- 4.5. Patent/Trademark Analysis
- 5. Global Network Performance Monitoring Tool Analysis, Insights and Forecast, 2019-2031
- 5.1. Market Analysis, Insights and Forecast - by Application
- 5.1.1. Large Enterprises
- 5.1.2. SMEs
- 5.2. Market Analysis, Insights and Forecast - by Type
- 5.2.1. Cloud Based
- 5.2.2. On Premises
- 5.3. Market Analysis, Insights and Forecast - by Region
- 5.3.1. North America
- 5.3.2. South America
- 5.3.3. Europe
- 5.3.4. Middle East & Africa
- 5.3.5. Asia Pacific
- 5.1. Market Analysis, Insights and Forecast - by Application
- 6. North America Network Performance Monitoring Tool Analysis, Insights and Forecast, 2019-2031
- 6.1. Market Analysis, Insights and Forecast - by Application
- 6.1.1. Large Enterprises
- 6.1.2. SMEs
- 6.2. Market Analysis, Insights and Forecast - by Type
- 6.2.1. Cloud Based
- 6.2.2. On Premises
- 6.1. Market Analysis, Insights and Forecast - by Application
- 7. South America Network Performance Monitoring Tool Analysis, Insights and Forecast, 2019-2031
- 7.1. Market Analysis, Insights and Forecast - by Application
- 7.1.1. Large Enterprises
- 7.1.2. SMEs
- 7.2. Market Analysis, Insights and Forecast - by Type
- 7.2.1. Cloud Based
- 7.2.2. On Premises
- 7.1. Market Analysis, Insights and Forecast - by Application
- 8. Europe Network Performance Monitoring Tool Analysis, Insights and Forecast, 2019-2031
- 8.1. Market Analysis, Insights and Forecast - by Application
- 8.1.1. Large Enterprises
- 8.1.2. SMEs
- 8.2. Market Analysis, Insights and Forecast - by Type
- 8.2.1. Cloud Based
- 8.2.2. On Premises
- 8.1. Market Analysis, Insights and Forecast - by Application
- 9. Middle East & Africa Network Performance Monitoring Tool Analysis, Insights and Forecast, 2019-2031
- 9.1. Market Analysis, Insights and Forecast - by Application
- 9.1.1. Large Enterprises
- 9.1.2. SMEs
- 9.2. Market Analysis, Insights and Forecast - by Type
- 9.2.1. Cloud Based
- 9.2.2. On Premises
- 9.1. Market Analysis, Insights and Forecast - by Application
- 10. Asia Pacific Network Performance Monitoring Tool Analysis, Insights and Forecast, 2019-2031
- 10.1. Market Analysis, Insights and Forecast - by Application
- 10.1.1. Large Enterprises
- 10.1.2. SMEs
- 10.2. Market Analysis, Insights and Forecast - by Type
- 10.2.1. Cloud Based
- 10.2.2. On Premises
- 10.1. Market Analysis, Insights and Forecast - by Application
- 11. Competitive Analysis
- 11.1. Global Market Share Analysis 2024
- 11.2. Company Profiles
- 11.2.1 SolarWinds
- 11.2.1.1. Overview
- 11.2.1.2. Products
- 11.2.1.3. SWOT Analysis
- 11.2.1.4. Recent Developments
- 11.2.1.5. Financials (Based on Availability)
- 11.2.2 LogicMonitor
- 11.2.2.1. Overview
- 11.2.2.2. Products
- 11.2.2.3. SWOT Analysis
- 11.2.2.4. Recent Developments
- 11.2.2.5. Financials (Based on Availability)
- 11.2.3 Auvik Networks
- 11.2.3.1. Overview
- 11.2.3.2. Products
- 11.2.3.3. SWOT Analysis
- 11.2.3.4. Recent Developments
- 11.2.3.5. Financials (Based on Availability)
- 11.2.4 Paessler AG
- 11.2.4.1. Overview
- 11.2.4.2. Products
- 11.2.4.3. SWOT Analysis
- 11.2.4.4. Recent Developments
- 11.2.4.5. Financials (Based on Availability)
- 11.2.5 Nagios
- 11.2.5.1. Overview
- 11.2.5.2. Products
- 11.2.5.3. SWOT Analysis
- 11.2.5.4. Recent Developments
- 11.2.5.5. Financials (Based on Availability)
- 11.2.6 Zabbix
- 11.2.6.1. Overview
- 11.2.6.2. Products
- 11.2.6.3. SWOT Analysis
- 11.2.6.4. Recent Developments
- 11.2.6.5. Financials (Based on Availability)
- 11.2.7 Progress
- 11.2.7.1. Overview
- 11.2.7.2. Products
- 11.2.7.3. SWOT Analysis
- 11.2.7.4. Recent Developments
- 11.2.7.5. Financials (Based on Availability)
- 11.2.8 Cisco Systems
- 11.2.8.1. Overview
- 11.2.8.2. Products
- 11.2.8.3. SWOT Analysis
- 11.2.8.4. Recent Developments
- 11.2.8.5. Financials (Based on Availability)
- 11.2.9 Splunk
- 11.2.9.1. Overview
- 11.2.9.2. Products
- 11.2.9.3. SWOT Analysis
- 11.2.9.4. Recent Developments
- 11.2.9.5. Financials (Based on Availability)
- 11.2.10 ManageEngine
- 11.2.10.1. Overview
- 11.2.10.2. Products
- 11.2.10.3. SWOT Analysis
- 11.2.10.4. Recent Developments
- 11.2.10.5. Financials (Based on Availability)
- 11.2.11 HelpSystems
- 11.2.11.1. Overview
- 11.2.11.2. Products
- 11.2.11.3. SWOT Analysis
- 11.2.11.4. Recent Developments
- 11.2.11.5. Financials (Based on Availability)
- 11.2.12 Icinga
- 11.2.12.1. Overview
- 11.2.12.2. Products
- 11.2.12.3. SWOT Analysis
- 11.2.12.4. Recent Developments
- 11.2.12.5. Financials (Based on Availability)
- 11.2.13 Aterlo Networks
- 11.2.13.1. Overview
- 11.2.13.2. Products
- 11.2.13.3. SWOT Analysis
- 11.2.13.4. Recent Developments
- 11.2.13.5. Financials (Based on Availability)
- 11.2.14 NETSCOUT SYSTEMS
- 11.2.14.1. Overview
- 11.2.14.2. Products
- 11.2.14.3. SWOT Analysis
- 11.2.14.4. Recent Developments
- 11.2.14.5. Financials (Based on Availability)
- 11.2.15 Quest Software
- 11.2.15.1. Overview
- 11.2.15.2. Products
- 11.2.15.3. SWOT Analysis
- 11.2.15.4. Recent Developments
- 11.2.15.5. Financials (Based on Availability)
- 11.2.16 Perforce
- 11.2.16.1. Overview
- 11.2.16.2. Products
- 11.2.16.3. SWOT Analysis
- 11.2.16.4. Recent Developments
- 11.2.16.5. Financials (Based on Availability)
- 11.2.17 HPE
- 11.2.17.1. Overview
- 11.2.17.2. Products
- 11.2.17.3. SWOT Analysis
- 11.2.17.4. Recent Developments
- 11.2.17.5. Financials (Based on Availability)
- 11.2.18 TeleMate
- 11.2.18.1. Overview
- 11.2.18.2. Products
- 11.2.18.3. SWOT Analysis
- 11.2.18.4. Recent Developments
- 11.2.18.5. Financials (Based on Availability)
- 11.2.19 Pingman Tools
- 11.2.19.1. Overview
- 11.2.19.2. Products
- 11.2.19.3. SWOT Analysis
- 11.2.19.4. Recent Developments
- 11.2.19.5. Financials (Based on Availability)
- 11.2.20 LiveAction
- 11.2.20.1. Overview
- 11.2.20.2. Products
- 11.2.20.3. SWOT Analysis
- 11.2.20.4. Recent Developments
- 11.2.20.5. Financials (Based on Availability)
- 11.2.21 ITRS Group
- 11.2.21.1. Overview
- 11.2.21.2. Products
- 11.2.21.3. SWOT Analysis
- 11.2.21.4. Recent Developments
- 11.2.21.5. Financials (Based on Availability)
- 11.2.22 SevOne
- 11.2.22.1. Overview
- 11.2.22.2. Products
- 11.2.22.3. SWOT Analysis
- 11.2.22.4. Recent Developments
- 11.2.22.5. Financials (Based on Availability)
- 11.2.1 SolarWinds
List of Figures
- Figure 1: Global Network Performance Monitoring Tool Revenue Breakdown (million, %) by Region 2024 & 2032
- Figure 2: North America Network Performance Monitoring Tool Revenue (million), by Application 2024 & 2032
- Figure 3: North America Network Performance Monitoring Tool Revenue Share (%), by Application 2024 & 2032
- Figure 4: North America Network Performance Monitoring Tool Revenue (million), by Type 2024 & 2032
- Figure 5: North America Network Performance Monitoring Tool Revenue Share (%), by Type 2024 & 2032
- Figure 6: North America Network Performance Monitoring Tool Revenue (million), by Country 2024 & 2032
- Figure 7: North America Network Performance Monitoring Tool Revenue Share (%), by Country 2024 & 2032
- Figure 8: South America Network Performance Monitoring Tool Revenue (million), by Application 2024 & 2032
- Figure 9: South America Network Performance Monitoring Tool Revenue Share (%), by Application 2024 & 2032
- Figure 10: South America Network Performance Monitoring Tool Revenue (million), by Type 2024 & 2032
- Figure 11: South America Network Performance Monitoring Tool Revenue Share (%), by Type 2024 & 2032
- Figure 12: South America Network Performance Monitoring Tool Revenue (million), by Country 2024 & 2032
- Figure 13: South America Network Performance Monitoring Tool Revenue Share (%), by Country 2024 & 2032
- Figure 14: Europe Network Performance Monitoring Tool Revenue (million), by Application 2024 & 2032
- Figure 15: Europe Network Performance Monitoring Tool Revenue Share (%), by Application 2024 & 2032
- Figure 16: Europe Network Performance Monitoring Tool Revenue (million), by Type 2024 & 2032
- Figure 17: Europe Network Performance Monitoring Tool Revenue Share (%), by Type 2024 & 2032
- Figure 18: Europe Network Performance Monitoring Tool Revenue (million), by Country 2024 & 2032
- Figure 19: Europe Network Performance Monitoring Tool Revenue Share (%), by Country 2024 & 2032
- Figure 20: Middle East & Africa Network Performance Monitoring Tool Revenue (million), by Application 2024 & 2032
- Figure 21: Middle East & Africa Network Performance Monitoring Tool Revenue Share (%), by Application 2024 & 2032
- Figure 22: Middle East & Africa Network Performance Monitoring Tool Revenue (million), by Type 2024 & 2032
- Figure 23: Middle East & Africa Network Performance Monitoring Tool Revenue Share (%), by Type 2024 & 2032
- Figure 24: Middle East & Africa Network Performance Monitoring Tool Revenue (million), by Country 2024 & 2032
- Figure 25: Middle East & Africa Network Performance Monitoring Tool Revenue Share (%), by Country 2024 & 2032
- Figure 26: Asia Pacific Network Performance Monitoring Tool Revenue (million), by Application 2024 & 2032
- Figure 27: Asia Pacific Network Performance Monitoring Tool Revenue Share (%), by Application 2024 & 2032
- Figure 28: Asia Pacific Network Performance Monitoring Tool Revenue (million), by Type 2024 & 2032
- Figure 29: Asia Pacific Network Performance Monitoring Tool Revenue Share (%), by Type 2024 & 2032
- Figure 30: Asia Pacific Network Performance Monitoring Tool Revenue (million), by Country 2024 & 2032
- Figure 31: Asia Pacific Network Performance Monitoring Tool Revenue Share (%), by Country 2024 & 2032
List of Tables
- Table 1: Global Network Performance Monitoring Tool Revenue million Forecast, by Region 2019 & 2032
- Table 2: Global Network Performance Monitoring Tool Revenue million Forecast, by Application 2019 & 2032
- Table 3: Global Network Performance Monitoring Tool Revenue million Forecast, by Type 2019 & 2032
- Table 4: Global Network Performance Monitoring Tool Revenue million Forecast, by Region 2019 & 2032
- Table 5: Global Network Performance Monitoring Tool Revenue million Forecast, by Application 2019 & 2032
- Table 6: Global Network Performance Monitoring Tool Revenue million Forecast, by Type 2019 & 2032
- Table 7: Global Network Performance Monitoring Tool Revenue million Forecast, by Country 2019 & 2032
- Table 8: United States Network Performance Monitoring Tool Revenue (million) Forecast, by Application 2019 & 2032
- Table 9: Canada Network Performance Monitoring Tool Revenue (million) Forecast, by Application 2019 & 2032
- Table 10: Mexico Network Performance Monitoring Tool Revenue (million) Forecast, by Application 2019 & 2032
- Table 11: Global Network Performance Monitoring Tool Revenue million Forecast, by Application 2019 & 2032
- Table 12: Global Network Performance Monitoring Tool Revenue million Forecast, by Type 2019 & 2032
- Table 13: Global Network Performance Monitoring Tool Revenue million Forecast, by Country 2019 & 2032
- Table 14: Brazil Network Performance Monitoring Tool Revenue (million) Forecast, by Application 2019 & 2032
- Table 15: Argentina Network Performance Monitoring Tool Revenue (million) Forecast, by Application 2019 & 2032
- Table 16: Rest of South America Network Performance Monitoring Tool Revenue (million) Forecast, by Application 2019 & 2032
- Table 17: Global Network Performance Monitoring Tool Revenue million Forecast, by Application 2019 & 2032
- Table 18: Global Network Performance Monitoring Tool Revenue million Forecast, by Type 2019 & 2032
- Table 19: Global Network Performance Monitoring Tool Revenue million Forecast, by Country 2019 & 2032
- Table 20: United Kingdom Network Performance Monitoring Tool Revenue (million) Forecast, by Application 2019 & 2032
- Table 21: Germany Network Performance Monitoring Tool Revenue (million) Forecast, by Application 2019 & 2032
- Table 22: France Network Performance Monitoring Tool Revenue (million) Forecast, by Application 2019 & 2032
- Table 23: Italy Network Performance Monitoring Tool Revenue (million) Forecast, by Application 2019 & 2032
- Table 24: Spain Network Performance Monitoring Tool Revenue (million) Forecast, by Application 2019 & 2032
- Table 25: Russia Network Performance Monitoring Tool Revenue (million) Forecast, by Application 2019 & 2032
- Table 26: Benelux Network Performance Monitoring Tool Revenue (million) Forecast, by Application 2019 & 2032
- Table 27: Nordics Network Performance Monitoring Tool Revenue (million) Forecast, by Application 2019 & 2032
- Table 28: Rest of Europe Network Performance Monitoring Tool Revenue (million) Forecast, by Application 2019 & 2032
- Table 29: Global Network Performance Monitoring Tool Revenue million Forecast, by Application 2019 & 2032
- Table 30: Global Network Performance Monitoring Tool Revenue million Forecast, by Type 2019 & 2032
- Table 31: Global Network Performance Monitoring Tool Revenue million Forecast, by Country 2019 & 2032
- Table 32: Turkey Network Performance Monitoring Tool Revenue (million) Forecast, by Application 2019 & 2032
- Table 33: Israel Network Performance Monitoring Tool Revenue (million) Forecast, by Application 2019 & 2032
- Table 34: GCC Network Performance Monitoring Tool Revenue (million) Forecast, by Application 2019 & 2032
- Table 35: North Africa Network Performance Monitoring Tool Revenue (million) Forecast, by Application 2019 & 2032
- Table 36: South Africa Network Performance Monitoring Tool Revenue (million) Forecast, by Application 2019 & 2032
- Table 37: Rest of Middle East & Africa Network Performance Monitoring Tool Revenue (million) Forecast, by Application 2019 & 2032
- Table 38: Global Network Performance Monitoring Tool Revenue million Forecast, by Application 2019 & 2032
- Table 39: Global Network Performance Monitoring Tool Revenue million Forecast, by Type 2019 & 2032
- Table 40: Global Network Performance Monitoring Tool Revenue million Forecast, by Country 2019 & 2032
- Table 41: China Network Performance Monitoring Tool Revenue (million) Forecast, by Application 2019 & 2032
- Table 42: India Network Performance Monitoring Tool Revenue (million) Forecast, by Application 2019 & 2032
- Table 43: Japan Network Performance Monitoring Tool Revenue (million) Forecast, by Application 2019 & 2032
- Table 44: South Korea Network Performance Monitoring Tool Revenue (million) Forecast, by Application 2019 & 2032
- Table 45: ASEAN Network Performance Monitoring Tool Revenue (million) Forecast, by Application 2019 & 2032
- Table 46: Oceania Network Performance Monitoring Tool Revenue (million) Forecast, by Application 2019 & 2032
- Table 47: Rest of Asia Pacific Network Performance Monitoring Tool Revenue (million) Forecast, by Application 2019 & 2032
Frequently Asked Questions
1. What is the projected Compound Annual Growth Rate (CAGR) of the Network Performance Monitoring Tool?
The projected CAGR is approximately XXX%.
2. Which companies are prominent players in the Network Performance Monitoring Tool?
Key companies in the market include SolarWinds, LogicMonitor, Auvik Networks, Paessler AG, Nagios, Zabbix, Progress, Cisco Systems, Splunk, ManageEngine, HelpSystems, Icinga, Aterlo Networks, NETSCOUT SYSTEMS, Quest Software, Perforce, HPE, TeleMate, Pingman Tools, LiveAction, ITRS Group, SevOne.
3. What are the main segments of the Network Performance Monitoring Tool?
The market segments include Application, Type.
4. Can you provide details about the market size?
The market size is estimated to be USD XXX million as of 2022.
5. What are some drivers contributing to market growth?
N/A
6. What are the notable trends driving market growth?
N/A
7. Are there any restraints impacting market growth?
N/A
8. Can you provide examples of recent developments in the market?
N/A
9. What pricing options are available for accessing the report?
Pricing options include single-user, multi-user, and enterprise licenses priced at USD 3950.00, USD 5925.00, and USD 7900.00 respectively.
10. Is the market size provided in terms of value or volume?
The market size is provided in terms of value, measured in million.
11. Are there any specific market keywords associated with the report?
Yes, the market keyword associated with the report is "Network Performance Monitoring Tool," which aids in identifying and referencing the specific market segment covered.
12. How do I determine which pricing option suits my needs best?
The pricing options vary based on user requirements and access needs. Individual users may opt for single-user licenses, while businesses requiring broader access may choose multi-user or enterprise licenses for cost-effective access to the report.
13. Are there any additional resources or data provided in the Network Performance Monitoring Tool report?
While the report offers comprehensive insights, it's advisable to review the specific contents or supplementary materials provided to ascertain if additional resources or data are available.
14. How can I stay updated on further developments or reports in the Network Performance Monitoring Tool?
To stay informed about further developments, trends, and reports in the Network Performance Monitoring Tool, consider subscribing to industry newsletters, following relevant companies and organizations, or regularly checking reputable industry news sources and publications.
Methodology
Step 1 - Identification of Relevant Samples Size from Population Database


Step 2 - Approaches for Defining Global Market Size (Value, Volume* & Price*)

Note*: In applicable scenarios
Step 3 - Data Sources
Primary Research
- Web Analytics
- Survey Reports
- Research Institute
- Latest Research Reports
- Opinion Leaders
Secondary Research
- Annual Reports
- White Paper
- Latest Press Release
- Industry Association
- Paid Database
- Investor Presentations

Step 4 - Data Triangulation
Involves using different sources of information in order to increase the validity of a study
These sources are likely to be stakeholders in a program - participants, other researchers, program staff, other community members, and so on.
Then we put all data in single framework & apply various statistical tools to find out the dynamic on the market.
During the analysis stage, feedback from the stakeholder groups would be compared to determine areas of agreement as well as areas of divergence
