

Key Insights
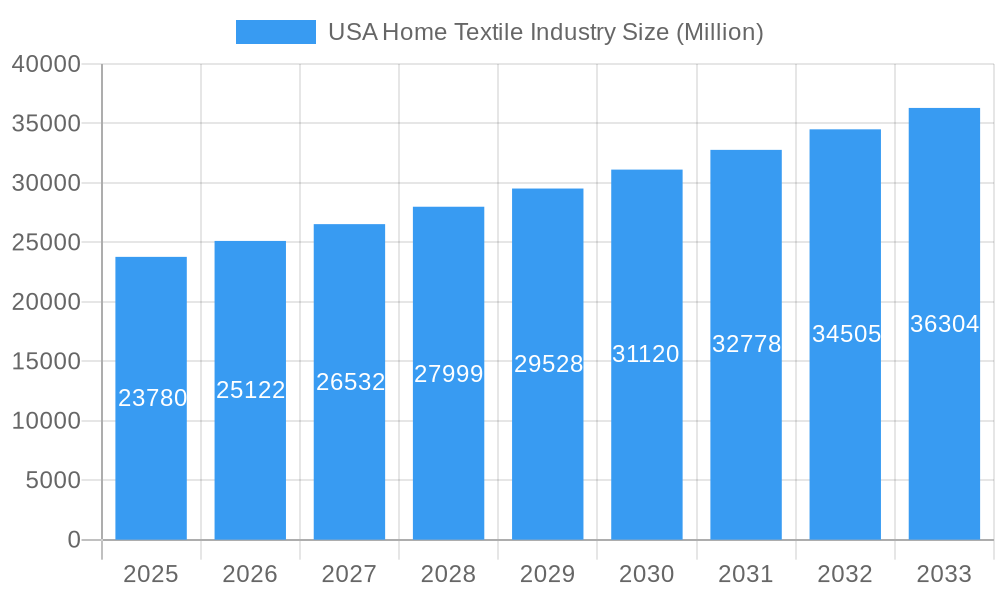
The US home textile market, valued at $23.78 billion in 2025, is projected to experience robust growth, exhibiting a Compound Annual Growth Rate (CAGR) of 5.42% from 2025 to 2033. This expansion is fueled by several key drivers. The increasing disposable incomes among consumers are leading to higher spending on home improvement and furnishing, boosting demand for high-quality home textiles. A rising preference for comfortable and aesthetically pleasing home environments, coupled with the growing popularity of interior design trends influencing purchasing decisions, further contributes to market growth. The increasing adoption of e-commerce platforms has broadened distribution channels, offering consumers more choices and convenient access to a wider range of products. Furthermore, the shift towards sustainable and eco-friendly materials within the industry caters to the environmentally conscious consumer base, representing a significant opportunity for growth. However, challenges such as fluctuating raw material prices and increasing competition from international manufacturers pose potential restraints to market expansion.
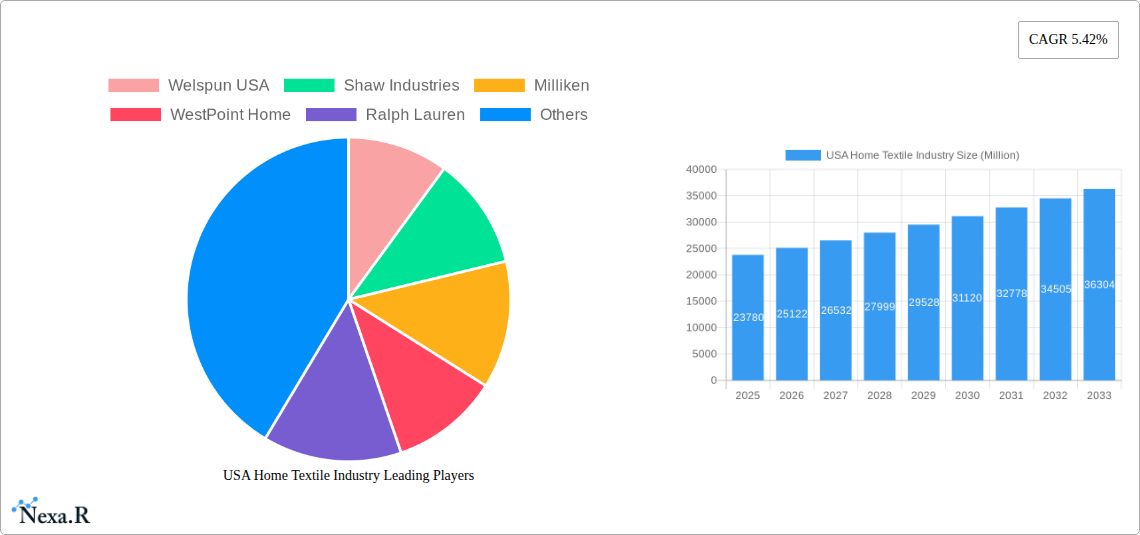
USA Home Textile Industry Market Size (In Billion)
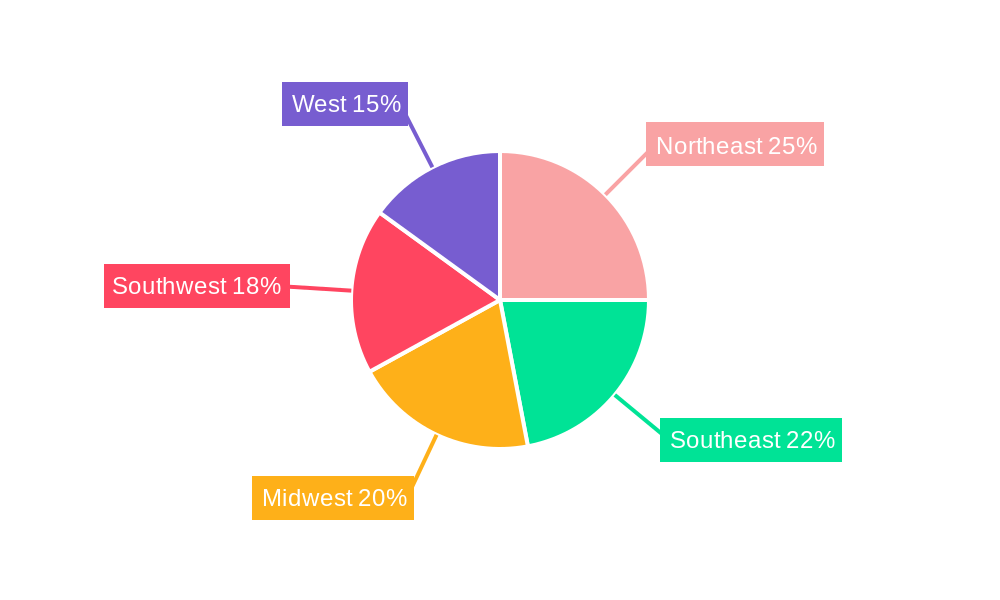
Market segmentation reveals diverse opportunities. Bed linen remains a dominant segment, followed by bath linen and kitchen linen, with upholstery and floor coverings showing considerable growth potential. The online distribution channel is experiencing rapid expansion, challenging the traditional dominance of supermarkets, hypermarkets, and specialty stores. Leading players like Welspun USA, Shaw Industries, and Milliken are capitalizing on these trends through product innovation, strategic partnerships, and expansion into new market segments. Regional analysis shows a strong demand across all regions of the United States, with the Northeast and West potentially leading in terms of per capita spending due to higher income levels and a focus on home aesthetics. The continued expansion of the middle class and the increasing focus on home improvement projects suggest strong market prospects throughout the forecast period.
USA Home Textile Industry Company Market Share
USA Home Textile Industry Market Report: 2019-2033
This comprehensive report provides an in-depth analysis of the USA home textile industry, covering market dynamics, growth trends, key players, and future outlook. The study period spans from 2019 to 2033, with 2025 serving as the base and estimated year. The report utilizes data from the historical period (2019-2024) to forecast market trends from 2025 to 2033. This report is essential for industry professionals, investors, and anyone seeking a thorough understanding of this dynamic sector. It offers invaluable insights into the parent market (Home Furnishings) and its child markets (e.g., Bed Linen, Bath Linen, Kitchen Textiles). Market values are presented in million units.
USA Home Textile Industry Market Dynamics & Structure
The US home textile market is characterized by a moderately concentrated structure with several major players commanding significant market share. Market concentration is expected to remain relatively stable through 2033, although mergers and acquisitions (M&A) activity could reshape the competitive landscape. Technological innovations, particularly in sustainable materials and manufacturing processes, are driving growth. Stringent regulatory frameworks related to product safety and environmental standards influence industry practices. Competitive product substitutes, such as synthetic alternatives, pose challenges to traditional textile manufacturers. End-user demographics, including a growing preference for home comfort and a rise in online shopping, also significantly impact market trends.
- Market Concentration: xx% held by top 5 players in 2024, projected to xx% by 2033.
- M&A Activity: xx deals recorded between 2019-2024; forecast for xx deals between 2025-2033.
- Innovation Barriers: High R&D costs and challenges in integrating sustainable practices.
- Regulatory Landscape: Compliance with safety and environmental regulations impacting production costs.
- End-User Demographics: Shifting preferences towards eco-friendly and technologically advanced products.
USA Home Textile Industry Growth Trends & Insights
The USA home textile market experienced consistent growth between 2019 and 2024, driven by factors such as rising disposable incomes, increased urbanization, and a preference for improved home aesthetics. The market size expanded from xx million units in 2019 to xx million units in 2024, exhibiting a CAGR of xx%. Technological disruptions, such as the rise of smart home textiles and personalized customization, are reshaping the industry. Consumer behavior shifts, with online shopping gaining popularity, require manufacturers to adapt their distribution strategies. The forecast period (2025-2033) projects continued growth, with a projected CAGR of xx%, reaching xx million units by 2033. This growth will be fueled by continued economic expansion, technological innovation, and evolving consumer preferences.
Dominant Regions, Countries, or Segments in USA Home Textile Industry
The Northeast and West Coast regions demonstrate the highest market concentration, driven by robust consumer spending and a higher density of urban populations. Within material types, Bed Linen accounts for the largest market share (xx%), followed by Bath Linen (xx%) and Upholstery (xx%). The Online distribution channel displays rapid growth, outpacing other channels like Supermarkets and Hypermarkets, and Specialty Stores. This growth is driven by convenience, wider selection, and competitive pricing.
- Key Drivers (Northeast & West Coast): Higher disposable incomes, strong consumer demand, well-developed retail infrastructure.
- Dominant Segment (Bed Linen): High demand driven by preference for comfort, various styles, and frequent replacements.
- Fastest Growing Channel (Online): Convenience, broader selection, and competitive pricing fuel online sales growth.
USA Home Textile Industry Product Landscape
The home textile market showcases a diverse range of products, from traditional cotton bed sheets and towels to innovative smart textiles with temperature regulation and antimicrobial properties. Technological advancements focus on enhancing product performance, durability, and sustainability. Companies are emphasizing unique selling propositions such as superior comfort, eco-friendly materials (organic cotton, recycled fibers), and personalized designs to attract consumers.
Key Drivers, Barriers & Challenges in USA Home Textile Industry
Key Drivers: Growing disposable incomes, increasing urbanization, rising demand for home improvement, and technological advancements in fabric production and design.
Challenges: Fluctuating raw material prices, intense competition from international manufacturers, and supply chain disruptions. These disruptions have had a quantifiable impact, leading to xx% increase in production costs in 2022.
Emerging Opportunities in USA Home Textile Industry
Emerging trends include the growing demand for sustainable and ethically sourced home textiles, personalized products, and smart home integration. Untapped markets exist in niche segments like specialized medical textiles and performance fabrics for outdoor use. Evolving consumer preferences for personalized experiences offer opportunities for customization and bespoke product offerings.
Growth Accelerators in the USA Home Textile Industry Industry
Technological advancements in material science and manufacturing processes are key growth catalysts. Strategic partnerships with designers and retailers can significantly expand market reach. Furthermore, market expansion into emerging segments, such as eco-friendly and smart home textiles, will drive long-term growth.
Key Players Shaping the USA Home Textile Industry Market
- Welspun USA
- Shaw Industries
- Milliken
- WestPoint Home
- Ralph Lauren
- Standard Textile
- TJX Companies
- Etro Home Collection
- Mohawk Industries
- Jim Thompson Fabrics
Notable Milestones in USA Home Textile Industry Sector
- December 2022: Milliken & Company's $27.4 million investment in Cherokee County expands operations and creates 75 jobs, signaling growth in the sector.
- June 2022: Mohawk Industries' acquisition of Vitromex for $293 million expands its market share in the ceramic tile segment, impacting the broader home textile market.
In-Depth USA Home Textile Industry Market Outlook
The US home textile market is poised for continued growth, driven by robust consumer demand, technological innovation, and strategic investments. Opportunities exist in developing sustainable products, personalized offerings, and expanding into emerging market segments. Companies that adopt agile strategies, embrace technological advancements, and prioritize sustainable practices are well-positioned to capitalize on the future market potential.
USA Home Textile Industry Segmentation
-
1. Material Type
- 1.1. Bed Linen
- 1.2. Bath Linen
- 1.3. Kitchen Linen
- 1.4. Upholstery
- 1.5. Floor Covering
-
2. Distribution Channel
- 2.1. Supermarkets and Hypermarkets
- 2.2. Specialty Stores
- 2.3. Online
- 2.4. Others
USA Home Textile Industry Segmentation By Geography
-
1. North America
- 1.1. United States
- 1.2. Canada
- 1.3. Mexico
-
2. South America
- 2.1. Brazil
- 2.2. Argentina
- 2.3. Rest of South America
-
3. Europe
- 3.1. United Kingdom
- 3.2. Germany
- 3.3. France
- 3.4. Italy
- 3.5. Spain
- 3.6. Russia
- 3.7. Benelux
- 3.8. Nordics
- 3.9. Rest of Europe
-
4. Middle East & Africa
- 4.1. Turkey
- 4.2. Israel
- 4.3. GCC
- 4.4. North Africa
- 4.5. South Africa
- 4.6. Rest of Middle East & Africa
-
5. Asia Pacific
- 5.1. China
- 5.2. India
- 5.3. Japan
- 5.4. South Korea
- 5.5. ASEAN
- 5.6. Oceania
- 5.7. Rest of Asia Pacific
USA Home Textile Industry Regional Market Share
Geographic Coverage of USA Home Textile Industry
USA Home Textile Industry REPORT HIGHLIGHTS
| Aspects | Details |
|---|---|
| Study Period | 2020-2034 |
| Base Year | 2025 |
| Estimated Year | 2026 |
| Forecast Period | 2026-2034 |
| Historical Period | 2020-2025 |
| Growth Rate | CAGR of 5.42% from 2020-2034 |
| Segmentation |
|
Table of Contents
- 1. Introduction
- 1.1. Research Scope
- 1.2. Market Segmentation
- 1.3. Research Objective
- 1.4. Definitions and Assumptions
- 2. Executive Summary
- 2.1. Market Snapshot
- 3. Market Dynamics
- 3.1. Market Drivers
- 3.2. Market Restrains
- 3.3. Market Trends
- 3.4. Market Opportunities
- 4. Market Factor Analysis
- 4.1. Porters Five Forces
- 4.1.1. Bargaining Power of Suppliers
- 4.1.2. Bargaining Power of Buyers
- 4.1.3. Threat of New Entrants
- 4.1.4. Threat of Substitutes
- 4.1.5. Competitive Rivalry
- 4.2. PESTEL analysis
- 4.3. BCG Analysis
- 4.3.1. Stars (High Growth, High Market Share)
- 4.3.2. Cash Cows (Low Growth, High Market Share)
- 4.3.3. Question Mark (High Growth, Low Market Share)
- 4.3.4. Dogs (Low Growth, Low Market Share)
- 4.4. Ansoff Matrix Analysis
- 4.5. Supply Chain Analysis
- 4.6. Regulatory Landscape
- 4.7. Current Market Potential and Opportunity Assessment (TAM–SAM–SOM Framework)
- 4.8. NRP Analyst Note
- 4.1. Porters Five Forces
- 5. Market Analysis, Insights and Forecast 2021-2033
- 5.1. Market Analysis, Insights and Forecast - by Material Type
- 5.1.1. Bed Linen
- 5.1.2. Bath Linen
- 5.1.3. Kitchen Linen
- 5.1.4. Upholstery
- 5.1.5. Floor Covering
- 5.2. Market Analysis, Insights and Forecast - by Distribution Channel
- 5.2.1. Supermarkets and Hypermarkets
- 5.2.2. Specialty Stores
- 5.2.3. Online
- 5.2.4. Others
- 5.3. Market Analysis, Insights and Forecast - by Region
- 5.3.1. North America
- 5.3.2. South America
- 5.3.3. Europe
- 5.3.4. Middle East & Africa
- 5.3.5. Asia Pacific
- 5.1. Market Analysis, Insights and Forecast - by Material Type
- 6. Global USA Home Textile Industry Analysis, Insights and Forecast, 2021-2033
- 6.1. Market Analysis, Insights and Forecast - by Material Type
- 6.1.1. Bed Linen
- 6.1.2. Bath Linen
- 6.1.3. Kitchen Linen
- 6.1.4. Upholstery
- 6.1.5. Floor Covering
- 6.2. Market Analysis, Insights and Forecast - by Distribution Channel
- 6.2.1. Supermarkets and Hypermarkets
- 6.2.2. Specialty Stores
- 6.2.3. Online
- 6.2.4. Others
- 6.1. Market Analysis, Insights and Forecast - by Material Type
- 7. North America USA Home Textile Industry Analysis, Insights and Forecast, 2020-2032
- 7.1. Market Analysis, Insights and Forecast - by Material Type
- 7.1.1. Bed Linen
- 7.1.2. Bath Linen
- 7.1.3. Kitchen Linen
- 7.1.4. Upholstery
- 7.1.5. Floor Covering
- 7.2. Market Analysis, Insights and Forecast - by Distribution Channel
- 7.2.1. Supermarkets and Hypermarkets
- 7.2.2. Specialty Stores
- 7.2.3. Online
- 7.2.4. Others
- 7.1. Market Analysis, Insights and Forecast - by Material Type
- 8. South America USA Home Textile Industry Analysis, Insights and Forecast, 2020-2032
- 8.1. Market Analysis, Insights and Forecast - by Material Type
- 8.1.1. Bed Linen
- 8.1.2. Bath Linen
- 8.1.3. Kitchen Linen
- 8.1.4. Upholstery
- 8.1.5. Floor Covering
- 8.2. Market Analysis, Insights and Forecast - by Distribution Channel
- 8.2.1. Supermarkets and Hypermarkets
- 8.2.2. Specialty Stores
- 8.2.3. Online
- 8.2.4. Others
- 8.1. Market Analysis, Insights and Forecast - by Material Type
- 9. Europe USA Home Textile Industry Analysis, Insights and Forecast, 2020-2032
- 9.1. Market Analysis, Insights and Forecast - by Material Type
- 9.1.1. Bed Linen
- 9.1.2. Bath Linen
- 9.1.3. Kitchen Linen
- 9.1.4. Upholstery
- 9.1.5. Floor Covering
- 9.2. Market Analysis, Insights and Forecast - by Distribution Channel
- 9.2.1. Supermarkets and Hypermarkets
- 9.2.2. Specialty Stores
- 9.2.3. Online
- 9.2.4. Others
- 9.1. Market Analysis, Insights and Forecast - by Material Type
- 10. Middle East & Africa USA Home Textile Industry Analysis, Insights and Forecast, 2020-2032
- 10.1. Market Analysis, Insights and Forecast - by Material Type
- 10.1.1. Bed Linen
- 10.1.2. Bath Linen
- 10.1.3. Kitchen Linen
- 10.1.4. Upholstery
- 10.1.5. Floor Covering
- 10.2. Market Analysis, Insights and Forecast - by Distribution Channel
- 10.2.1. Supermarkets and Hypermarkets
- 10.2.2. Specialty Stores
- 10.2.3. Online
- 10.2.4. Others
- 10.1. Market Analysis, Insights and Forecast - by Material Type
- 11. Asia Pacific USA Home Textile Industry Analysis, Insights and Forecast, 2020-2032
- 11.1. Market Analysis, Insights and Forecast - by Material Type
- 11.1.1. Bed Linen
- 11.1.2. Bath Linen
- 11.1.3. Kitchen Linen
- 11.1.4. Upholstery
- 11.1.5. Floor Covering
- 11.2. Market Analysis, Insights and Forecast - by Distribution Channel
- 11.2.1. Supermarkets and Hypermarkets
- 11.2.2. Specialty Stores
- 11.2.3. Online
- 11.2.4. Others
- 11.1. Market Analysis, Insights and Forecast - by Material Type
- 12. Competitive Analysis
- 12.1. Company Profiles
- 12.1.1 Welspun USA
- 12.1.1.1. Company Overview
- 12.1.1.2. Products
- 12.1.1.3. Company Financials
- 12.1.1.4. SWOT Analysis
- 12.1.2 Shaw Industries
- 12.1.2.1. Company Overview
- 12.1.2.2. Products
- 12.1.2.3. Company Financials
- 12.1.2.4. SWOT Analysis
- 12.1.3 Milliken
- 12.1.3.1. Company Overview
- 12.1.3.2. Products
- 12.1.3.3. Company Financials
- 12.1.3.4. SWOT Analysis
- 12.1.4 WestPoint Home
- 12.1.4.1. Company Overview
- 12.1.4.2. Products
- 12.1.4.3. Company Financials
- 12.1.4.4. SWOT Analysis
- 12.1.5 Ralph Lauren
- 12.1.5.1. Company Overview
- 12.1.5.2. Products
- 12.1.5.3. Company Financials
- 12.1.5.4. SWOT Analysis
- 12.1.6 Standard Textile**List Not Exhaustive
- 12.1.6.1. Company Overview
- 12.1.6.2. Products
- 12.1.6.3. Company Financials
- 12.1.6.4. SWOT Analysis
- 12.1.7 TJX Companies
- 12.1.7.1. Company Overview
- 12.1.7.2. Products
- 12.1.7.3. Company Financials
- 12.1.7.4. SWOT Analysis
- 12.1.8 Etro Home Collection
- 12.1.8.1. Company Overview
- 12.1.8.2. Products
- 12.1.8.3. Company Financials
- 12.1.8.4. SWOT Analysis
- 12.1.9 Mohawk Industries
- 12.1.9.1. Company Overview
- 12.1.9.2. Products
- 12.1.9.3. Company Financials
- 12.1.9.4. SWOT Analysis
- 12.1.10 Jim Thompson Fabrics
- 12.1.10.1. Company Overview
- 12.1.10.2. Products
- 12.1.10.3. Company Financials
- 12.1.10.4. SWOT Analysis
- 12.1.1 Welspun USA
- 12.2. Market Entropy
- 12.2.1 Company's Key Areas Served
- 12.2.2 Recent Developments
- 12.3. Company Market Share Analysis 2025
- 12.3.1 Top 5 Companies Market Share Analysis
- 12.3.2 Top 3 Companies Market Share Analysis
- 12.4. List of Potential Customers
- 13. Research Methodology
List of Figures
- Figure 1: Global USA Home Textile Industry Revenue Breakdown (Million, %) by Region 2025 & 2033
- Figure 2: North America USA Home Textile Industry Revenue (Million), by Material Type 2025 & 2033
- Figure 3: North America USA Home Textile Industry Revenue Share (%), by Material Type 2025 & 2033
- Figure 4: North America USA Home Textile Industry Revenue (Million), by Distribution Channel 2025 & 2033
- Figure 5: North America USA Home Textile Industry Revenue Share (%), by Distribution Channel 2025 & 2033
- Figure 6: North America USA Home Textile Industry Revenue (Million), by Country 2025 & 2033
- Figure 7: North America USA Home Textile Industry Revenue Share (%), by Country 2025 & 2033
- Figure 8: South America USA Home Textile Industry Revenue (Million), by Material Type 2025 & 2033
- Figure 9: South America USA Home Textile Industry Revenue Share (%), by Material Type 2025 & 2033
- Figure 10: South America USA Home Textile Industry Revenue (Million), by Distribution Channel 2025 & 2033
- Figure 11: South America USA Home Textile Industry Revenue Share (%), by Distribution Channel 2025 & 2033
- Figure 12: South America USA Home Textile Industry Revenue (Million), by Country 2025 & 2033
- Figure 13: South America USA Home Textile Industry Revenue Share (%), by Country 2025 & 2033
- Figure 14: Europe USA Home Textile Industry Revenue (Million), by Material Type 2025 & 2033
- Figure 15: Europe USA Home Textile Industry Revenue Share (%), by Material Type 2025 & 2033
- Figure 16: Europe USA Home Textile Industry Revenue (Million), by Distribution Channel 2025 & 2033
- Figure 17: Europe USA Home Textile Industry Revenue Share (%), by Distribution Channel 2025 & 2033
- Figure 18: Europe USA Home Textile Industry Revenue (Million), by Country 2025 & 2033
- Figure 19: Europe USA Home Textile Industry Revenue Share (%), by Country 2025 & 2033
- Figure 20: Middle East & Africa USA Home Textile Industry Revenue (Million), by Material Type 2025 & 2033
- Figure 21: Middle East & Africa USA Home Textile Industry Revenue Share (%), by Material Type 2025 & 2033
- Figure 22: Middle East & Africa USA Home Textile Industry Revenue (Million), by Distribution Channel 2025 & 2033
- Figure 23: Middle East & Africa USA Home Textile Industry Revenue Share (%), by Distribution Channel 2025 & 2033
- Figure 24: Middle East & Africa USA Home Textile Industry Revenue (Million), by Country 2025 & 2033
- Figure 25: Middle East & Africa USA Home Textile Industry Revenue Share (%), by Country 2025 & 2033
- Figure 26: Asia Pacific USA Home Textile Industry Revenue (Million), by Material Type 2025 & 2033
- Figure 27: Asia Pacific USA Home Textile Industry Revenue Share (%), by Material Type 2025 & 2033
- Figure 28: Asia Pacific USA Home Textile Industry Revenue (Million), by Distribution Channel 2025 & 2033
- Figure 29: Asia Pacific USA Home Textile Industry Revenue Share (%), by Distribution Channel 2025 & 2033
- Figure 30: Asia Pacific USA Home Textile Industry Revenue (Million), by Country 2025 & 2033
- Figure 31: Asia Pacific USA Home Textile Industry Revenue Share (%), by Country 2025 & 2033
List of Tables
- Table 1: Global USA Home Textile Industry Revenue Million Forecast, by Material Type 2020 & 2033
- Table 2: Global USA Home Textile Industry Revenue Million Forecast, by Distribution Channel 2020 & 2033
- Table 3: Global USA Home Textile Industry Revenue Million Forecast, by Region 2020 & 2033
- Table 4: Global USA Home Textile Industry Revenue Million Forecast, by Material Type 2020 & 2033
- Table 5: Global USA Home Textile Industry Revenue Million Forecast, by Distribution Channel 2020 & 2033
- Table 6: Global USA Home Textile Industry Revenue Million Forecast, by Country 2020 & 2033
- Table 7: United States USA Home Textile Industry Revenue (Million) Forecast, by Application 2020 & 2033
- Table 8: Canada USA Home Textile Industry Revenue (Million) Forecast, by Application 2020 & 2033
- Table 9: Mexico USA Home Textile Industry Revenue (Million) Forecast, by Application 2020 & 2033
- Table 10: Global USA Home Textile Industry Revenue Million Forecast, by Material Type 2020 & 2033
- Table 11: Global USA Home Textile Industry Revenue Million Forecast, by Distribution Channel 2020 & 2033
- Table 12: Global USA Home Textile Industry Revenue Million Forecast, by Country 2020 & 2033
- Table 13: Brazil USA Home Textile Industry Revenue (Million) Forecast, by Application 2020 & 2033
- Table 14: Argentina USA Home Textile Industry Revenue (Million) Forecast, by Application 2020 & 2033
- Table 15: Rest of South America USA Home Textile Industry Revenue (Million) Forecast, by Application 2020 & 2033
- Table 16: Global USA Home Textile Industry Revenue Million Forecast, by Material Type 2020 & 2033
- Table 17: Global USA Home Textile Industry Revenue Million Forecast, by Distribution Channel 2020 & 2033
- Table 18: Global USA Home Textile Industry Revenue Million Forecast, by Country 2020 & 2033
- Table 19: United Kingdom USA Home Textile Industry Revenue (Million) Forecast, by Application 2020 & 2033
- Table 20: Germany USA Home Textile Industry Revenue (Million) Forecast, by Application 2020 & 2033
- Table 21: France USA Home Textile Industry Revenue (Million) Forecast, by Application 2020 & 2033
- Table 22: Italy USA Home Textile Industry Revenue (Million) Forecast, by Application 2020 & 2033
- Table 23: Spain USA Home Textile Industry Revenue (Million) Forecast, by Application 2020 & 2033
- Table 24: Russia USA Home Textile Industry Revenue (Million) Forecast, by Application 2020 & 2033
- Table 25: Benelux USA Home Textile Industry Revenue (Million) Forecast, by Application 2020 & 2033
- Table 26: Nordics USA Home Textile Industry Revenue (Million) Forecast, by Application 2020 & 2033
- Table 27: Rest of Europe USA Home Textile Industry Revenue (Million) Forecast, by Application 2020 & 2033
- Table 28: Global USA Home Textile Industry Revenue Million Forecast, by Material Type 2020 & 2033
- Table 29: Global USA Home Textile Industry Revenue Million Forecast, by Distribution Channel 2020 & 2033
- Table 30: Global USA Home Textile Industry Revenue Million Forecast, by Country 2020 & 2033
- Table 31: Turkey USA Home Textile Industry Revenue (Million) Forecast, by Application 2020 & 2033
- Table 32: Israel USA Home Textile Industry Revenue (Million) Forecast, by Application 2020 & 2033
- Table 33: GCC USA Home Textile Industry Revenue (Million) Forecast, by Application 2020 & 2033
- Table 34: North Africa USA Home Textile Industry Revenue (Million) Forecast, by Application 2020 & 2033
- Table 35: South Africa USA Home Textile Industry Revenue (Million) Forecast, by Application 2020 & 2033
- Table 36: Rest of Middle East & Africa USA Home Textile Industry Revenue (Million) Forecast, by Application 2020 & 2033
- Table 37: Global USA Home Textile Industry Revenue Million Forecast, by Material Type 2020 & 2033
- Table 38: Global USA Home Textile Industry Revenue Million Forecast, by Distribution Channel 2020 & 2033
- Table 39: Global USA Home Textile Industry Revenue Million Forecast, by Country 2020 & 2033
- Table 40: China USA Home Textile Industry Revenue (Million) Forecast, by Application 2020 & 2033
- Table 41: India USA Home Textile Industry Revenue (Million) Forecast, by Application 2020 & 2033
- Table 42: Japan USA Home Textile Industry Revenue (Million) Forecast, by Application 2020 & 2033
- Table 43: South Korea USA Home Textile Industry Revenue (Million) Forecast, by Application 2020 & 2033
- Table 44: ASEAN USA Home Textile Industry Revenue (Million) Forecast, by Application 2020 & 2033
- Table 45: Oceania USA Home Textile Industry Revenue (Million) Forecast, by Application 2020 & 2033
- Table 46: Rest of Asia Pacific USA Home Textile Industry Revenue (Million) Forecast, by Application 2020 & 2033
Frequently Asked Questions
1. What is the projected Compound Annual Growth Rate (CAGR) of the USA Home Textile Industry?
The projected CAGR is approximately 5.42%.
2. Which companies are prominent players in the USA Home Textile Industry?
Key companies in the market include Welspun USA, Shaw Industries, Milliken, WestPoint Home, Ralph Lauren, Standard Textile**List Not Exhaustive, TJX Companies, Etro Home Collection, Mohawk Industries, Jim Thompson Fabrics.
3. What are the main segments of the USA Home Textile Industry?
The market segments include Material Type, Distribution Channel.
4. Can you provide details about the market size?
The market size is estimated to be USD 23.78 Million as of 2022.
5. What are some drivers contributing to market growth?
High Resistance to Scratches and Stains Drives the Market; High Durability Drives the Market.
6. What are the notable trends driving market growth?
Increasing Sector of Real Estate is Driving the Market.
7. Are there any restraints impacting market growth?
Excess Water Damages the Floor Covering; Exposure to Sun Cause Damages to the Floor Covering; Market Oppurtunities4.; Technological Advancements in Floor Covering Market4.; Increasing Demand for Hardwood Floors.
8. Can you provide examples of recent developments in the market?
December 2022: Milliken & Company, a diversified global textile manufacturer with more than 70 locations worldwide, plans to expand operations in Cherokee County. The company's $27.4 million investment will create 75 new jobs.
9. What pricing options are available for accessing the report?
Pricing options include single-user, multi-user, and enterprise licenses priced at USD 3800, USD 4500, and USD 5800 respectively.
10. Is the market size provided in terms of value or volume?
The market size is provided in terms of value, measured in Million.
11. Are there any specific market keywords associated with the report?
Yes, the market keyword associated with the report is "USA Home Textile Industry," which aids in identifying and referencing the specific market segment covered.
12. How do I determine which pricing option suits my needs best?
The pricing options vary based on user requirements and access needs. Individual users may opt for single-user licenses, while businesses requiring broader access may choose multi-user or enterprise licenses for cost-effective access to the report.
13. Are there any additional resources or data provided in the USA Home Textile Industry report?
While the report offers comprehensive insights, it's advisable to review the specific contents or supplementary materials provided to ascertain if additional resources or data are available.
14. How can I stay updated on further developments or reports in the USA Home Textile Industry?
To stay informed about further developments, trends, and reports in the USA Home Textile Industry, consider subscribing to industry newsletters, following relevant companies and organizations, or regularly checking reputable industry news sources and publications.
Methodology
Step 1 - Identification of Relevant Samples Size from Population Database


Step 2 - Approaches for Defining Global Market Size (Value, Volume* & Price*)

Note*: In applicable scenarios
Step 3 - Data Sources
Primary Research
- Web Analytics
- Survey Reports
- Research Institute
- Latest Research Reports
- Opinion Leaders
Secondary Research
- Annual Reports
- White Paper
- Latest Press Release
- Industry Association
- Paid Database
- Investor Presentations

Step 4 - Data Triangulation
Involves using different sources of information in order to increase the validity of a study
These sources are likely to be stakeholders in a program - participants, other researchers, program staff, other community members, and so on.
Then we put all data in single framework & apply various statistical tools to find out the dynamic on the market.
During the analysis stage, feedback from the stakeholder groups would be compared to determine areas of agreement as well as areas of divergence