

Key Insights
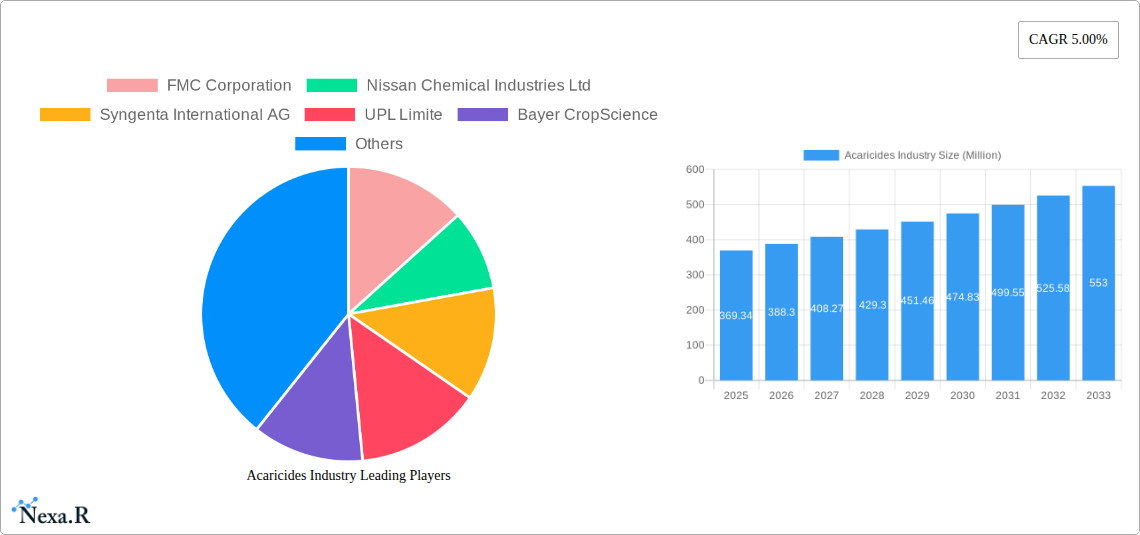
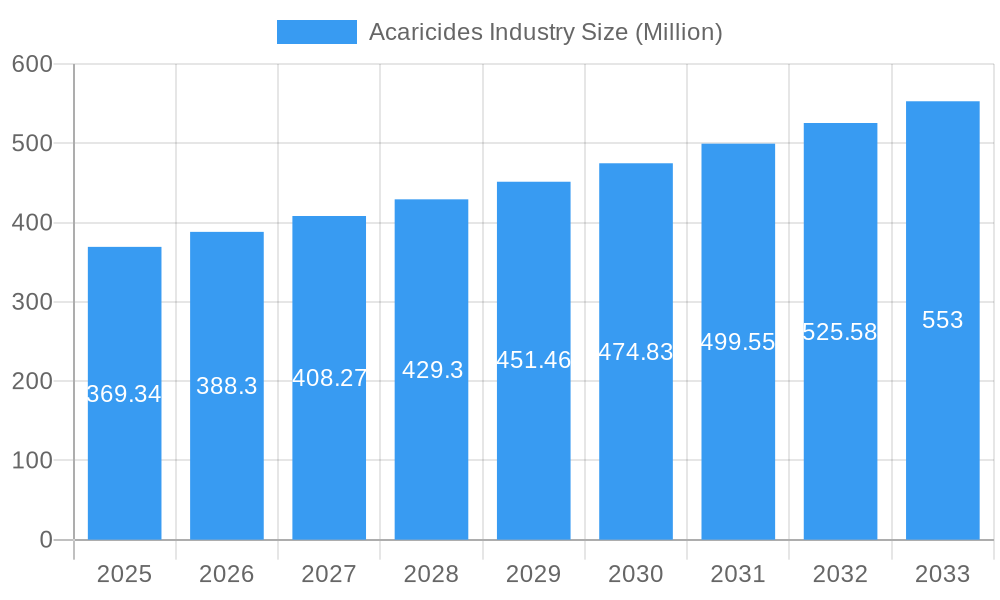
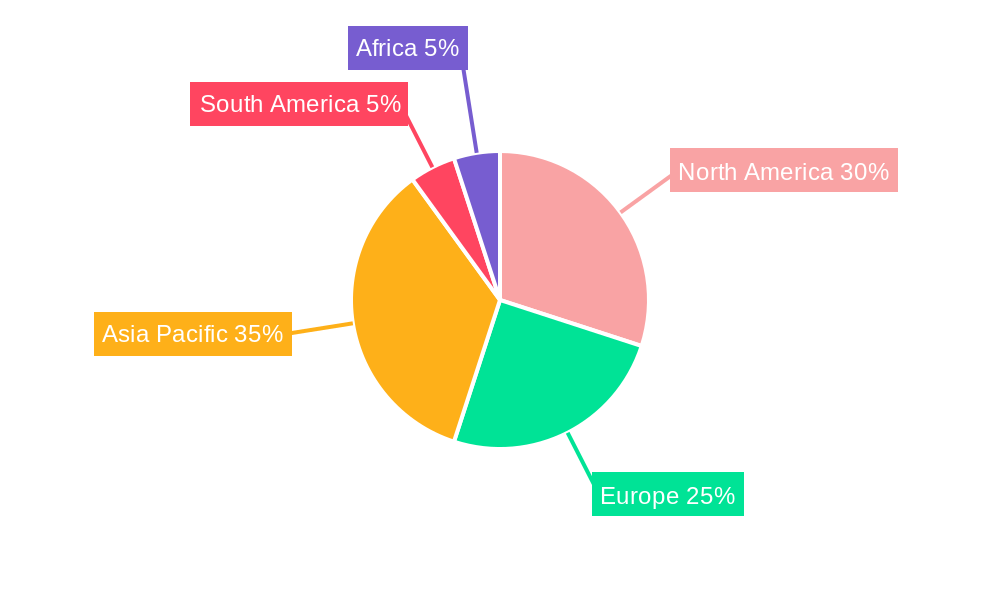
The global acaricide market, valued at $369.34 million in 2025, is projected to experience robust growth, driven by a Compound Annual Growth Rate (CAGR) of 5.00% from 2025 to 2033. This expansion is fueled by several key factors. Firstly, the increasing prevalence of acaricide-resistant mite populations in agriculture necessitates the development and adoption of novel and effective acaricide formulations. Secondly, rising global crop production to meet growing food demands creates a heightened need for effective pest control solutions, including acaricides. Furthermore, advancements in acaricide technology, such as the development of more environmentally friendly and targeted products, are contributing to market growth. However, stringent regulatory frameworks surrounding pesticide use and growing consumer concerns regarding pesticide residues in food pose significant challenges to market expansion. The market segmentation reveals a diverse landscape, with organophosphates, carbamates, pyrethroids, and other chemical types dominating the chemical type segment. Application-wise, spray application holds the largest market share, followed by dipping and hand dressing. Major players like FMC Corporation, Syngenta, Bayer, and BASF are key contributors to the market, investing heavily in research and development to enhance product efficacy and address evolving pest control needs. Geographic distribution reveals strong market presence across North America, Europe, and Asia-Pacific, with emerging markets in South America and Africa exhibiting high growth potential.
Acaricides Industry Market Size (In Million)
The future of the acaricide market hinges on several critical factors. The ongoing research and development efforts focused on developing new active ingredients and formulations with improved efficacy and reduced environmental impact will significantly shape market trajectories. Additionally, the evolution of integrated pest management (IPM) strategies and the increasing adoption of biopesticides present both opportunities and challenges for the acaricide industry. Companies will need to adapt their strategies to navigate the evolving regulatory landscape and address growing consumer demand for sustainable pest control solutions. The competition among existing players and the emergence of new entrants will further intensify market dynamics, driving innovation and potentially leading to price adjustments and product diversification. Successful players will be those capable of effectively balancing innovation, regulatory compliance, and consumer expectations.
Acaricides Industry Company Market Share
Acaricides Industry Market Report: 2019-2033
This comprehensive report provides an in-depth analysis of the Acaricides Industry, encompassing market dynamics, growth trends, regional insights, and competitive landscapes. With a focus on the period 2019-2033 (Base Year: 2025, Forecast Period: 2025-2033), this report serves as an invaluable resource for industry professionals, investors, and stakeholders seeking to understand and capitalize on the opportunities within this dynamic sector. The total market size in 2025 is estimated at XX Million Units.
Acaricides Industry Market Dynamics & Structure
This section analyzes the competitive landscape of the Acaricides industry, examining market concentration, technological advancements, regulatory frameworks, and market trends. The analysis covers the period from 2019 to 2033, providing valuable insights into the evolution of the market.
Market Concentration: The Acaricides market exhibits a moderately concentrated structure, with key players such as FMC Corporation, Syngenta International AG, Bayer CropScience, and BASF SE holding significant market share. The combined market share of the top five players is estimated to be around 60% in 2025.
Technological Innovation: Ongoing research and development efforts focused on developing more effective and environmentally friendly acaricides are driving innovation. This includes the development of novel chemical formulations and biological control methods. Innovation barriers include stringent regulatory approvals and high R&D costs.
Regulatory Frameworks: Stringent regulations governing the use and registration of pesticides, including acaricides, vary across different regions, significantly impacting market growth and product availability. Compliance requirements and evolving environmental regulations present ongoing challenges.
Competitive Product Substitutes: Biological control methods and integrated pest management (IPM) strategies are emerging as substitutes, although chemical acaricides still dominate the market.
End-User Demographics: The primary end-users are agricultural producers, focusing on various crops vulnerable to mite infestations. Growth is influenced by factors such as farming practices, crop yields, and pest pressure.
M&A Trends: The Acaricides industry has witnessed a moderate level of M&A activity in recent years, driven by strategies to expand product portfolios and market reach. The number of M&A deals is estimated at XX in the historical period, with a predicted XX for the forecast period.
Acaricides Industry Growth Trends & Insights
This section provides a detailed analysis of the growth trajectory of the Acaricides market, examining market size evolution, adoption rates, technological disruptions, and consumer behavior shifts. Using data from 2019-2024 and projecting to 2033, this section provides a comprehensive view of the market's growth trajectory. The market is expected to witness a CAGR of XX% during the forecast period (2025-2033), driven by factors such as increasing crop production, rising pest infestations, and the adoption of advanced agricultural technologies. Market penetration is expected to reach XX% by 2033. Technological disruptions, such as the development of novel formulations and biological controls, are significantly shaping market adoption rates and growth patterns. Consumer behavior shifts towards environmentally friendly and sustainable solutions are influencing product demand and innovation. Specific details regarding market size in different years are included in the full report.
Dominant Regions, Countries, or Segments in Acaricides Industry
This section identifies the leading regions, countries, and segments within the Acaricides market.
Chemical Type: The Pyrethroids segment holds the largest market share in 2025, driven by its effectiveness and wide applicability. Organophosphates and Carbamates also represent substantial market segments. Other chemical types are expected to experience moderate growth due to ongoing R&D efforts.
Application: The Spray application method dominates the market due to its efficiency and cost-effectiveness. Dipping and hand dressing methods cater to specific needs and crops. Other applications are expected to see niche growth.
Key Drivers: Factors driving growth in specific regions include favorable climatic conditions, increasing agricultural output, and government initiatives promoting sustainable pest management.
Dominance Factors: Market dominance is determined by factors such as crop production patterns, pest prevalence, regulatory frameworks, and availability of products.
Acaricides Industry Product Landscape
The Acaricides market features a diverse range of products, each with unique characteristics and applications. Innovations focus on enhancing efficacy, reducing environmental impact, and improving application methods. New formulations offering improved bioavailability and reduced environmental toxicity are gaining traction. Technological advancements have led to the development of acaricides with targeted modes of action, minimizing the risk to beneficial insects and other non-target organisms. The specific performance metrics for each product vary and are detailed in the full report.
Key Drivers, Barriers & Challenges in Acaricides Industry
Key Drivers:
- Increasing global crop production
- Growing prevalence of mite infestations
- Rising demand for higher crop yields
- Technological advancements in acaricide formulations
Challenges & Restraints:
- Stringent regulatory approvals for new acaricides (estimated xx% approval delay impacting market entry).
- Environmental concerns related to acaricide use
- Development of acaricide resistance in mites
- Fluctuations in raw material prices (estimated xx% price increase impact).
Emerging Opportunities in Acaricides Industry
Emerging opportunities include the development of bio-pesticides and the increasing adoption of integrated pest management (IPM) strategies. Untapped markets in developing countries with growing agricultural sectors present significant opportunities. The evolution of consumer preferences towards environmentally friendly pest control solutions opens up avenues for the development and marketing of sustainable acaricides.
Growth Accelerators in the Acaricides Industry
Technological breakthroughs in acaricide formulation, enabling enhanced efficacy and reduced environmental impact, serve as key growth accelerators. Strategic partnerships between chemical companies and agricultural research institutions foster innovation and product development. Market expansion strategies, focusing on emerging economies with high agricultural potential, contribute to overall market growth.
Key Players Shaping the Acaricides Industry Market
Notable Milestones in Acaricides Industry Sector
- 2021 Q3: Launch of a new pyrethroid-based acaricide by Syngenta International AG.
- 2022 Q1: Acquisition of a smaller acaricide manufacturer by BASF SE.
- 2023 Q2: Regulatory approval of a novel biological acaricide in the European Union. (Further milestones are detailed within the full report)
In-Depth Acaricides Industry Market Outlook
The Acaricides market is poised for significant growth over the next decade, driven by increasing crop production, growing pest pressure, and ongoing innovation in product development. Strategic opportunities lie in the development and commercialization of environmentally friendly acaricides, tailored solutions for specific crop types and pest infestations, and expanded market penetration in developing economies. The long-term outlook remains positive, with consistent growth potential underpinned by fundamental market drivers and technological advancements.
Acaricides Industry Segmentation
- 1. Production Analysis
- 2. Consumption Analysis
- 3. Import Market Analysis (Value & Volume)
- 4. Export Market Analysis (Value & Volume)
- 5. Price Trend Analysis
Acaricides Industry Segmentation By Geography
-
1. North America
- 1.1. United States
- 1.2. Canada
- 1.3. Mexico
-
2. South America
- 2.1. Brazil
- 2.2. Argentina
- 2.3. Rest of South America
-
3. Europe
- 3.1. United Kingdom
- 3.2. Germany
- 3.3. France
- 3.4. Italy
- 3.5. Spain
- 3.6. Russia
- 3.7. Benelux
- 3.8. Nordics
- 3.9. Rest of Europe
-
4. Middle East & Africa
- 4.1. Turkey
- 4.2. Israel
- 4.3. GCC
- 4.4. North Africa
- 4.5. South Africa
- 4.6. Rest of Middle East & Africa
-
5. Asia Pacific
- 5.1. China
- 5.2. India
- 5.3. Japan
- 5.4. South Korea
- 5.5. ASEAN
- 5.6. Oceania
- 5.7. Rest of Asia Pacific
Acaricides Industry Regional Market Share
Geographic Coverage of Acaricides Industry
Acaricides Industry REPORT HIGHLIGHTS
| Aspects | Details |
|---|---|
| Study Period | 2020-2034 |
| Base Year | 2025 |
| Estimated Year | 2026 |
| Forecast Period | 2026-2034 |
| Historical Period | 2020-2025 |
| Growth Rate | CAGR of 5.00% from 2020-2034 |
| Segmentation |
|
Table of Contents
- 1. Introduction
- 1.1. Research Scope
- 1.2. Market Segmentation
- 1.3. Research Methodology
- 1.4. Definitions and Assumptions
- 2. Executive Summary
- 2.1. Introduction
- 3. Market Dynamics
- 3.1. Introduction
- 3.2. Market Drivers
- 3.2.1. Shortage of Skilled Labor; Government Support to Enhance Farm Mechanization
- 3.3. Market Restrains
- 3.3.1. Heavy Initial Procurement Cost and High Expenditure on Maintenance
- 3.4. Market Trends
- 3.4.1. Increasing Demand for Natural Products
- 4. Market Factor Analysis
- 4.1. Porters Five Forces
- 4.2. Supply/Value Chain
- 4.3. PESTEL analysis
- 4.4. Market Entropy
- 4.5. Patent/Trademark Analysis
- 5. Global Acaricides Industry Analysis, Insights and Forecast, 2020-2032
- 5.1. Market Analysis, Insights and Forecast - by Production Analysis
- 5.2. Market Analysis, Insights and Forecast - by Consumption Analysis
- 5.3. Market Analysis, Insights and Forecast - by Import Market Analysis (Value & Volume)
- 5.4. Market Analysis, Insights and Forecast - by Export Market Analysis (Value & Volume)
- 5.5. Market Analysis, Insights and Forecast - by Price Trend Analysis
- 5.6. Market Analysis, Insights and Forecast - by Region
- 5.6.1. North America
- 5.6.2. South America
- 5.6.3. Europe
- 5.6.4. Middle East & Africa
- 5.6.5. Asia Pacific
- 5.1. Market Analysis, Insights and Forecast - by Production Analysis
- 6. North America Acaricides Industry Analysis, Insights and Forecast, 2020-2032
- 6.1. Market Analysis, Insights and Forecast - by Production Analysis
- 6.2. Market Analysis, Insights and Forecast - by Consumption Analysis
- 6.3. Market Analysis, Insights and Forecast - by Import Market Analysis (Value & Volume)
- 6.4. Market Analysis, Insights and Forecast - by Export Market Analysis (Value & Volume)
- 6.5. Market Analysis, Insights and Forecast - by Price Trend Analysis
- 6.1. Market Analysis, Insights and Forecast - by Production Analysis
- 7. South America Acaricides Industry Analysis, Insights and Forecast, 2020-2032
- 7.1. Market Analysis, Insights and Forecast - by Production Analysis
- 7.2. Market Analysis, Insights and Forecast - by Consumption Analysis
- 7.3. Market Analysis, Insights and Forecast - by Import Market Analysis (Value & Volume)
- 7.4. Market Analysis, Insights and Forecast - by Export Market Analysis (Value & Volume)
- 7.5. Market Analysis, Insights and Forecast - by Price Trend Analysis
- 7.1. Market Analysis, Insights and Forecast - by Production Analysis
- 8. Europe Acaricides Industry Analysis, Insights and Forecast, 2020-2032
- 8.1. Market Analysis, Insights and Forecast - by Production Analysis
- 8.2. Market Analysis, Insights and Forecast - by Consumption Analysis
- 8.3. Market Analysis, Insights and Forecast - by Import Market Analysis (Value & Volume)
- 8.4. Market Analysis, Insights and Forecast - by Export Market Analysis (Value & Volume)
- 8.5. Market Analysis, Insights and Forecast - by Price Trend Analysis
- 8.1. Market Analysis, Insights and Forecast - by Production Analysis
- 9. Middle East & Africa Acaricides Industry Analysis, Insights and Forecast, 2020-2032
- 9.1. Market Analysis, Insights and Forecast - by Production Analysis
- 9.2. Market Analysis, Insights and Forecast - by Consumption Analysis
- 9.3. Market Analysis, Insights and Forecast - by Import Market Analysis (Value & Volume)
- 9.4. Market Analysis, Insights and Forecast - by Export Market Analysis (Value & Volume)
- 9.5. Market Analysis, Insights and Forecast - by Price Trend Analysis
- 9.1. Market Analysis, Insights and Forecast - by Production Analysis
- 10. Asia Pacific Acaricides Industry Analysis, Insights and Forecast, 2020-2032
- 10.1. Market Analysis, Insights and Forecast - by Production Analysis
- 10.2. Market Analysis, Insights and Forecast - by Consumption Analysis
- 10.3. Market Analysis, Insights and Forecast - by Import Market Analysis (Value & Volume)
- 10.4. Market Analysis, Insights and Forecast - by Export Market Analysis (Value & Volume)
- 10.5. Market Analysis, Insights and Forecast - by Price Trend Analysis
- 10.1. Market Analysis, Insights and Forecast - by Production Analysis
- 11. Competitive Analysis
- 11.1. Global Market Share Analysis 2025
- 11.2. Company Profiles
- 11.2.1 FMC Corporation
- 11.2.1.1. Overview
- 11.2.1.2. Products
- 11.2.1.3. SWOT Analysis
- 11.2.1.4. Recent Developments
- 11.2.1.5. Financials (Based on Availability)
- 11.2.2 Nissan Chemical Industries Ltd
- 11.2.2.1. Overview
- 11.2.2.2. Products
- 11.2.2.3. SWOT Analysis
- 11.2.2.4. Recent Developments
- 11.2.2.5. Financials (Based on Availability)
- 11.2.3 Syngenta International AG
- 11.2.3.1. Overview
- 11.2.3.2. Products
- 11.2.3.3. SWOT Analysis
- 11.2.3.4. Recent Developments
- 11.2.3.5. Financials (Based on Availability)
- 11.2.4 UPL Limite
- 11.2.4.1. Overview
- 11.2.4.2. Products
- 11.2.4.3. SWOT Analysis
- 11.2.4.4. Recent Developments
- 11.2.4.5. Financials (Based on Availability)
- 11.2.5 Bayer CropScience
- 11.2.5.1. Overview
- 11.2.5.2. Products
- 11.2.5.3. SWOT Analysis
- 11.2.5.4. Recent Developments
- 11.2.5.5. Financials (Based on Availability)
- 11.2.6 Corteva Agriscience
- 11.2.6.1. Overview
- 11.2.6.2. Products
- 11.2.6.3. SWOT Analysis
- 11.2.6.4. Recent Developments
- 11.2.6.5. Financials (Based on Availability)
- 11.2.7 BASF SE
- 11.2.7.1. Overview
- 11.2.7.2. Products
- 11.2.7.3. SWOT Analysis
- 11.2.7.4. Recent Developments
- 11.2.7.5. Financials (Based on Availability)
- 11.2.1 FMC Corporation
List of Figures
- Figure 1: Global Acaricides Industry Revenue Breakdown (Million, %) by Region 2025 & 2033
- Figure 2: North America Acaricides Industry Revenue (Million), by Production Analysis 2025 & 2033
- Figure 3: North America Acaricides Industry Revenue Share (%), by Production Analysis 2025 & 2033
- Figure 4: North America Acaricides Industry Revenue (Million), by Consumption Analysis 2025 & 2033
- Figure 5: North America Acaricides Industry Revenue Share (%), by Consumption Analysis 2025 & 2033
- Figure 6: North America Acaricides Industry Revenue (Million), by Import Market Analysis (Value & Volume) 2025 & 2033
- Figure 7: North America Acaricides Industry Revenue Share (%), by Import Market Analysis (Value & Volume) 2025 & 2033
- Figure 8: North America Acaricides Industry Revenue (Million), by Export Market Analysis (Value & Volume) 2025 & 2033
- Figure 9: North America Acaricides Industry Revenue Share (%), by Export Market Analysis (Value & Volume) 2025 & 2033
- Figure 10: North America Acaricides Industry Revenue (Million), by Price Trend Analysis 2025 & 2033
- Figure 11: North America Acaricides Industry Revenue Share (%), by Price Trend Analysis 2025 & 2033
- Figure 12: North America Acaricides Industry Revenue (Million), by Country 2025 & 2033
- Figure 13: North America Acaricides Industry Revenue Share (%), by Country 2025 & 2033
- Figure 14: South America Acaricides Industry Revenue (Million), by Production Analysis 2025 & 2033
- Figure 15: South America Acaricides Industry Revenue Share (%), by Production Analysis 2025 & 2033
- Figure 16: South America Acaricides Industry Revenue (Million), by Consumption Analysis 2025 & 2033
- Figure 17: South America Acaricides Industry Revenue Share (%), by Consumption Analysis 2025 & 2033
- Figure 18: South America Acaricides Industry Revenue (Million), by Import Market Analysis (Value & Volume) 2025 & 2033
- Figure 19: South America Acaricides Industry Revenue Share (%), by Import Market Analysis (Value & Volume) 2025 & 2033
- Figure 20: South America Acaricides Industry Revenue (Million), by Export Market Analysis (Value & Volume) 2025 & 2033
- Figure 21: South America Acaricides Industry Revenue Share (%), by Export Market Analysis (Value & Volume) 2025 & 2033
- Figure 22: South America Acaricides Industry Revenue (Million), by Price Trend Analysis 2025 & 2033
- Figure 23: South America Acaricides Industry Revenue Share (%), by Price Trend Analysis 2025 & 2033
- Figure 24: South America Acaricides Industry Revenue (Million), by Country 2025 & 2033
- Figure 25: South America Acaricides Industry Revenue Share (%), by Country 2025 & 2033
- Figure 26: Europe Acaricides Industry Revenue (Million), by Production Analysis 2025 & 2033
- Figure 27: Europe Acaricides Industry Revenue Share (%), by Production Analysis 2025 & 2033
- Figure 28: Europe Acaricides Industry Revenue (Million), by Consumption Analysis 2025 & 2033
- Figure 29: Europe Acaricides Industry Revenue Share (%), by Consumption Analysis 2025 & 2033
- Figure 30: Europe Acaricides Industry Revenue (Million), by Import Market Analysis (Value & Volume) 2025 & 2033
- Figure 31: Europe Acaricides Industry Revenue Share (%), by Import Market Analysis (Value & Volume) 2025 & 2033
- Figure 32: Europe Acaricides Industry Revenue (Million), by Export Market Analysis (Value & Volume) 2025 & 2033
- Figure 33: Europe Acaricides Industry Revenue Share (%), by Export Market Analysis (Value & Volume) 2025 & 2033
- Figure 34: Europe Acaricides Industry Revenue (Million), by Price Trend Analysis 2025 & 2033
- Figure 35: Europe Acaricides Industry Revenue Share (%), by Price Trend Analysis 2025 & 2033
- Figure 36: Europe Acaricides Industry Revenue (Million), by Country 2025 & 2033
- Figure 37: Europe Acaricides Industry Revenue Share (%), by Country 2025 & 2033
- Figure 38: Middle East & Africa Acaricides Industry Revenue (Million), by Production Analysis 2025 & 2033
- Figure 39: Middle East & Africa Acaricides Industry Revenue Share (%), by Production Analysis 2025 & 2033
- Figure 40: Middle East & Africa Acaricides Industry Revenue (Million), by Consumption Analysis 2025 & 2033
- Figure 41: Middle East & Africa Acaricides Industry Revenue Share (%), by Consumption Analysis 2025 & 2033
- Figure 42: Middle East & Africa Acaricides Industry Revenue (Million), by Import Market Analysis (Value & Volume) 2025 & 2033
- Figure 43: Middle East & Africa Acaricides Industry Revenue Share (%), by Import Market Analysis (Value & Volume) 2025 & 2033
- Figure 44: Middle East & Africa Acaricides Industry Revenue (Million), by Export Market Analysis (Value & Volume) 2025 & 2033
- Figure 45: Middle East & Africa Acaricides Industry Revenue Share (%), by Export Market Analysis (Value & Volume) 2025 & 2033
- Figure 46: Middle East & Africa Acaricides Industry Revenue (Million), by Price Trend Analysis 2025 & 2033
- Figure 47: Middle East & Africa Acaricides Industry Revenue Share (%), by Price Trend Analysis 2025 & 2033
- Figure 48: Middle East & Africa Acaricides Industry Revenue (Million), by Country 2025 & 2033
- Figure 49: Middle East & Africa Acaricides Industry Revenue Share (%), by Country 2025 & 2033
- Figure 50: Asia Pacific Acaricides Industry Revenue (Million), by Production Analysis 2025 & 2033
- Figure 51: Asia Pacific Acaricides Industry Revenue Share (%), by Production Analysis 2025 & 2033
- Figure 52: Asia Pacific Acaricides Industry Revenue (Million), by Consumption Analysis 2025 & 2033
- Figure 53: Asia Pacific Acaricides Industry Revenue Share (%), by Consumption Analysis 2025 & 2033
- Figure 54: Asia Pacific Acaricides Industry Revenue (Million), by Import Market Analysis (Value & Volume) 2025 & 2033
- Figure 55: Asia Pacific Acaricides Industry Revenue Share (%), by Import Market Analysis (Value & Volume) 2025 & 2033
- Figure 56: Asia Pacific Acaricides Industry Revenue (Million), by Export Market Analysis (Value & Volume) 2025 & 2033
- Figure 57: Asia Pacific Acaricides Industry Revenue Share (%), by Export Market Analysis (Value & Volume) 2025 & 2033
- Figure 58: Asia Pacific Acaricides Industry Revenue (Million), by Price Trend Analysis 2025 & 2033
- Figure 59: Asia Pacific Acaricides Industry Revenue Share (%), by Price Trend Analysis 2025 & 2033
- Figure 60: Asia Pacific Acaricides Industry Revenue (Million), by Country 2025 & 2033
- Figure 61: Asia Pacific Acaricides Industry Revenue Share (%), by Country 2025 & 2033
List of Tables
- Table 1: Global Acaricides Industry Revenue Million Forecast, by Production Analysis 2020 & 2033
- Table 2: Global Acaricides Industry Revenue Million Forecast, by Consumption Analysis 2020 & 2033
- Table 3: Global Acaricides Industry Revenue Million Forecast, by Import Market Analysis (Value & Volume) 2020 & 2033
- Table 4: Global Acaricides Industry Revenue Million Forecast, by Export Market Analysis (Value & Volume) 2020 & 2033
- Table 5: Global Acaricides Industry Revenue Million Forecast, by Price Trend Analysis 2020 & 2033
- Table 6: Global Acaricides Industry Revenue Million Forecast, by Region 2020 & 2033
- Table 7: Global Acaricides Industry Revenue Million Forecast, by Production Analysis 2020 & 2033
- Table 8: Global Acaricides Industry Revenue Million Forecast, by Consumption Analysis 2020 & 2033
- Table 9: Global Acaricides Industry Revenue Million Forecast, by Import Market Analysis (Value & Volume) 2020 & 2033
- Table 10: Global Acaricides Industry Revenue Million Forecast, by Export Market Analysis (Value & Volume) 2020 & 2033
- Table 11: Global Acaricides Industry Revenue Million Forecast, by Price Trend Analysis 2020 & 2033
- Table 12: Global Acaricides Industry Revenue Million Forecast, by Country 2020 & 2033
- Table 13: United States Acaricides Industry Revenue (Million) Forecast, by Application 2020 & 2033
- Table 14: Canada Acaricides Industry Revenue (Million) Forecast, by Application 2020 & 2033
- Table 15: Mexico Acaricides Industry Revenue (Million) Forecast, by Application 2020 & 2033
- Table 16: Global Acaricides Industry Revenue Million Forecast, by Production Analysis 2020 & 2033
- Table 17: Global Acaricides Industry Revenue Million Forecast, by Consumption Analysis 2020 & 2033
- Table 18: Global Acaricides Industry Revenue Million Forecast, by Import Market Analysis (Value & Volume) 2020 & 2033
- Table 19: Global Acaricides Industry Revenue Million Forecast, by Export Market Analysis (Value & Volume) 2020 & 2033
- Table 20: Global Acaricides Industry Revenue Million Forecast, by Price Trend Analysis 2020 & 2033
- Table 21: Global Acaricides Industry Revenue Million Forecast, by Country 2020 & 2033
- Table 22: Brazil Acaricides Industry Revenue (Million) Forecast, by Application 2020 & 2033
- Table 23: Argentina Acaricides Industry Revenue (Million) Forecast, by Application 2020 & 2033
- Table 24: Rest of South America Acaricides Industry Revenue (Million) Forecast, by Application 2020 & 2033
- Table 25: Global Acaricides Industry Revenue Million Forecast, by Production Analysis 2020 & 2033
- Table 26: Global Acaricides Industry Revenue Million Forecast, by Consumption Analysis 2020 & 2033
- Table 27: Global Acaricides Industry Revenue Million Forecast, by Import Market Analysis (Value & Volume) 2020 & 2033
- Table 28: Global Acaricides Industry Revenue Million Forecast, by Export Market Analysis (Value & Volume) 2020 & 2033
- Table 29: Global Acaricides Industry Revenue Million Forecast, by Price Trend Analysis 2020 & 2033
- Table 30: Global Acaricides Industry Revenue Million Forecast, by Country 2020 & 2033
- Table 31: United Kingdom Acaricides Industry Revenue (Million) Forecast, by Application 2020 & 2033
- Table 32: Germany Acaricides Industry Revenue (Million) Forecast, by Application 2020 & 2033
- Table 33: France Acaricides Industry Revenue (Million) Forecast, by Application 2020 & 2033
- Table 34: Italy Acaricides Industry Revenue (Million) Forecast, by Application 2020 & 2033
- Table 35: Spain Acaricides Industry Revenue (Million) Forecast, by Application 2020 & 2033
- Table 36: Russia Acaricides Industry Revenue (Million) Forecast, by Application 2020 & 2033
- Table 37: Benelux Acaricides Industry Revenue (Million) Forecast, by Application 2020 & 2033
- Table 38: Nordics Acaricides Industry Revenue (Million) Forecast, by Application 2020 & 2033
- Table 39: Rest of Europe Acaricides Industry Revenue (Million) Forecast, by Application 2020 & 2033
- Table 40: Global Acaricides Industry Revenue Million Forecast, by Production Analysis 2020 & 2033
- Table 41: Global Acaricides Industry Revenue Million Forecast, by Consumption Analysis 2020 & 2033
- Table 42: Global Acaricides Industry Revenue Million Forecast, by Import Market Analysis (Value & Volume) 2020 & 2033
- Table 43: Global Acaricides Industry Revenue Million Forecast, by Export Market Analysis (Value & Volume) 2020 & 2033
- Table 44: Global Acaricides Industry Revenue Million Forecast, by Price Trend Analysis 2020 & 2033
- Table 45: Global Acaricides Industry Revenue Million Forecast, by Country 2020 & 2033
- Table 46: Turkey Acaricides Industry Revenue (Million) Forecast, by Application 2020 & 2033
- Table 47: Israel Acaricides Industry Revenue (Million) Forecast, by Application 2020 & 2033
- Table 48: GCC Acaricides Industry Revenue (Million) Forecast, by Application 2020 & 2033
- Table 49: North Africa Acaricides Industry Revenue (Million) Forecast, by Application 2020 & 2033
- Table 50: South Africa Acaricides Industry Revenue (Million) Forecast, by Application 2020 & 2033
- Table 51: Rest of Middle East & Africa Acaricides Industry Revenue (Million) Forecast, by Application 2020 & 2033
- Table 52: Global Acaricides Industry Revenue Million Forecast, by Production Analysis 2020 & 2033
- Table 53: Global Acaricides Industry Revenue Million Forecast, by Consumption Analysis 2020 & 2033
- Table 54: Global Acaricides Industry Revenue Million Forecast, by Import Market Analysis (Value & Volume) 2020 & 2033
- Table 55: Global Acaricides Industry Revenue Million Forecast, by Export Market Analysis (Value & Volume) 2020 & 2033
- Table 56: Global Acaricides Industry Revenue Million Forecast, by Price Trend Analysis 2020 & 2033
- Table 57: Global Acaricides Industry Revenue Million Forecast, by Country 2020 & 2033
- Table 58: China Acaricides Industry Revenue (Million) Forecast, by Application 2020 & 2033
- Table 59: India Acaricides Industry Revenue (Million) Forecast, by Application 2020 & 2033
- Table 60: Japan Acaricides Industry Revenue (Million) Forecast, by Application 2020 & 2033
- Table 61: South Korea Acaricides Industry Revenue (Million) Forecast, by Application 2020 & 2033
- Table 62: ASEAN Acaricides Industry Revenue (Million) Forecast, by Application 2020 & 2033
- Table 63: Oceania Acaricides Industry Revenue (Million) Forecast, by Application 2020 & 2033
- Table 64: Rest of Asia Pacific Acaricides Industry Revenue (Million) Forecast, by Application 2020 & 2033
Frequently Asked Questions
1. What is the projected Compound Annual Growth Rate (CAGR) of the Acaricides Industry?
The projected CAGR is approximately 5.00%.
2. Which companies are prominent players in the Acaricides Industry?
Key companies in the market include FMC Corporation, Nissan Chemical Industries Ltd, Syngenta International AG, UPL Limite, Bayer CropScience, Corteva Agriscience, BASF SE.
3. What are the main segments of the Acaricides Industry?
The market segments include Production Analysis, Consumption Analysis, Import Market Analysis (Value & Volume), Export Market Analysis (Value & Volume), Price Trend Analysis.
4. Can you provide details about the market size?
The market size is estimated to be USD 369.34 Million as of 2022.
5. What are some drivers contributing to market growth?
Shortage of Skilled Labor; Government Support to Enhance Farm Mechanization.
6. What are the notable trends driving market growth?
Increasing Demand for Natural Products.
7. Are there any restraints impacting market growth?
Heavy Initial Procurement Cost and High Expenditure on Maintenance.
8. Can you provide examples of recent developments in the market?
N/A
9. What pricing options are available for accessing the report?
Pricing options include single-user, multi-user, and enterprise licenses priced at USD 4750, USD 5250, and USD 8750 respectively.
10. Is the market size provided in terms of value or volume?
The market size is provided in terms of value, measured in Million.
11. Are there any specific market keywords associated with the report?
Yes, the market keyword associated with the report is "Acaricides Industry," which aids in identifying and referencing the specific market segment covered.
12. How do I determine which pricing option suits my needs best?
The pricing options vary based on user requirements and access needs. Individual users may opt for single-user licenses, while businesses requiring broader access may choose multi-user or enterprise licenses for cost-effective access to the report.
13. Are there any additional resources or data provided in the Acaricides Industry report?
While the report offers comprehensive insights, it's advisable to review the specific contents or supplementary materials provided to ascertain if additional resources or data are available.
14. How can I stay updated on further developments or reports in the Acaricides Industry?
To stay informed about further developments, trends, and reports in the Acaricides Industry, consider subscribing to industry newsletters, following relevant companies and organizations, or regularly checking reputable industry news sources and publications.
Methodology
Step 1 - Identification of Relevant Samples Size from Population Database


Step 2 - Approaches for Defining Global Market Size (Value, Volume* & Price*)

Note*: In applicable scenarios
Step 3 - Data Sources
Primary Research
- Web Analytics
- Survey Reports
- Research Institute
- Latest Research Reports
- Opinion Leaders
Secondary Research
- Annual Reports
- White Paper
- Latest Press Release
- Industry Association
- Paid Database
- Investor Presentations

Step 4 - Data Triangulation
Involves using different sources of information in order to increase the validity of a study
These sources are likely to be stakeholders in a program - participants, other researchers, program staff, other community members, and so on.
Then we put all data in single framework & apply various statistical tools to find out the dynamic on the market.
During the analysis stage, feedback from the stakeholder groups would be compared to determine areas of agreement as well as areas of divergence