

Key Insights
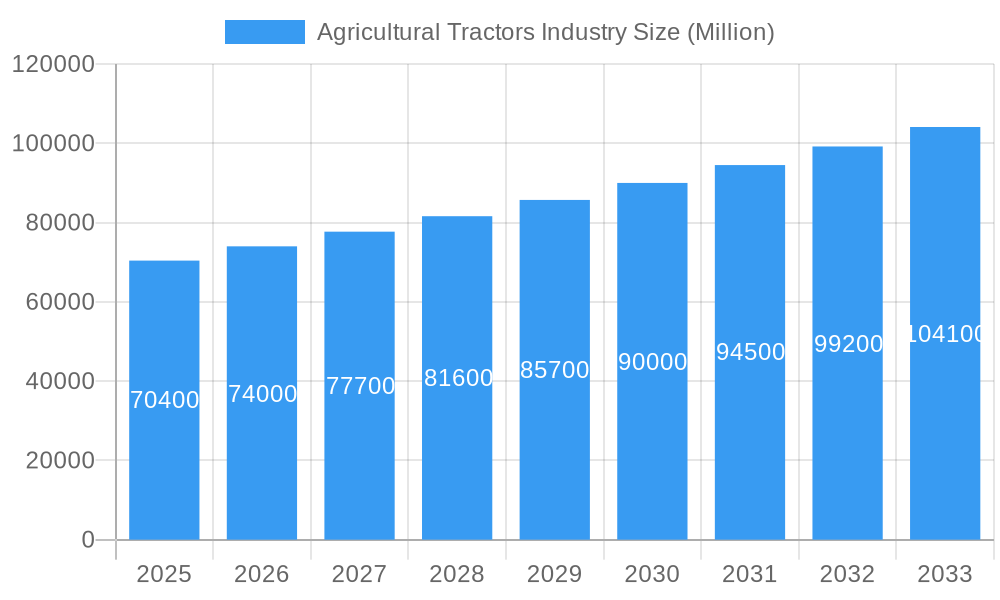
The global agricultural tractors market is poised for robust expansion, projected to reach a significant valuation of USD 70.40 billion in 2025. This growth is underpinned by a Compound Annual Growth Rate (CAGR) of 5.20%, indicating a healthy and sustained upward trajectory throughout the forecast period ending in 2033. This expansion is driven by several key factors. Foremost among these is the increasing global demand for food production, necessitating greater efficiency and mechanization in agriculture to feed a growing population. Advancements in agricultural technology, including the development of smarter, more fuel-efficient, and automated tractors, are also playing a crucial role. Furthermore, government initiatives and subsidies aimed at promoting modern farming practices and supporting farmers are further stimulating market demand. The rising adoption of precision agriculture techniques, which rely heavily on advanced tractor technology for tasks like planting, fertilizing, and harvesting with optimal resource utilization, is another significant growth driver. Emerging economies, with their expanding agricultural sectors and increasing investments in farm modernization, are expected to contribute substantially to this market’s growth.
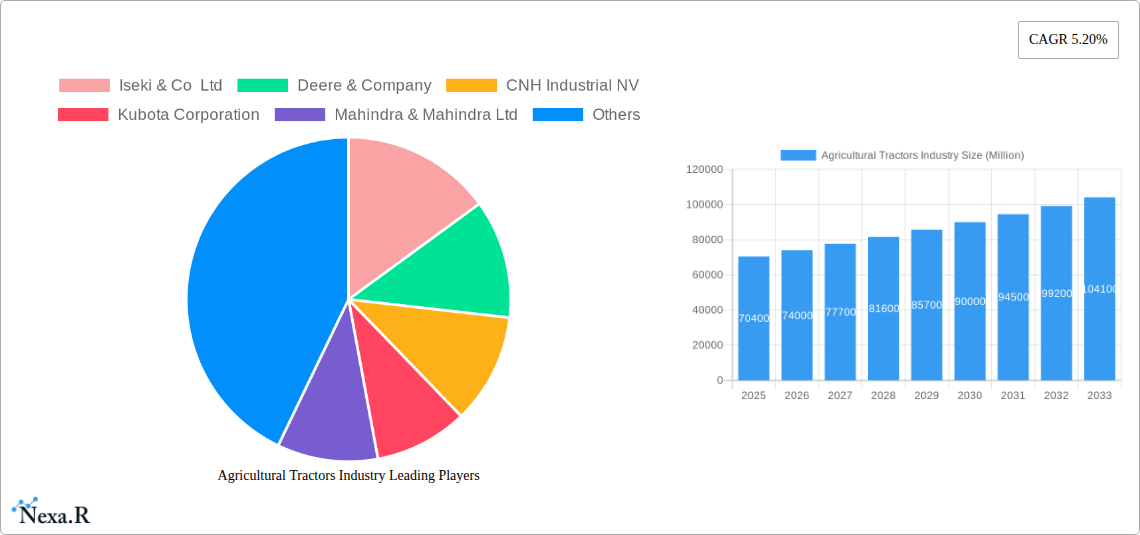
Agricultural Tractors Industry Market Size (In Billion)
Despite the positive outlook, certain restraints could temper the market's full potential. The high initial cost of advanced agricultural tractors can be a significant barrier for smallholder farmers, particularly in developing regions. Fluctuations in raw material prices, such as steel and components, can impact manufacturing costs and, consequently, tractor prices. Stringent environmental regulations concerning emissions and fuel efficiency may necessitate additional investment in research and development for manufacturers, potentially leading to higher product costs. However, the overarching trend towards sustainable and efficient farming practices, coupled with the continuous innovation in tractor technology, is expected to outweigh these challenges. The market is segmented across various production and consumption analyses, import/export dynamics, and price trends, all of which will be influenced by regional specificities and the competitive landscape dominated by major players like John Deere, Kubota, and Mahindra & Mahindra. The strategic focus on enhancing agricultural productivity and addressing global food security concerns will continue to shape the trajectory of this vital industry.
Agricultural Tractors Industry Company Market Share
Comprehensive Report on the Global Agricultural Tractors Market: Dynamics, Trends, and Future Outlook (2019-2033)
This in-depth report provides a holistic analysis of the global agricultural tractors industry, covering market dynamics, growth trends, regional dominance, product landscape, key drivers, challenges, emerging opportunities, and a detailed outlook for the period 2019–2033, with a base and estimated year of 2025 and a forecast period of 2025–2033. The report meticulously examines parent and child markets, offering crucial insights for stakeholders, manufacturers, and investors. All values are presented in Million units.
Agricultural Tractors Industry Market Dynamics & Structure
The global agricultural tractors market is characterized by a moderate to high level of concentration, with a few dominant players controlling significant market share. Technological innovation is a primary driver, fueled by the demand for enhanced efficiency, reduced labor costs, and sustainable farming practices. Autonomous and smart tractor technologies, precision agriculture integration, and electric powertrain advancements are at the forefront of R&D efforts. Regulatory frameworks, particularly concerning emissions standards and agricultural subsidies, play a pivotal role in shaping market dynamics. Competitive product substitutes, such as advanced harvesters and specialized machinery, exist but are largely complementary rather than direct replacements for core tractor functions. End-user demographics are shifting, with an increasing adoption by smallholder farmers in emerging economies alongside the continued demand from large-scale agricultural enterprises. Mergers and acquisitions (M&A) trends are prevalent as companies seek to expand their product portfolios, geographical reach, and technological capabilities. For instance, a notable M&A deal volume of xx million units was observed in the historical period, indicating consolidation within the industry. Innovation barriers include high R&D costs, the need for extensive field testing, and the complexity of integrating new technologies into existing farming infrastructure.
- Market Concentration: Dominated by key manufacturers with strategic partnerships and global supply chains.
- Technological Innovation Drivers: Demand for increased productivity, fuel efficiency, automation, and precision farming solutions.
- Regulatory Frameworks: Stringent emission norms, government subsidies for farm mechanization, and trade policies influencing market access.
- Competitive Product Substitutes: While limited, include specialized farm equipment and advancements in alternative tillage methods.
- End-User Demographics: Growing demand from both large-scale commercial farms and increasingly mechanized smallholder farms in developing regions.
- M&A Trends: Strategic acquisitions to gain market share, acquire innovative technologies, and expand product offerings.
Agricultural Tractors Industry Growth Trends & Insights
The agricultural tractors market is poised for robust growth, driven by the increasing global demand for food and the continuous need for enhanced agricultural productivity. The market size evolution projects a compound annual growth rate (CAGR) of xx% from 2025 to 2033, reaching an estimated market value of $xxx billion by the end of the forecast period. Adoption rates are steadily increasing, particularly in developing economies where mechanization is crucial for improving yields and reducing reliance on manual labor. Technological disruptions, such as the integration of GPS, IoT sensors, and artificial intelligence, are transforming tractor capabilities, enabling data-driven farming and optimizing resource utilization. Consumer behavior shifts are evident, with farmers increasingly seeking durable, fuel-efficient, and technologically advanced tractors that offer a strong return on investment. The penetration of smart farming technologies is expected to rise significantly, influencing purchasing decisions towards tractors equipped with telematics and precision agriculture features. Market penetration is projected to reach xx% by 2033, indicating a strong uptake of modern agricultural machinery.
Dominant Regions, Countries, or Segments in Agricultural Tractors Industry
The Asia-Pacific region is projected to be the dominant force in the global agricultural tractors industry throughout the study period. This dominance is fueled by several interconnected factors. China and India stand out as key countries within this region, exhibiting substantial growth in both production and consumption.
- Production Analysis: The region benefits from a strong manufacturing base, with several global players establishing production facilities to cater to the vast domestic demand and for export purposes. Low labor costs and government support for domestic manufacturing contribute to this strength.
- Consumption Analysis: The sheer size of the agricultural sector in Asia-Pacific, coupled with the growing need for food security and modernization of farming practices, drives immense consumption. The increasing disposable income of farmers and government initiatives to promote farm mechanization further bolster demand. The region is expected to account for over xx% of global tractor consumption by 2033.
- Import Market Analysis (Value & Volume): While a significant producer, the region also experiences substantial imports, particularly of high-horsepower and specialized tractors, catering to the evolving needs of large-scale commercial farming operations. Import volumes are estimated to reach xx million units by 2033, with a value of $xxx million.
- Export Market Analysis (Value & Volume): The Asia-Pacific region is also a major exporter of agricultural tractors, especially to other developing economies in Africa and Latin America. Competitive pricing and increasing quality standards make these exports highly sought after. Export volumes are predicted to reach xx million units, valued at $xxx million annually.
- Price Trend Analysis: Price trends in this region are influenced by local manufacturing capabilities, raw material costs, and the competitive landscape. While generally more price-sensitive, there is a growing segment willing to pay a premium for advanced technology.
- Dominance Factors:
- Economic Policies: Government initiatives promoting agriculture, subsidies for farm mechanization, and favorable trade policies.
- Infrastructure Development: Investments in rural infrastructure and agricultural R&D.
- Market Share and Growth Potential: The immense agricultural landmass and the substantial proportion of the population dependent on agriculture ensure a sustained and growing demand for tractors.
Agricultural Tractors Industry Product Landscape
The agricultural tractors industry is witnessing a surge in product innovations focused on enhancing efficiency, sustainability, and operator comfort. Key advancements include the development of smart tractors equipped with GPS guidance, telematics, and autonomous capabilities, allowing for precise fieldwork and reduced labor requirements. The introduction of electric and hybrid powertrain technologies is gaining momentum, offering reduced emissions and lower operating costs. Furthermore, manufacturers are emphasizing the development of versatile tractors catering to a wide range of applications, from tilling and planting to harvesting and material handling. High-horsepower tractors with advanced hydraulic systems and improved fuel efficiency are essential for large-scale farming operations, while compact and sub-30 HP tractors are crucial for smaller farms and specialized tasks. Performance metrics such as fuel efficiency, torque, traction, and durability remain critical selling points.
Key Drivers, Barriers & Challenges in Agricultural Tractors Industry
Key Drivers:
- Growing Global Food Demand: A rapidly expanding global population necessitates increased agricultural output, driving the need for efficient mechanization.
- Technological Advancements: Innovations in precision agriculture, automation, and smart farming technologies are enhancing tractor utility and efficiency.
- Government Support & Subsidies: Favorable policies, subsidies, and incentives for farm mechanization in many countries boost demand.
- Labor Shortages and Rising Labor Costs: Mechanization offers a solution to the declining agricultural workforce and escalating labor expenses.
Barriers & Challenges:
- High Initial Investment Costs: Tractors represent a significant capital expenditure, posing a barrier for smallholder farmers in developing economies.
- Infrastructure Limitations: Inadequate rural infrastructure, including poor road networks and limited access to electricity, can hinder adoption and servicing.
- Skilled Labor Shortage for Operation & Maintenance: Operating and maintaining advanced tractors requires skilled personnel, which can be scarce in some regions.
- Supply Chain Disruptions: Global supply chain volatility, impacting component availability and lead times, can affect production and pricing.
- Regulatory Hurdles: Stringent emission standards and evolving safety regulations can increase manufacturing costs and product complexity.
Emerging Opportunities in Agricultural Tractors Industry
Emerging opportunities lie in the development of affordable and accessible smart tractor solutions for smallholder farmers, leveraging IoT and mobile technology. The growing demand for sustainable and electric tractors presents a significant untapped market, driven by environmental concerns and rising fuel prices. Furthermore, the expansion of autonomous and semi-autonomous tractor technology for specific applications like targeted spraying and harvesting offers substantial growth potential. There is also an increasing focus on rental and sharing models for agricultural machinery, particularly in regions where outright ownership is challenging, creating new service-based revenue streams.
Growth Accelerators in the Agricultural Tractors Industry Industry
Long-term growth in the agricultural tractors industry will be significantly accelerated by ongoing technological breakthroughs, particularly in artificial intelligence and robotics for fully autonomous farming operations. Strategic partnerships between technology providers and tractor manufacturers will be crucial in integrating cutting-edge innovations. Market expansion into underserved emerging economies, focusing on adapting products to local needs and affordability, will unlock substantial growth. The increasing emphasis on data analytics and farm management software integration will also drive demand for tractors that can seamlessly collect and transmit crucial field data, further enhancing their value proposition.
Key Players Shaping the Agricultural Tractors Industry Market
- Iseki & Co Ltd
- Deere & Company
- CNH Industrial NV
- Kubota Corporation
- Mahindra & Mahindra Ltd
- Claas KGaA mbH
- Tractors and Farm Equipment Ltd
- AGCO Corporation (Massey Ferguson Limited)
- Yanmar Holdings Co Ltd
Notable Milestones in Agricultural Tractors Industry Sector
- November 2022: VST Tillers Tractors Ltd and ZETOR TRACTORS unveiled two best-in-class tractors (45 HP and 50 HP) at the CII Agro Tech India 2022 exhibition, jointly developed at their India & Czech Republic plants.
- July 2021: New Holland North America launched the T7 Heavy-duty Tractor with PLM Intelligence, enhancing farmer productivity and multitasking capabilities in various field and transport applications.
- June 2022: Solis Yanmar company launched three new tractor models in the below 30 HP category for Turkish farms, with exports originating from India.
In-Depth Agricultural Tractors Industry Market Outlook
The future of the agricultural tractors industry is exceptionally promising, driven by a confluence of technological advancements and evolving agricultural imperatives. The sustained global demand for food, coupled with the ongoing need to optimize farming efficiency and sustainability, will continue to be the bedrock of market expansion. The integration of AI, robotics, and advanced telematics is poised to transform tractors into intelligent farm management hubs, offering unparalleled precision and automation. Emerging markets represent a significant frontier for growth, with tailored solutions and accessible financing models expected to drive adoption. Furthermore, the increasing environmental consciousness and regulatory pressures will accelerate the shift towards electric and alternative fuel powertrains, opening up new avenues for innovation and market differentiation. Strategic collaborations and a focus on user-centric design will be pivotal in capitalizing on these future market potentials.
Agricultural Tractors Industry Segmentation
- 1. Production Analysis
- 2. Consumption Analysis
- 3. Import Market Analysis (Value & Volume)
- 4. Export Market Analysis (Value & Volume)
- 5. Price Trend Analysis
Agricultural Tractors Industry Segmentation By Geography
-
1. North America
- 1.1. United States
- 1.2. Canada
- 1.3. Mexico
-
2. South America
- 2.1. Brazil
- 2.2. Argentina
- 2.3. Rest of South America
-
3. Europe
- 3.1. United Kingdom
- 3.2. Germany
- 3.3. France
- 3.4. Italy
- 3.5. Spain
- 3.6. Russia
- 3.7. Benelux
- 3.8. Nordics
- 3.9. Rest of Europe
-
4. Middle East & Africa
- 4.1. Turkey
- 4.2. Israel
- 4.3. GCC
- 4.4. North Africa
- 4.5. South Africa
- 4.6. Rest of Middle East & Africa
-
5. Asia Pacific
- 5.1. China
- 5.2. India
- 5.3. Japan
- 5.4. South Korea
- 5.5. ASEAN
- 5.6. Oceania
- 5.7. Rest of Asia Pacific
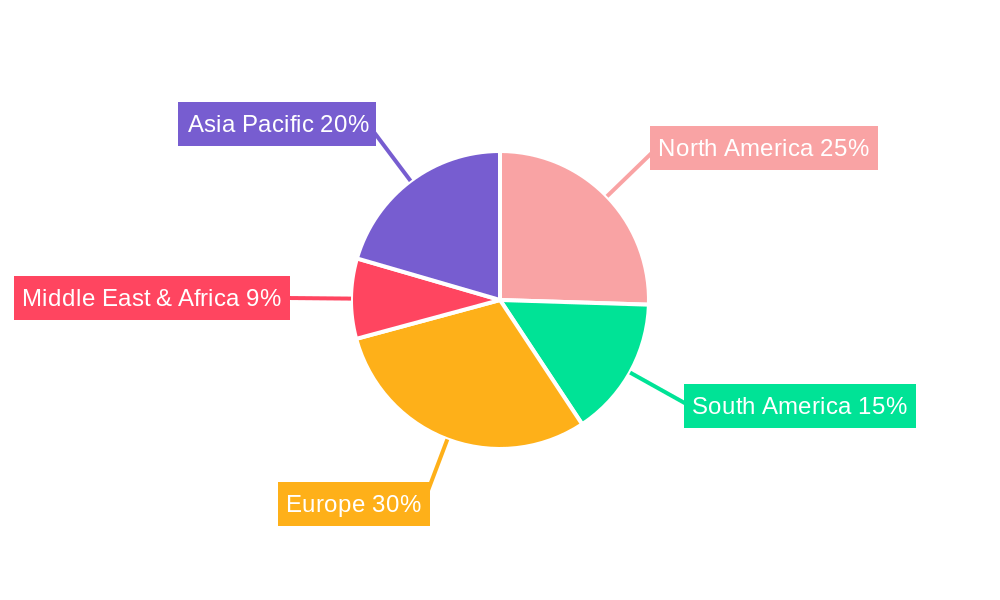
Agricultural Tractors Industry Regional Market Share
Geographic Coverage of Agricultural Tractors Industry
Agricultural Tractors Industry REPORT HIGHLIGHTS
| Aspects | Details |
|---|---|
| Study Period | 2020-2034 |
| Base Year | 2025 |
| Estimated Year | 2026 |
| Forecast Period | 2026-2034 |
| Historical Period | 2020-2025 |
| Growth Rate | CAGR of 5.20% from 2020-2034 |
| Segmentation |
|
Table of Contents
- 1. Introduction
- 1.1. Research Scope
- 1.2. Market Segmentation
- 1.3. Research Objective
- 1.4. Definitions and Assumptions
- 2. Executive Summary
- 2.1. Market Snapshot
- 3. Market Dynamics
- 3.1. Market Drivers
- 3.2. Market Restrains
- 3.3. Market Trends
- 3.4. Market Opportunities
- 4. Market Factor Analysis
- 4.1. Porters Five Forces
- 4.1.1. Bargaining Power of Suppliers
- 4.1.2. Bargaining Power of Buyers
- 4.1.3. Threat of New Entrants
- 4.1.4. Threat of Substitutes
- 4.1.5. Competitive Rivalry
- 4.2. PESTEL analysis
- 4.3. BCG Analysis
- 4.3.1. Stars (High Growth, High Market Share)
- 4.3.2. Cash Cows (Low Growth, High Market Share)
- 4.3.3. Question Mark (High Growth, Low Market Share)
- 4.3.4. Dogs (Low Growth, Low Market Share)
- 4.4. Ansoff Matrix Analysis
- 4.5. Supply Chain Analysis
- 4.6. Regulatory Landscape
- 4.7. Current Market Potential and Opportunity Assessment (TAM–SAM–SOM Framework)
- 4.8. NRP Analyst Note
- 4.1. Porters Five Forces
- 5. Market Analysis, Insights and Forecast 2021-2033
- 5.1. Market Analysis, Insights and Forecast - by Production Analysis
- 5.2. Market Analysis, Insights and Forecast - by Consumption Analysis
- 5.3. Market Analysis, Insights and Forecast - by Import Market Analysis (Value & Volume)
- 5.4. Market Analysis, Insights and Forecast - by Export Market Analysis (Value & Volume)
- 5.5. Market Analysis, Insights and Forecast - by Price Trend Analysis
- 5.6. Market Analysis, Insights and Forecast - by Region
- 5.6.1. North America
- 5.6.2. South America
- 5.6.3. Europe
- 5.6.4. Middle East & Africa
- 5.6.5. Asia Pacific
- 6. Global Agricultural Tractors Industry Analysis, Insights and Forecast, 2021-2033
- 6.1. Market Analysis, Insights and Forecast - by Production Analysis
- 6.2. Market Analysis, Insights and Forecast - by Consumption Analysis
- 6.3. Market Analysis, Insights and Forecast - by Import Market Analysis (Value & Volume)
- 6.4. Market Analysis, Insights and Forecast - by Export Market Analysis (Value & Volume)
- 6.5. Market Analysis, Insights and Forecast - by Price Trend Analysis
- 7. North America Agricultural Tractors Industry Analysis, Insights and Forecast, 2020-2032
- 7.1. Market Analysis, Insights and Forecast - by Production Analysis
- 7.2. Market Analysis, Insights and Forecast - by Consumption Analysis
- 7.3. Market Analysis, Insights and Forecast - by Import Market Analysis (Value & Volume)
- 7.4. Market Analysis, Insights and Forecast - by Export Market Analysis (Value & Volume)
- 7.5. Market Analysis, Insights and Forecast - by Price Trend Analysis
- 8. South America Agricultural Tractors Industry Analysis, Insights and Forecast, 2020-2032
- 8.1. Market Analysis, Insights and Forecast - by Production Analysis
- 8.2. Market Analysis, Insights and Forecast - by Consumption Analysis
- 8.3. Market Analysis, Insights and Forecast - by Import Market Analysis (Value & Volume)
- 8.4. Market Analysis, Insights and Forecast - by Export Market Analysis (Value & Volume)
- 8.5. Market Analysis, Insights and Forecast - by Price Trend Analysis
- 9. Europe Agricultural Tractors Industry Analysis, Insights and Forecast, 2020-2032
- 9.1. Market Analysis, Insights and Forecast - by Production Analysis
- 9.2. Market Analysis, Insights and Forecast - by Consumption Analysis
- 9.3. Market Analysis, Insights and Forecast - by Import Market Analysis (Value & Volume)
- 9.4. Market Analysis, Insights and Forecast - by Export Market Analysis (Value & Volume)
- 9.5. Market Analysis, Insights and Forecast - by Price Trend Analysis
- 10. Middle East & Africa Agricultural Tractors Industry Analysis, Insights and Forecast, 2020-2032
- 10.1. Market Analysis, Insights and Forecast - by Production Analysis
- 10.2. Market Analysis, Insights and Forecast - by Consumption Analysis
- 10.3. Market Analysis, Insights and Forecast - by Import Market Analysis (Value & Volume)
- 10.4. Market Analysis, Insights and Forecast - by Export Market Analysis (Value & Volume)
- 10.5. Market Analysis, Insights and Forecast - by Price Trend Analysis
- 11. Asia Pacific Agricultural Tractors Industry Analysis, Insights and Forecast, 2020-2032
- 11.1. Market Analysis, Insights and Forecast - by Production Analysis
- 11.2. Market Analysis, Insights and Forecast - by Consumption Analysis
- 11.3. Market Analysis, Insights and Forecast - by Import Market Analysis (Value & Volume)
- 11.4. Market Analysis, Insights and Forecast - by Export Market Analysis (Value & Volume)
- 11.5. Market Analysis, Insights and Forecast - by Price Trend Analysis
- 12. Competitive Analysis
- 12.1. Company Profiles
- 12.1.1 Iseki & Co Ltd
- 12.1.1.1. Company Overview
- 12.1.1.2. Products
- 12.1.1.3. Company Financials
- 12.1.1.4. SWOT Analysis
- 12.1.2 Deere & Company
- 12.1.2.1. Company Overview
- 12.1.2.2. Products
- 12.1.2.3. Company Financials
- 12.1.2.4. SWOT Analysis
- 12.1.3 CNH Industrial NV
- 12.1.3.1. Company Overview
- 12.1.3.2. Products
- 12.1.3.3. Company Financials
- 12.1.3.4. SWOT Analysis
- 12.1.4 Kubota Corporation
- 12.1.4.1. Company Overview
- 12.1.4.2. Products
- 12.1.4.3. Company Financials
- 12.1.4.4. SWOT Analysis
- 12.1.5 Mahindra & Mahindra Ltd
- 12.1.5.1. Company Overview
- 12.1.5.2. Products
- 12.1.5.3. Company Financials
- 12.1.5.4. SWOT Analysis
- 12.1.6 Claas KGaA mbH
- 12.1.6.1. Company Overview
- 12.1.6.2. Products
- 12.1.6.3. Company Financials
- 12.1.6.4. SWOT Analysis
- 12.1.7 Tractors and Farm Equipment Ltd
- 12.1.7.1. Company Overview
- 12.1.7.2. Products
- 12.1.7.3. Company Financials
- 12.1.7.4. SWOT Analysis
- 12.1.8 AGCO Corporation (Massey Ferguson Limited)
- 12.1.8.1. Company Overview
- 12.1.8.2. Products
- 12.1.8.3. Company Financials
- 12.1.8.4. SWOT Analysis
- 12.1.9 Yanmar Holdings Co Lt
- 12.1.9.1. Company Overview
- 12.1.9.2. Products
- 12.1.9.3. Company Financials
- 12.1.9.4. SWOT Analysis
- 12.1.1 Iseki & Co Ltd
- 12.2. Market Entropy
- 12.2.1 Company's Key Areas Served
- 12.2.2 Recent Developments
- 12.3. Company Market Share Analysis 2025
- 12.3.1 Top 5 Companies Market Share Analysis
- 12.3.2 Top 3 Companies Market Share Analysis
- 12.4. List of Potential Customers
- 13. Research Methodology
List of Figures
- Figure 1: Global Agricultural Tractors Industry Revenue Breakdown (Million, %) by Region 2025 & 2033
- Figure 2: North America Agricultural Tractors Industry Revenue (Million), by Production Analysis 2025 & 2033
- Figure 3: North America Agricultural Tractors Industry Revenue Share (%), by Production Analysis 2025 & 2033
- Figure 4: North America Agricultural Tractors Industry Revenue (Million), by Consumption Analysis 2025 & 2033
- Figure 5: North America Agricultural Tractors Industry Revenue Share (%), by Consumption Analysis 2025 & 2033
- Figure 6: North America Agricultural Tractors Industry Revenue (Million), by Import Market Analysis (Value & Volume) 2025 & 2033
- Figure 7: North America Agricultural Tractors Industry Revenue Share (%), by Import Market Analysis (Value & Volume) 2025 & 2033
- Figure 8: North America Agricultural Tractors Industry Revenue (Million), by Export Market Analysis (Value & Volume) 2025 & 2033
- Figure 9: North America Agricultural Tractors Industry Revenue Share (%), by Export Market Analysis (Value & Volume) 2025 & 2033
- Figure 10: North America Agricultural Tractors Industry Revenue (Million), by Price Trend Analysis 2025 & 2033
- Figure 11: North America Agricultural Tractors Industry Revenue Share (%), by Price Trend Analysis 2025 & 2033
- Figure 12: North America Agricultural Tractors Industry Revenue (Million), by Country 2025 & 2033
- Figure 13: North America Agricultural Tractors Industry Revenue Share (%), by Country 2025 & 2033
- Figure 14: South America Agricultural Tractors Industry Revenue (Million), by Production Analysis 2025 & 2033
- Figure 15: South America Agricultural Tractors Industry Revenue Share (%), by Production Analysis 2025 & 2033
- Figure 16: South America Agricultural Tractors Industry Revenue (Million), by Consumption Analysis 2025 & 2033
- Figure 17: South America Agricultural Tractors Industry Revenue Share (%), by Consumption Analysis 2025 & 2033
- Figure 18: South America Agricultural Tractors Industry Revenue (Million), by Import Market Analysis (Value & Volume) 2025 & 2033
- Figure 19: South America Agricultural Tractors Industry Revenue Share (%), by Import Market Analysis (Value & Volume) 2025 & 2033
- Figure 20: South America Agricultural Tractors Industry Revenue (Million), by Export Market Analysis (Value & Volume) 2025 & 2033
- Figure 21: South America Agricultural Tractors Industry Revenue Share (%), by Export Market Analysis (Value & Volume) 2025 & 2033
- Figure 22: South America Agricultural Tractors Industry Revenue (Million), by Price Trend Analysis 2025 & 2033
- Figure 23: South America Agricultural Tractors Industry Revenue Share (%), by Price Trend Analysis 2025 & 2033
- Figure 24: South America Agricultural Tractors Industry Revenue (Million), by Country 2025 & 2033
- Figure 25: South America Agricultural Tractors Industry Revenue Share (%), by Country 2025 & 2033
- Figure 26: Europe Agricultural Tractors Industry Revenue (Million), by Production Analysis 2025 & 2033
- Figure 27: Europe Agricultural Tractors Industry Revenue Share (%), by Production Analysis 2025 & 2033
- Figure 28: Europe Agricultural Tractors Industry Revenue (Million), by Consumption Analysis 2025 & 2033
- Figure 29: Europe Agricultural Tractors Industry Revenue Share (%), by Consumption Analysis 2025 & 2033
- Figure 30: Europe Agricultural Tractors Industry Revenue (Million), by Import Market Analysis (Value & Volume) 2025 & 2033
- Figure 31: Europe Agricultural Tractors Industry Revenue Share (%), by Import Market Analysis (Value & Volume) 2025 & 2033
- Figure 32: Europe Agricultural Tractors Industry Revenue (Million), by Export Market Analysis (Value & Volume) 2025 & 2033
- Figure 33: Europe Agricultural Tractors Industry Revenue Share (%), by Export Market Analysis (Value & Volume) 2025 & 2033
- Figure 34: Europe Agricultural Tractors Industry Revenue (Million), by Price Trend Analysis 2025 & 2033
- Figure 35: Europe Agricultural Tractors Industry Revenue Share (%), by Price Trend Analysis 2025 & 2033
- Figure 36: Europe Agricultural Tractors Industry Revenue (Million), by Country 2025 & 2033
- Figure 37: Europe Agricultural Tractors Industry Revenue Share (%), by Country 2025 & 2033
- Figure 38: Middle East & Africa Agricultural Tractors Industry Revenue (Million), by Production Analysis 2025 & 2033
- Figure 39: Middle East & Africa Agricultural Tractors Industry Revenue Share (%), by Production Analysis 2025 & 2033
- Figure 40: Middle East & Africa Agricultural Tractors Industry Revenue (Million), by Consumption Analysis 2025 & 2033
- Figure 41: Middle East & Africa Agricultural Tractors Industry Revenue Share (%), by Consumption Analysis 2025 & 2033
- Figure 42: Middle East & Africa Agricultural Tractors Industry Revenue (Million), by Import Market Analysis (Value & Volume) 2025 & 2033
- Figure 43: Middle East & Africa Agricultural Tractors Industry Revenue Share (%), by Import Market Analysis (Value & Volume) 2025 & 2033
- Figure 44: Middle East & Africa Agricultural Tractors Industry Revenue (Million), by Export Market Analysis (Value & Volume) 2025 & 2033
- Figure 45: Middle East & Africa Agricultural Tractors Industry Revenue Share (%), by Export Market Analysis (Value & Volume) 2025 & 2033
- Figure 46: Middle East & Africa Agricultural Tractors Industry Revenue (Million), by Price Trend Analysis 2025 & 2033
- Figure 47: Middle East & Africa Agricultural Tractors Industry Revenue Share (%), by Price Trend Analysis 2025 & 2033
- Figure 48: Middle East & Africa Agricultural Tractors Industry Revenue (Million), by Country 2025 & 2033
- Figure 49: Middle East & Africa Agricultural Tractors Industry Revenue Share (%), by Country 2025 & 2033
- Figure 50: Asia Pacific Agricultural Tractors Industry Revenue (Million), by Production Analysis 2025 & 2033
- Figure 51: Asia Pacific Agricultural Tractors Industry Revenue Share (%), by Production Analysis 2025 & 2033
- Figure 52: Asia Pacific Agricultural Tractors Industry Revenue (Million), by Consumption Analysis 2025 & 2033
- Figure 53: Asia Pacific Agricultural Tractors Industry Revenue Share (%), by Consumption Analysis 2025 & 2033
- Figure 54: Asia Pacific Agricultural Tractors Industry Revenue (Million), by Import Market Analysis (Value & Volume) 2025 & 2033
- Figure 55: Asia Pacific Agricultural Tractors Industry Revenue Share (%), by Import Market Analysis (Value & Volume) 2025 & 2033
- Figure 56: Asia Pacific Agricultural Tractors Industry Revenue (Million), by Export Market Analysis (Value & Volume) 2025 & 2033
- Figure 57: Asia Pacific Agricultural Tractors Industry Revenue Share (%), by Export Market Analysis (Value & Volume) 2025 & 2033
- Figure 58: Asia Pacific Agricultural Tractors Industry Revenue (Million), by Price Trend Analysis 2025 & 2033
- Figure 59: Asia Pacific Agricultural Tractors Industry Revenue Share (%), by Price Trend Analysis 2025 & 2033
- Figure 60: Asia Pacific Agricultural Tractors Industry Revenue (Million), by Country 2025 & 2033
- Figure 61: Asia Pacific Agricultural Tractors Industry Revenue Share (%), by Country 2025 & 2033
List of Tables
- Table 1: Global Agricultural Tractors Industry Revenue Million Forecast, by Production Analysis 2020 & 2033
- Table 2: Global Agricultural Tractors Industry Revenue Million Forecast, by Consumption Analysis 2020 & 2033
- Table 3: Global Agricultural Tractors Industry Revenue Million Forecast, by Import Market Analysis (Value & Volume) 2020 & 2033
- Table 4: Global Agricultural Tractors Industry Revenue Million Forecast, by Export Market Analysis (Value & Volume) 2020 & 2033
- Table 5: Global Agricultural Tractors Industry Revenue Million Forecast, by Price Trend Analysis 2020 & 2033
- Table 6: Global Agricultural Tractors Industry Revenue Million Forecast, by Region 2020 & 2033
- Table 7: Global Agricultural Tractors Industry Revenue Million Forecast, by Production Analysis 2020 & 2033
- Table 8: Global Agricultural Tractors Industry Revenue Million Forecast, by Consumption Analysis 2020 & 2033
- Table 9: Global Agricultural Tractors Industry Revenue Million Forecast, by Import Market Analysis (Value & Volume) 2020 & 2033
- Table 10: Global Agricultural Tractors Industry Revenue Million Forecast, by Export Market Analysis (Value & Volume) 2020 & 2033
- Table 11: Global Agricultural Tractors Industry Revenue Million Forecast, by Price Trend Analysis 2020 & 2033
- Table 12: Global Agricultural Tractors Industry Revenue Million Forecast, by Country 2020 & 2033
- Table 13: United States Agricultural Tractors Industry Revenue (Million) Forecast, by Application 2020 & 2033
- Table 14: Canada Agricultural Tractors Industry Revenue (Million) Forecast, by Application 2020 & 2033
- Table 15: Mexico Agricultural Tractors Industry Revenue (Million) Forecast, by Application 2020 & 2033
- Table 16: Global Agricultural Tractors Industry Revenue Million Forecast, by Production Analysis 2020 & 2033
- Table 17: Global Agricultural Tractors Industry Revenue Million Forecast, by Consumption Analysis 2020 & 2033
- Table 18: Global Agricultural Tractors Industry Revenue Million Forecast, by Import Market Analysis (Value & Volume) 2020 & 2033
- Table 19: Global Agricultural Tractors Industry Revenue Million Forecast, by Export Market Analysis (Value & Volume) 2020 & 2033
- Table 20: Global Agricultural Tractors Industry Revenue Million Forecast, by Price Trend Analysis 2020 & 2033
- Table 21: Global Agricultural Tractors Industry Revenue Million Forecast, by Country 2020 & 2033
- Table 22: Brazil Agricultural Tractors Industry Revenue (Million) Forecast, by Application 2020 & 2033
- Table 23: Argentina Agricultural Tractors Industry Revenue (Million) Forecast, by Application 2020 & 2033
- Table 24: Rest of South America Agricultural Tractors Industry Revenue (Million) Forecast, by Application 2020 & 2033
- Table 25: Global Agricultural Tractors Industry Revenue Million Forecast, by Production Analysis 2020 & 2033
- Table 26: Global Agricultural Tractors Industry Revenue Million Forecast, by Consumption Analysis 2020 & 2033
- Table 27: Global Agricultural Tractors Industry Revenue Million Forecast, by Import Market Analysis (Value & Volume) 2020 & 2033
- Table 28: Global Agricultural Tractors Industry Revenue Million Forecast, by Export Market Analysis (Value & Volume) 2020 & 2033
- Table 29: Global Agricultural Tractors Industry Revenue Million Forecast, by Price Trend Analysis 2020 & 2033
- Table 30: Global Agricultural Tractors Industry Revenue Million Forecast, by Country 2020 & 2033
- Table 31: United Kingdom Agricultural Tractors Industry Revenue (Million) Forecast, by Application 2020 & 2033
- Table 32: Germany Agricultural Tractors Industry Revenue (Million) Forecast, by Application 2020 & 2033
- Table 33: France Agricultural Tractors Industry Revenue (Million) Forecast, by Application 2020 & 2033
- Table 34: Italy Agricultural Tractors Industry Revenue (Million) Forecast, by Application 2020 & 2033
- Table 35: Spain Agricultural Tractors Industry Revenue (Million) Forecast, by Application 2020 & 2033
- Table 36: Russia Agricultural Tractors Industry Revenue (Million) Forecast, by Application 2020 & 2033
- Table 37: Benelux Agricultural Tractors Industry Revenue (Million) Forecast, by Application 2020 & 2033
- Table 38: Nordics Agricultural Tractors Industry Revenue (Million) Forecast, by Application 2020 & 2033
- Table 39: Rest of Europe Agricultural Tractors Industry Revenue (Million) Forecast, by Application 2020 & 2033
- Table 40: Global Agricultural Tractors Industry Revenue Million Forecast, by Production Analysis 2020 & 2033
- Table 41: Global Agricultural Tractors Industry Revenue Million Forecast, by Consumption Analysis 2020 & 2033
- Table 42: Global Agricultural Tractors Industry Revenue Million Forecast, by Import Market Analysis (Value & Volume) 2020 & 2033
- Table 43: Global Agricultural Tractors Industry Revenue Million Forecast, by Export Market Analysis (Value & Volume) 2020 & 2033
- Table 44: Global Agricultural Tractors Industry Revenue Million Forecast, by Price Trend Analysis 2020 & 2033
- Table 45: Global Agricultural Tractors Industry Revenue Million Forecast, by Country 2020 & 2033
- Table 46: Turkey Agricultural Tractors Industry Revenue (Million) Forecast, by Application 2020 & 2033
- Table 47: Israel Agricultural Tractors Industry Revenue (Million) Forecast, by Application 2020 & 2033
- Table 48: GCC Agricultural Tractors Industry Revenue (Million) Forecast, by Application 2020 & 2033
- Table 49: North Africa Agricultural Tractors Industry Revenue (Million) Forecast, by Application 2020 & 2033
- Table 50: South Africa Agricultural Tractors Industry Revenue (Million) Forecast, by Application 2020 & 2033
- Table 51: Rest of Middle East & Africa Agricultural Tractors Industry Revenue (Million) Forecast, by Application 2020 & 2033
- Table 52: Global Agricultural Tractors Industry Revenue Million Forecast, by Production Analysis 2020 & 2033
- Table 53: Global Agricultural Tractors Industry Revenue Million Forecast, by Consumption Analysis 2020 & 2033
- Table 54: Global Agricultural Tractors Industry Revenue Million Forecast, by Import Market Analysis (Value & Volume) 2020 & 2033
- Table 55: Global Agricultural Tractors Industry Revenue Million Forecast, by Export Market Analysis (Value & Volume) 2020 & 2033
- Table 56: Global Agricultural Tractors Industry Revenue Million Forecast, by Price Trend Analysis 2020 & 2033
- Table 57: Global Agricultural Tractors Industry Revenue Million Forecast, by Country 2020 & 2033
- Table 58: China Agricultural Tractors Industry Revenue (Million) Forecast, by Application 2020 & 2033
- Table 59: India Agricultural Tractors Industry Revenue (Million) Forecast, by Application 2020 & 2033
- Table 60: Japan Agricultural Tractors Industry Revenue (Million) Forecast, by Application 2020 & 2033
- Table 61: South Korea Agricultural Tractors Industry Revenue (Million) Forecast, by Application 2020 & 2033
- Table 62: ASEAN Agricultural Tractors Industry Revenue (Million) Forecast, by Application 2020 & 2033
- Table 63: Oceania Agricultural Tractors Industry Revenue (Million) Forecast, by Application 2020 & 2033
- Table 64: Rest of Asia Pacific Agricultural Tractors Industry Revenue (Million) Forecast, by Application 2020 & 2033
Frequently Asked Questions
1. What is the projected Compound Annual Growth Rate (CAGR) of the Agricultural Tractors Industry?
The projected CAGR is approximately 5.20%.
2. Which companies are prominent players in the Agricultural Tractors Industry?
Key companies in the market include Iseki & Co Ltd, Deere & Company, CNH Industrial NV, Kubota Corporation, Mahindra & Mahindra Ltd, Claas KGaA mbH, Tractors and Farm Equipment Ltd, AGCO Corporation (Massey Ferguson Limited), Yanmar Holdings Co Lt.
3. What are the main segments of the Agricultural Tractors Industry?
The market segments include Production Analysis, Consumption Analysis, Import Market Analysis (Value & Volume), Export Market Analysis (Value & Volume), Price Trend Analysis.
4. Can you provide details about the market size?
The market size is estimated to be USD 70.40 Million as of 2022.
5. What are some drivers contributing to market growth?
Shortage of Skilled Labor; Government Support to Enhance Farm Mechanization.
6. What are the notable trends driving market growth?
Increasing Farm Mechanization in Developing Markets.
7. Are there any restraints impacting market growth?
Heavy Initial Procurement Cost and High Expenditure on Maintenance.
8. Can you provide examples of recent developments in the market?
November 2022: VST Tillers Tractors Ltd and ZETOR TRACTORS unveiled two best-in-class tractors at the CII Agro Tech India 2022 exhibition. These 45 HP and 50 HP category tractors are jointly developed by VST & ZETOR at their India & Czech Republic plants.
9. What pricing options are available for accessing the report?
Pricing options include single-user, multi-user, and enterprise licenses priced at USD 4750, USD 5250, and USD 8750 respectively.
10. Is the market size provided in terms of value or volume?
The market size is provided in terms of value, measured in Million.
11. Are there any specific market keywords associated with the report?
Yes, the market keyword associated with the report is "Agricultural Tractors Industry," which aids in identifying and referencing the specific market segment covered.
12. How do I determine which pricing option suits my needs best?
The pricing options vary based on user requirements and access needs. Individual users may opt for single-user licenses, while businesses requiring broader access may choose multi-user or enterprise licenses for cost-effective access to the report.
13. Are there any additional resources or data provided in the Agricultural Tractors Industry report?
While the report offers comprehensive insights, it's advisable to review the specific contents or supplementary materials provided to ascertain if additional resources or data are available.
14. How can I stay updated on further developments or reports in the Agricultural Tractors Industry?
To stay informed about further developments, trends, and reports in the Agricultural Tractors Industry, consider subscribing to industry newsletters, following relevant companies and organizations, or regularly checking reputable industry news sources and publications.
Methodology
Step 1 - Identification of Relevant Samples Size from Population Database


Step 2 - Approaches for Defining Global Market Size (Value, Volume* & Price*)

Note*: In applicable scenarios
Step 3 - Data Sources
Primary Research
- Web Analytics
- Survey Reports
- Research Institute
- Latest Research Reports
- Opinion Leaders
Secondary Research
- Annual Reports
- White Paper
- Latest Press Release
- Industry Association
- Paid Database
- Investor Presentations

Step 4 - Data Triangulation
Involves using different sources of information in order to increase the validity of a study
These sources are likely to be stakeholders in a program - participants, other researchers, program staff, other community members, and so on.
Then we put all data in single framework & apply various statistical tools to find out the dynamic on the market.
During the analysis stage, feedback from the stakeholder groups would be compared to determine areas of agreement as well as areas of divergence