

Key Insights
The global Fresh Cherries market is projected to reach USD 68 billion by 2025, expanding at a robust Compound Annual Growth Rate (CAGR) of 6.9%. This growth is driven by rising consumer preference for healthy, nutrient-dense fruits and the expanding use of cherries in diverse culinary applications. Key drivers include heightened awareness of cherries' health benefits, such as their antioxidant and anti-inflammatory properties, positioning them as a desirable superfood. Technological advancements in agriculture, including improved cultivation and post-harvest management, are enhancing yield and quality. Convenient accessibility through supermarkets and online channels further stimulates demand.
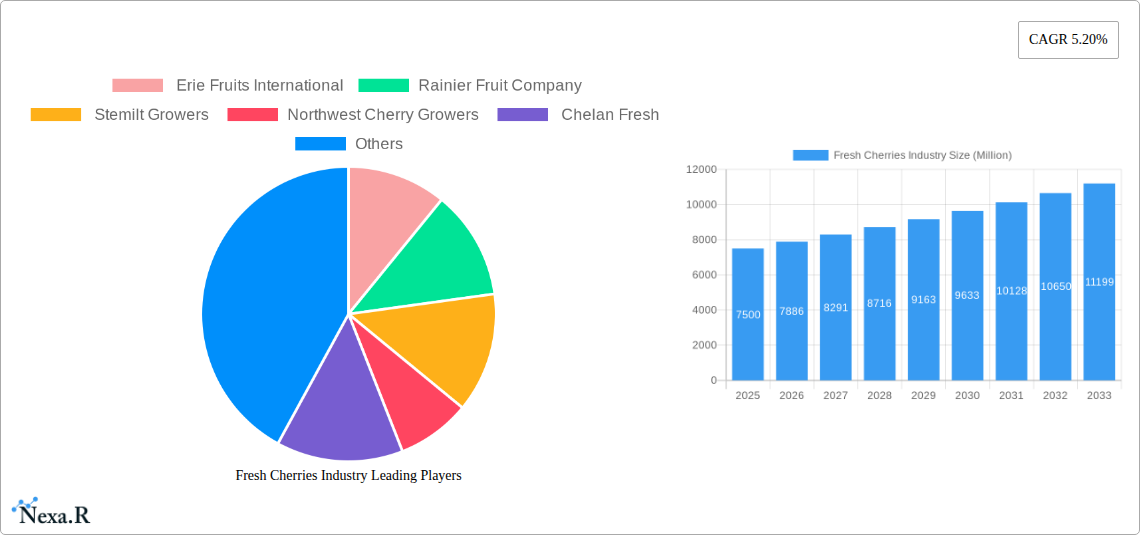
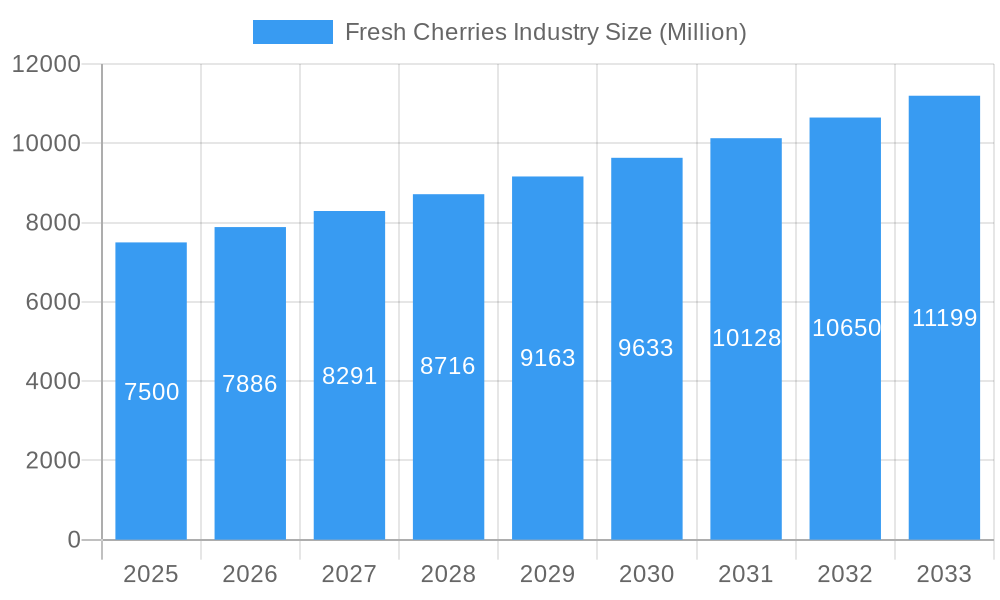
Fresh Cherries Industry Market Size (In Billion)
Market analysis encompasses production, consumption, trade flows, and pricing. Production strategies focus on optimizing cultivation in key regions, while consumption trends indicate a preference for premium and specialty varieties. Major producing nations like Turkey, Chile, and the United States significantly influence import and export dynamics. A growing demand for organic and sustainably sourced cherries reflects consumer shifts towards ethical consumption. Market restraints include the perishable nature of cherries, requiring efficient cold chain logistics, and vulnerability to weather-related supply and price fluctuations. Key industry players, including Erie Fruits International, Rainier Fruit Company, Stemilt Growers, Northwest Cherry Growers, and Chelan Fresh, are investing in innovation and global expansion to leverage market opportunities and address challenges.
Fresh Cherries Industry Company Market Share
Fresh Cherries Industry Market Dynamics & Structure
The global fresh cherries market is characterized by a moderately concentrated structure, with a few dominant players holding significant market share, alongside a growing number of regional producers and specialized exporters. Technological innovation is a key driver, focusing on enhancing yield, improving disease resistance, and extending shelf life through advanced cultivation techniques and post-harvest management. Regulatory frameworks, including food safety standards, import/export regulations, and organic certifications, significantly influence market access and operational costs. Competitive product substitutes include other fresh fruits and processed cherry products, though the distinct taste and seasonal appeal of fresh cherries create a unique market position. End-user demographics are diverse, spanning health-conscious consumers, families seeking nutritious snacks, and the culinary industry. Mergers and acquisitions (M&A) trends are observed as larger entities seek to consolidate supply chains and expand market reach, though smaller, niche operations also thrive through specialization.
- Market Concentration: Dominated by a blend of large-scale fruit companies and regional cooperatives.
- Technological Innovation: Focus on precision agriculture, advanced irrigation, and controlled atmosphere storage.
- Regulatory Frameworks: Strict adherence to international food safety (e.g., HACCP) and phytosanitary requirements.
- Product Substitutes: Competition from berries, stone fruits, and dried cherries, especially during off-seasons.
- End-User Demographics: Growth in demand from millennials and Gen Z for healthy, convenient, and ethically sourced produce.
- M&A Trends: Consolidation aims to secure supply and market access, particularly for export-oriented operations.
Fresh Cherries Industry Growth Trends & Insights
The fresh cherries market is poised for robust growth, driven by increasing consumer demand for healthy and convenient food options. The market size is projected to expand significantly over the forecast period, fueled by evolving dietary preferences and a growing awareness of the nutritional benefits of cherries, such as their antioxidant properties. Adoption rates of advanced farming technologies, including hydroponics and vertical farming in suitable microclimates, are gradually increasing, leading to improved yield and consistent supply. Technological disruptions are also emerging in the form of innovative packaging solutions that extend shelf life and maintain product freshness during transit, thereby reducing post-harvest losses. Consumer behavior shifts are evident, with a rising preference for premium, sustainably grown, and traceable produce. This trend is compelling producers to invest in certifications and transparent supply chain management. The CAGR for the fresh cherries market is estimated to be around 5.5% from 2025 to 2033, reflecting a healthy expansion trajectory. Market penetration is deepening in both developed and emerging economies as awareness of cherry's health benefits and versatility in culinary applications grows. The increasing popularity of cherry-infused beverages, desserts, and functional foods further contributes to market expansion, creating a more dynamic and diversified demand landscape. The segment of sweet cherries is expected to maintain its dominance, driven by their widespread appeal and versatility.
Dominant Regions, Countries, or Segments in Fresh Cherries Industry
The fresh cherries industry exhibits distinct regional dominance influenced by climatic suitability, advanced agricultural practices, and robust export infrastructure. The United States consistently emerges as a leading player, particularly in Production Analysis, driven by states like Washington and California, which boast ideal growing conditions and significant acreage dedicated to cherry cultivation. These regions benefit from fertile soil, optimal rainfall patterns, and a favorable temperature range essential for high-quality cherry production.
- Production Analysis: The Pacific Northwest region of the United States, primarily Washington, accounts for a substantial portion of global sweet cherry production, estimated at over 500,000 metric tons annually in recent years. This dominance is attributed to extensive research and development in cherry varietals and cultivation techniques.
- Consumption Analysis: Western Europe, including countries like Germany and the UK, represents a significant consumption market. The growing health consciousness and disposable income in these regions drive demand for premium fruits like fresh cherries. Per capita consumption in these markets is estimated to be around 0.5 kg per year.
- Import Market Analysis (Value & Volume): China is a colossal importer of fresh cherries, primarily from countries like Chile and the United States. In 2021, China's fresh cherry imports reached an estimated value of over USD 1.5 billion, with import volumes exceeding 350,000 metric tons. This volume underscores the immense demand and willingness to pay premium prices for high-quality cherries.
- Export Market Analysis (Value & Volume): Chile is a dominant force in the Export Market Analysis, leveraging its counter-seasonal production to supply markets in the Northern Hemisphere. Chilean cherry exports are valued in billions of USD annually, with volumes consistently in the hundreds of thousands of metric tons. The strategic trade agreements and efficient logistics networks enable Chile to reach global markets effectively.
- Price Trend Analysis: The price of fresh cherries is significantly influenced by supply-demand dynamics and the quality of the harvest. Premium varieties and out-of-season imports command higher prices, often ranging from USD 8 to USD 15 per kilogram in retail markets globally. The average FOB price for Chilean cherries has been observed to fluctuate between USD 4.5 to USD 7.0 per kilogram.
Fresh Cherries Industry Product Landscape
The fresh cherries industry focuses on delivering high-quality, palatable, and visually appealing fruit. Product innovation centers on developing new varietals with improved sweetness, firmness, and disease resistance, such as the popular Bing and Rainier cherries. Applications are diverse, ranging from direct consumption as a healthy snack to use in culinary creations like pies, tarts, jams, and beverages. Performance metrics are crucial, including Brix levels for sweetness, firmness ratings for texture, and shelf life for marketability. Unique selling propositions often lie in the origin of the cherries, organic certifications, and specific flavor profiles. Technological advancements in controlled atmosphere packaging and expedited logistics are vital for maintaining the premium quality of fresh cherries from orchard to table.
Key Drivers, Barriers & Challenges in Fresh Cherries Industry
Key Drivers:
- Growing Health and Wellness Trends: Increased consumer focus on nutritious diets fuels demand for fresh fruits rich in antioxidants.
- Rising Disposable Incomes: Higher purchasing power in emerging economies allows for greater consumption of premium produce like fresh cherries.
- Technological Advancements in Agriculture: Innovations in cultivation, pest control, and post-harvest handling improve yields and quality.
- Global Supply Chain Optimization: Enhanced logistics and cold chain management enable wider market access and reduced spoilage.
Barriers & Challenges:
- Perishability and Short Shelf Life: Cherries are highly perishable, necessitating rapid and efficient supply chain management.
- Seasonal Availability: Production is largely seasonal, leading to price volatility and reliance on imports to meet year-round demand.
- Climate Change and Weather Volatility: Extreme weather events can significantly impact harvest yields and quality.
- Pest and Disease Management: Cherries are susceptible to various pests and diseases, requiring stringent control measures.
- High Production Costs: Intensive labor requirements for harvesting and specialized cultivation techniques contribute to high production costs.
- Trade Barriers and Phytosanitary Regulations: Navigating diverse import/export regulations and meeting strict phytosanitary requirements can be complex and costly.
- Competition from Other Fruits: Cherries compete with a wide array of other fresh fruits for consumer attention and spending.
Emerging Opportunities in Fresh Cherries Industry
Emerging opportunities in the fresh cherries industry lie in expanding into untapped geographical markets, particularly in Southeast Asia and parts of Africa, where demand for premium fruits is on the rise. Innovative applications, such as the development of dried cherry snacks with added nutritional benefits or the use of cherry extracts in functional foods and beverages, present significant growth avenues. Evolving consumer preferences for convenience are driving demand for pre-portioned, ready-to-eat cherry packs. Furthermore, the increasing interest in value-added products and the potential for direct-to-consumer (DTC) sales models offer new avenues for producers to connect with consumers and capture higher margins.
Growth Accelerators in the Fresh Cherries Industry Industry
Growth in the fresh cherries industry is significantly accelerated by ongoing technological breakthroughs in precision agriculture, leading to optimized resource utilization and higher yields. Strategic partnerships between growers, distributors, and retailers are crucial for expanding market reach and ensuring a consistent supply chain. Market expansion strategies, including penetration into new international markets and diversification into value-added cherry products, are also key growth catalysts. Investments in research and development for new, more resilient cherry varietals that can withstand challenging climates and diseases will further bolster long-term growth potential.
Key Players Shaping the Fresh Cherries Industry Market
- Erie Fruits International
- Rainier Fruit Company
- Stemilt Growers
- Northwest Cherry Growers
- Chelan Fresh
Notable Milestones in Fresh Cherries Industry Sector
- October 2021: The United States Department of Agriculture (USDA) reported that US imports of Chilean cherries totaled approximately 6,800 metric tons for the 2020-21 season. The industry is actively working to develop new markets beyond China, including the United States.
- July 2021: Modern intensive cherry orchards began appearing in Uzbekistan, integrating with traditional farming methods in the Fergana Valley to bolster cherry production and exports globally.
- December 2020: ProChile, in collaboration with its India Marketing Representative, launched the "Cherry-sh Every Moment" retail promotion campaign to introduce Chilean cherries to the Indian market and target premium consumers.
In-Depth Fresh Cherries Industry Market Outlook
The future market potential for fresh cherries is exceptionally bright, fueled by a confluence of increasing consumer health consciousness and advancements in agricultural technology. Strategic opportunities abound in leveraging the growing demand for superfoods and incorporating cherries into a wider array of healthy food products. The expansion of cold chain infrastructure in emerging economies will be critical for unlocking their full market potential. Furthermore, the focus on sustainable farming practices and traceability will enhance brand loyalty and command premium pricing. Diversification into innovative product forms and exploring direct-to-consumer channels will provide significant avenues for capturing value and ensuring long-term market leadership in the dynamic global fresh cherries landscape.
Fresh Cherries Industry Segmentation
- 1. Production Analysis
- 2. Consumption Analysis
- 3. Import Market Analysis (Value & Volume)
- 4. Export Market Analysis (Value & Volume)
- 5. Price Trend Analysis
Fresh Cherries Industry Segmentation By Geography
-
1. North America
- 1.1. United States
-
2. Europe
- 2.1. Spain
-
3. Asia Pacific
- 3.1. China
-
4. South America
- 4.1. Chile
-
5. Middle East and Africa
- 5.1. Turkey
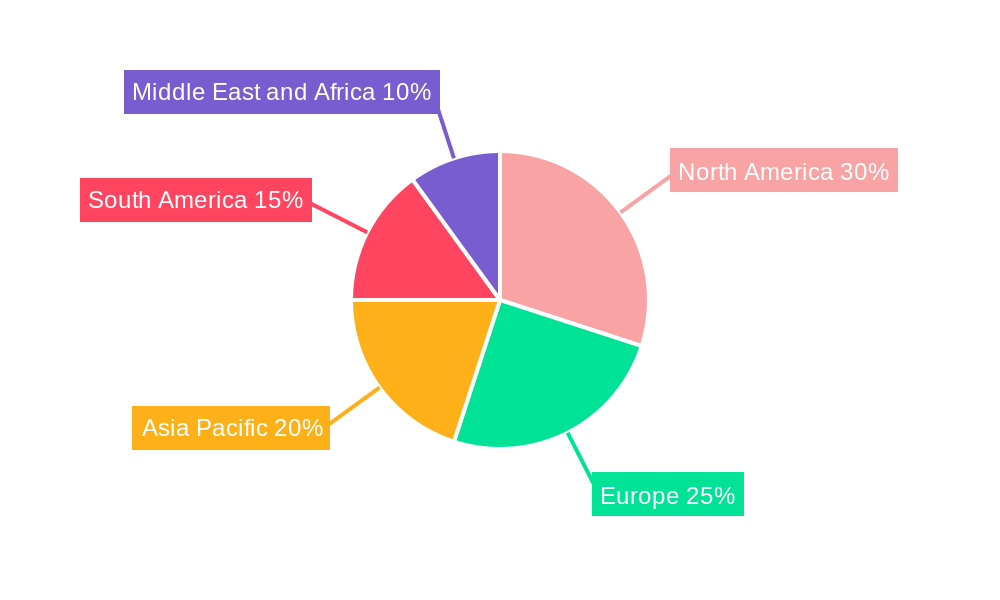
Fresh Cherries Industry Regional Market Share
Geographic Coverage of Fresh Cherries Industry
Fresh Cherries Industry REPORT HIGHLIGHTS
| Aspects | Details |
|---|---|
| Study Period | 2020-2034 |
| Base Year | 2025 |
| Estimated Year | 2026 |
| Forecast Period | 2026-2034 |
| Historical Period | 2020-2025 |
| Growth Rate | CAGR of 6.9% from 2020-2034 |
| Segmentation |
|
Table of Contents
- 1. Introduction
- 1.1. Research Scope
- 1.2. Market Segmentation
- 1.3. Research Objective
- 1.4. Definitions and Assumptions
- 2. Executive Summary
- 2.1. Market Snapshot
- 3. Market Dynamics
- 3.1. Market Drivers
- 3.2. Market Restrains
- 3.3. Market Trends
- 3.4. Market Opportunities
- 4. Market Factor Analysis
- 4.1. Porters Five Forces
- 4.1.1. Bargaining Power of Suppliers
- 4.1.2. Bargaining Power of Buyers
- 4.1.3. Threat of New Entrants
- 4.1.4. Threat of Substitutes
- 4.1.5. Competitive Rivalry
- 4.2. PESTEL analysis
- 4.3. BCG Analysis
- 4.3.1. Stars (High Growth, High Market Share)
- 4.3.2. Cash Cows (Low Growth, High Market Share)
- 4.3.3. Question Mark (High Growth, Low Market Share)
- 4.3.4. Dogs (Low Growth, Low Market Share)
- 4.4. Ansoff Matrix Analysis
- 4.5. Supply Chain Analysis
- 4.6. Regulatory Landscape
- 4.7. Current Market Potential and Opportunity Assessment (TAM–SAM–SOM Framework)
- 4.8. NRP Analyst Note
- 4.1. Porters Five Forces
- 5. Market Analysis, Insights and Forecast 2021-2033
- 5.1. Market Analysis, Insights and Forecast - by Production Analysis
- 5.2. Market Analysis, Insights and Forecast - by Consumption Analysis
- 5.3. Market Analysis, Insights and Forecast - by Import Market Analysis (Value & Volume)
- 5.4. Market Analysis, Insights and Forecast - by Export Market Analysis (Value & Volume)
- 5.5. Market Analysis, Insights and Forecast - by Price Trend Analysis
- 5.6. Market Analysis, Insights and Forecast - by Region
- 5.6.1. North America
- 5.6.2. Europe
- 5.6.3. Asia Pacific
- 5.6.4. South America
- 5.6.5. Middle East and Africa
- 6. Global Fresh Cherries Industry Analysis, Insights and Forecast, 2021-2033
- 6.1. Market Analysis, Insights and Forecast - by Production Analysis
- 6.2. Market Analysis, Insights and Forecast - by Consumption Analysis
- 6.3. Market Analysis, Insights and Forecast - by Import Market Analysis (Value & Volume)
- 6.4. Market Analysis, Insights and Forecast - by Export Market Analysis (Value & Volume)
- 6.5. Market Analysis, Insights and Forecast - by Price Trend Analysis
- 7. North America Fresh Cherries Industry Analysis, Insights and Forecast, 2020-2032
- 7.1. Market Analysis, Insights and Forecast - by Production Analysis
- 7.2. Market Analysis, Insights and Forecast - by Consumption Analysis
- 7.3. Market Analysis, Insights and Forecast - by Import Market Analysis (Value & Volume)
- 7.4. Market Analysis, Insights and Forecast - by Export Market Analysis (Value & Volume)
- 7.5. Market Analysis, Insights and Forecast - by Price Trend Analysis
- 8. Europe Fresh Cherries Industry Analysis, Insights and Forecast, 2020-2032
- 8.1. Market Analysis, Insights and Forecast - by Production Analysis
- 8.2. Market Analysis, Insights and Forecast - by Consumption Analysis
- 8.3. Market Analysis, Insights and Forecast - by Import Market Analysis (Value & Volume)
- 8.4. Market Analysis, Insights and Forecast - by Export Market Analysis (Value & Volume)
- 8.5. Market Analysis, Insights and Forecast - by Price Trend Analysis
- 9. Asia Pacific Fresh Cherries Industry Analysis, Insights and Forecast, 2020-2032
- 9.1. Market Analysis, Insights and Forecast - by Production Analysis
- 9.2. Market Analysis, Insights and Forecast - by Consumption Analysis
- 9.3. Market Analysis, Insights and Forecast - by Import Market Analysis (Value & Volume)
- 9.4. Market Analysis, Insights and Forecast - by Export Market Analysis (Value & Volume)
- 9.5. Market Analysis, Insights and Forecast - by Price Trend Analysis
- 10. South America Fresh Cherries Industry Analysis, Insights and Forecast, 2020-2032
- 10.1. Market Analysis, Insights and Forecast - by Production Analysis
- 10.2. Market Analysis, Insights and Forecast - by Consumption Analysis
- 10.3. Market Analysis, Insights and Forecast - by Import Market Analysis (Value & Volume)
- 10.4. Market Analysis, Insights and Forecast - by Export Market Analysis (Value & Volume)
- 10.5. Market Analysis, Insights and Forecast - by Price Trend Analysis
- 11. Middle East and Africa Fresh Cherries Industry Analysis, Insights and Forecast, 2020-2032
- 11.1. Market Analysis, Insights and Forecast - by Production Analysis
- 11.2. Market Analysis, Insights and Forecast - by Consumption Analysis
- 11.3. Market Analysis, Insights and Forecast - by Import Market Analysis (Value & Volume)
- 11.4. Market Analysis, Insights and Forecast - by Export Market Analysis (Value & Volume)
- 11.5. Market Analysis, Insights and Forecast - by Price Trend Analysis
- 12. Competitive Analysis
- 12.1. Company Profiles
- 12.1.1 Erie Fruits International
- 12.1.1.1. Company Overview
- 12.1.1.2. Products
- 12.1.1.3. Company Financials
- 12.1.1.4. SWOT Analysis
- 12.1.2 Rainier Fruit Company
- 12.1.2.1. Company Overview
- 12.1.2.2. Products
- 12.1.2.3. Company Financials
- 12.1.2.4. SWOT Analysis
- 12.1.3 Stemilt Growers
- 12.1.3.1. Company Overview
- 12.1.3.2. Products
- 12.1.3.3. Company Financials
- 12.1.3.4. SWOT Analysis
- 12.1.4 Northwest Cherry Growers
- 12.1.4.1. Company Overview
- 12.1.4.2. Products
- 12.1.4.3. Company Financials
- 12.1.4.4. SWOT Analysis
- 12.1.5 Chelan Fresh
- 12.1.5.1. Company Overview
- 12.1.5.2. Products
- 12.1.5.3. Company Financials
- 12.1.5.4. SWOT Analysis
- 12.1.1 Erie Fruits International
- 12.2. Market Entropy
- 12.2.1 Company's Key Areas Served
- 12.2.2 Recent Developments
- 12.3. Company Market Share Analysis 2025
- 12.3.1 Top 5 Companies Market Share Analysis
- 12.3.2 Top 3 Companies Market Share Analysis
- 12.4. List of Potential Customers
- 13. Research Methodology
List of Figures
- Figure 1: Global Fresh Cherries Industry Revenue Breakdown (billion, %) by Region 2025 & 2033
- Figure 2: Global Fresh Cherries Industry Volume Breakdown (Metric Tons, %) by Region 2025 & 2033
- Figure 3: North America Fresh Cherries Industry Revenue (billion), by Production Analysis 2025 & 2033
- Figure 4: North America Fresh Cherries Industry Volume (Metric Tons), by Production Analysis 2025 & 2033
- Figure 5: North America Fresh Cherries Industry Revenue Share (%), by Production Analysis 2025 & 2033
- Figure 6: North America Fresh Cherries Industry Volume Share (%), by Production Analysis 2025 & 2033
- Figure 7: North America Fresh Cherries Industry Revenue (billion), by Consumption Analysis 2025 & 2033
- Figure 8: North America Fresh Cherries Industry Volume (Metric Tons), by Consumption Analysis 2025 & 2033
- Figure 9: North America Fresh Cherries Industry Revenue Share (%), by Consumption Analysis 2025 & 2033
- Figure 10: North America Fresh Cherries Industry Volume Share (%), by Consumption Analysis 2025 & 2033
- Figure 11: North America Fresh Cherries Industry Revenue (billion), by Import Market Analysis (Value & Volume) 2025 & 2033
- Figure 12: North America Fresh Cherries Industry Volume (Metric Tons), by Import Market Analysis (Value & Volume) 2025 & 2033
- Figure 13: North America Fresh Cherries Industry Revenue Share (%), by Import Market Analysis (Value & Volume) 2025 & 2033
- Figure 14: North America Fresh Cherries Industry Volume Share (%), by Import Market Analysis (Value & Volume) 2025 & 2033
- Figure 15: North America Fresh Cherries Industry Revenue (billion), by Export Market Analysis (Value & Volume) 2025 & 2033
- Figure 16: North America Fresh Cherries Industry Volume (Metric Tons), by Export Market Analysis (Value & Volume) 2025 & 2033
- Figure 17: North America Fresh Cherries Industry Revenue Share (%), by Export Market Analysis (Value & Volume) 2025 & 2033
- Figure 18: North America Fresh Cherries Industry Volume Share (%), by Export Market Analysis (Value & Volume) 2025 & 2033
- Figure 19: North America Fresh Cherries Industry Revenue (billion), by Price Trend Analysis 2025 & 2033
- Figure 20: North America Fresh Cherries Industry Volume (Metric Tons), by Price Trend Analysis 2025 & 2033
- Figure 21: North America Fresh Cherries Industry Revenue Share (%), by Price Trend Analysis 2025 & 2033
- Figure 22: North America Fresh Cherries Industry Volume Share (%), by Price Trend Analysis 2025 & 2033
- Figure 23: North America Fresh Cherries Industry Revenue (billion), by Country 2025 & 2033
- Figure 24: North America Fresh Cherries Industry Volume (Metric Tons), by Country 2025 & 2033
- Figure 25: North America Fresh Cherries Industry Revenue Share (%), by Country 2025 & 2033
- Figure 26: North America Fresh Cherries Industry Volume Share (%), by Country 2025 & 2033
- Figure 27: Europe Fresh Cherries Industry Revenue (billion), by Production Analysis 2025 & 2033
- Figure 28: Europe Fresh Cherries Industry Volume (Metric Tons), by Production Analysis 2025 & 2033
- Figure 29: Europe Fresh Cherries Industry Revenue Share (%), by Production Analysis 2025 & 2033
- Figure 30: Europe Fresh Cherries Industry Volume Share (%), by Production Analysis 2025 & 2033
- Figure 31: Europe Fresh Cherries Industry Revenue (billion), by Consumption Analysis 2025 & 2033
- Figure 32: Europe Fresh Cherries Industry Volume (Metric Tons), by Consumption Analysis 2025 & 2033
- Figure 33: Europe Fresh Cherries Industry Revenue Share (%), by Consumption Analysis 2025 & 2033
- Figure 34: Europe Fresh Cherries Industry Volume Share (%), by Consumption Analysis 2025 & 2033
- Figure 35: Europe Fresh Cherries Industry Revenue (billion), by Import Market Analysis (Value & Volume) 2025 & 2033
- Figure 36: Europe Fresh Cherries Industry Volume (Metric Tons), by Import Market Analysis (Value & Volume) 2025 & 2033
- Figure 37: Europe Fresh Cherries Industry Revenue Share (%), by Import Market Analysis (Value & Volume) 2025 & 2033
- Figure 38: Europe Fresh Cherries Industry Volume Share (%), by Import Market Analysis (Value & Volume) 2025 & 2033
- Figure 39: Europe Fresh Cherries Industry Revenue (billion), by Export Market Analysis (Value & Volume) 2025 & 2033
- Figure 40: Europe Fresh Cherries Industry Volume (Metric Tons), by Export Market Analysis (Value & Volume) 2025 & 2033
- Figure 41: Europe Fresh Cherries Industry Revenue Share (%), by Export Market Analysis (Value & Volume) 2025 & 2033
- Figure 42: Europe Fresh Cherries Industry Volume Share (%), by Export Market Analysis (Value & Volume) 2025 & 2033
- Figure 43: Europe Fresh Cherries Industry Revenue (billion), by Price Trend Analysis 2025 & 2033
- Figure 44: Europe Fresh Cherries Industry Volume (Metric Tons), by Price Trend Analysis 2025 & 2033
- Figure 45: Europe Fresh Cherries Industry Revenue Share (%), by Price Trend Analysis 2025 & 2033
- Figure 46: Europe Fresh Cherries Industry Volume Share (%), by Price Trend Analysis 2025 & 2033
- Figure 47: Europe Fresh Cherries Industry Revenue (billion), by Country 2025 & 2033
- Figure 48: Europe Fresh Cherries Industry Volume (Metric Tons), by Country 2025 & 2033
- Figure 49: Europe Fresh Cherries Industry Revenue Share (%), by Country 2025 & 2033
- Figure 50: Europe Fresh Cherries Industry Volume Share (%), by Country 2025 & 2033
- Figure 51: Asia Pacific Fresh Cherries Industry Revenue (billion), by Production Analysis 2025 & 2033
- Figure 52: Asia Pacific Fresh Cherries Industry Volume (Metric Tons), by Production Analysis 2025 & 2033
- Figure 53: Asia Pacific Fresh Cherries Industry Revenue Share (%), by Production Analysis 2025 & 2033
- Figure 54: Asia Pacific Fresh Cherries Industry Volume Share (%), by Production Analysis 2025 & 2033
- Figure 55: Asia Pacific Fresh Cherries Industry Revenue (billion), by Consumption Analysis 2025 & 2033
- Figure 56: Asia Pacific Fresh Cherries Industry Volume (Metric Tons), by Consumption Analysis 2025 & 2033
- Figure 57: Asia Pacific Fresh Cherries Industry Revenue Share (%), by Consumption Analysis 2025 & 2033
- Figure 58: Asia Pacific Fresh Cherries Industry Volume Share (%), by Consumption Analysis 2025 & 2033
- Figure 59: Asia Pacific Fresh Cherries Industry Revenue (billion), by Import Market Analysis (Value & Volume) 2025 & 2033
- Figure 60: Asia Pacific Fresh Cherries Industry Volume (Metric Tons), by Import Market Analysis (Value & Volume) 2025 & 2033
- Figure 61: Asia Pacific Fresh Cherries Industry Revenue Share (%), by Import Market Analysis (Value & Volume) 2025 & 2033
- Figure 62: Asia Pacific Fresh Cherries Industry Volume Share (%), by Import Market Analysis (Value & Volume) 2025 & 2033
- Figure 63: Asia Pacific Fresh Cherries Industry Revenue (billion), by Export Market Analysis (Value & Volume) 2025 & 2033
- Figure 64: Asia Pacific Fresh Cherries Industry Volume (Metric Tons), by Export Market Analysis (Value & Volume) 2025 & 2033
- Figure 65: Asia Pacific Fresh Cherries Industry Revenue Share (%), by Export Market Analysis (Value & Volume) 2025 & 2033
- Figure 66: Asia Pacific Fresh Cherries Industry Volume Share (%), by Export Market Analysis (Value & Volume) 2025 & 2033
- Figure 67: Asia Pacific Fresh Cherries Industry Revenue (billion), by Price Trend Analysis 2025 & 2033
- Figure 68: Asia Pacific Fresh Cherries Industry Volume (Metric Tons), by Price Trend Analysis 2025 & 2033
- Figure 69: Asia Pacific Fresh Cherries Industry Revenue Share (%), by Price Trend Analysis 2025 & 2033
- Figure 70: Asia Pacific Fresh Cherries Industry Volume Share (%), by Price Trend Analysis 2025 & 2033
- Figure 71: Asia Pacific Fresh Cherries Industry Revenue (billion), by Country 2025 & 2033
- Figure 72: Asia Pacific Fresh Cherries Industry Volume (Metric Tons), by Country 2025 & 2033
- Figure 73: Asia Pacific Fresh Cherries Industry Revenue Share (%), by Country 2025 & 2033
- Figure 74: Asia Pacific Fresh Cherries Industry Volume Share (%), by Country 2025 & 2033
- Figure 75: South America Fresh Cherries Industry Revenue (billion), by Production Analysis 2025 & 2033
- Figure 76: South America Fresh Cherries Industry Volume (Metric Tons), by Production Analysis 2025 & 2033
- Figure 77: South America Fresh Cherries Industry Revenue Share (%), by Production Analysis 2025 & 2033
- Figure 78: South America Fresh Cherries Industry Volume Share (%), by Production Analysis 2025 & 2033
- Figure 79: South America Fresh Cherries Industry Revenue (billion), by Consumption Analysis 2025 & 2033
- Figure 80: South America Fresh Cherries Industry Volume (Metric Tons), by Consumption Analysis 2025 & 2033
- Figure 81: South America Fresh Cherries Industry Revenue Share (%), by Consumption Analysis 2025 & 2033
- Figure 82: South America Fresh Cherries Industry Volume Share (%), by Consumption Analysis 2025 & 2033
- Figure 83: South America Fresh Cherries Industry Revenue (billion), by Import Market Analysis (Value & Volume) 2025 & 2033
- Figure 84: South America Fresh Cherries Industry Volume (Metric Tons), by Import Market Analysis (Value & Volume) 2025 & 2033
- Figure 85: South America Fresh Cherries Industry Revenue Share (%), by Import Market Analysis (Value & Volume) 2025 & 2033
- Figure 86: South America Fresh Cherries Industry Volume Share (%), by Import Market Analysis (Value & Volume) 2025 & 2033
- Figure 87: South America Fresh Cherries Industry Revenue (billion), by Export Market Analysis (Value & Volume) 2025 & 2033
- Figure 88: South America Fresh Cherries Industry Volume (Metric Tons), by Export Market Analysis (Value & Volume) 2025 & 2033
- Figure 89: South America Fresh Cherries Industry Revenue Share (%), by Export Market Analysis (Value & Volume) 2025 & 2033
- Figure 90: South America Fresh Cherries Industry Volume Share (%), by Export Market Analysis (Value & Volume) 2025 & 2033
- Figure 91: South America Fresh Cherries Industry Revenue (billion), by Price Trend Analysis 2025 & 2033
- Figure 92: South America Fresh Cherries Industry Volume (Metric Tons), by Price Trend Analysis 2025 & 2033
- Figure 93: South America Fresh Cherries Industry Revenue Share (%), by Price Trend Analysis 2025 & 2033
- Figure 94: South America Fresh Cherries Industry Volume Share (%), by Price Trend Analysis 2025 & 2033
- Figure 95: South America Fresh Cherries Industry Revenue (billion), by Country 2025 & 2033
- Figure 96: South America Fresh Cherries Industry Volume (Metric Tons), by Country 2025 & 2033
- Figure 97: South America Fresh Cherries Industry Revenue Share (%), by Country 2025 & 2033
- Figure 98: South America Fresh Cherries Industry Volume Share (%), by Country 2025 & 2033
- Figure 99: Middle East and Africa Fresh Cherries Industry Revenue (billion), by Production Analysis 2025 & 2033
- Figure 100: Middle East and Africa Fresh Cherries Industry Volume (Metric Tons), by Production Analysis 2025 & 2033
- Figure 101: Middle East and Africa Fresh Cherries Industry Revenue Share (%), by Production Analysis 2025 & 2033
- Figure 102: Middle East and Africa Fresh Cherries Industry Volume Share (%), by Production Analysis 2025 & 2033
- Figure 103: Middle East and Africa Fresh Cherries Industry Revenue (billion), by Consumption Analysis 2025 & 2033
- Figure 104: Middle East and Africa Fresh Cherries Industry Volume (Metric Tons), by Consumption Analysis 2025 & 2033
- Figure 105: Middle East and Africa Fresh Cherries Industry Revenue Share (%), by Consumption Analysis 2025 & 2033
- Figure 106: Middle East and Africa Fresh Cherries Industry Volume Share (%), by Consumption Analysis 2025 & 2033
- Figure 107: Middle East and Africa Fresh Cherries Industry Revenue (billion), by Import Market Analysis (Value & Volume) 2025 & 2033
- Figure 108: Middle East and Africa Fresh Cherries Industry Volume (Metric Tons), by Import Market Analysis (Value & Volume) 2025 & 2033
- Figure 109: Middle East and Africa Fresh Cherries Industry Revenue Share (%), by Import Market Analysis (Value & Volume) 2025 & 2033
- Figure 110: Middle East and Africa Fresh Cherries Industry Volume Share (%), by Import Market Analysis (Value & Volume) 2025 & 2033
- Figure 111: Middle East and Africa Fresh Cherries Industry Revenue (billion), by Export Market Analysis (Value & Volume) 2025 & 2033
- Figure 112: Middle East and Africa Fresh Cherries Industry Volume (Metric Tons), by Export Market Analysis (Value & Volume) 2025 & 2033
- Figure 113: Middle East and Africa Fresh Cherries Industry Revenue Share (%), by Export Market Analysis (Value & Volume) 2025 & 2033
- Figure 114: Middle East and Africa Fresh Cherries Industry Volume Share (%), by Export Market Analysis (Value & Volume) 2025 & 2033
- Figure 115: Middle East and Africa Fresh Cherries Industry Revenue (billion), by Price Trend Analysis 2025 & 2033
- Figure 116: Middle East and Africa Fresh Cherries Industry Volume (Metric Tons), by Price Trend Analysis 2025 & 2033
- Figure 117: Middle East and Africa Fresh Cherries Industry Revenue Share (%), by Price Trend Analysis 2025 & 2033
- Figure 118: Middle East and Africa Fresh Cherries Industry Volume Share (%), by Price Trend Analysis 2025 & 2033
- Figure 119: Middle East and Africa Fresh Cherries Industry Revenue (billion), by Country 2025 & 2033
- Figure 120: Middle East and Africa Fresh Cherries Industry Volume (Metric Tons), by Country 2025 & 2033
- Figure 121: Middle East and Africa Fresh Cherries Industry Revenue Share (%), by Country 2025 & 2033
- Figure 122: Middle East and Africa Fresh Cherries Industry Volume Share (%), by Country 2025 & 2033
List of Tables
- Table 1: Global Fresh Cherries Industry Revenue billion Forecast, by Production Analysis 2020 & 2033
- Table 2: Global Fresh Cherries Industry Volume Metric Tons Forecast, by Production Analysis 2020 & 2033
- Table 3: Global Fresh Cherries Industry Revenue billion Forecast, by Consumption Analysis 2020 & 2033
- Table 4: Global Fresh Cherries Industry Volume Metric Tons Forecast, by Consumption Analysis 2020 & 2033
- Table 5: Global Fresh Cherries Industry Revenue billion Forecast, by Import Market Analysis (Value & Volume) 2020 & 2033
- Table 6: Global Fresh Cherries Industry Volume Metric Tons Forecast, by Import Market Analysis (Value & Volume) 2020 & 2033
- Table 7: Global Fresh Cherries Industry Revenue billion Forecast, by Export Market Analysis (Value & Volume) 2020 & 2033
- Table 8: Global Fresh Cherries Industry Volume Metric Tons Forecast, by Export Market Analysis (Value & Volume) 2020 & 2033
- Table 9: Global Fresh Cherries Industry Revenue billion Forecast, by Price Trend Analysis 2020 & 2033
- Table 10: Global Fresh Cherries Industry Volume Metric Tons Forecast, by Price Trend Analysis 2020 & 2033
- Table 11: Global Fresh Cherries Industry Revenue billion Forecast, by Region 2020 & 2033
- Table 12: Global Fresh Cherries Industry Volume Metric Tons Forecast, by Region 2020 & 2033
- Table 13: Global Fresh Cherries Industry Revenue billion Forecast, by Production Analysis 2020 & 2033
- Table 14: Global Fresh Cherries Industry Volume Metric Tons Forecast, by Production Analysis 2020 & 2033
- Table 15: Global Fresh Cherries Industry Revenue billion Forecast, by Consumption Analysis 2020 & 2033
- Table 16: Global Fresh Cherries Industry Volume Metric Tons Forecast, by Consumption Analysis 2020 & 2033
- Table 17: Global Fresh Cherries Industry Revenue billion Forecast, by Import Market Analysis (Value & Volume) 2020 & 2033
- Table 18: Global Fresh Cherries Industry Volume Metric Tons Forecast, by Import Market Analysis (Value & Volume) 2020 & 2033
- Table 19: Global Fresh Cherries Industry Revenue billion Forecast, by Export Market Analysis (Value & Volume) 2020 & 2033
- Table 20: Global Fresh Cherries Industry Volume Metric Tons Forecast, by Export Market Analysis (Value & Volume) 2020 & 2033
- Table 21: Global Fresh Cherries Industry Revenue billion Forecast, by Price Trend Analysis 2020 & 2033
- Table 22: Global Fresh Cherries Industry Volume Metric Tons Forecast, by Price Trend Analysis 2020 & 2033
- Table 23: Global Fresh Cherries Industry Revenue billion Forecast, by Country 2020 & 2033
- Table 24: Global Fresh Cherries Industry Volume Metric Tons Forecast, by Country 2020 & 2033
- Table 25: United States Fresh Cherries Industry Revenue (billion) Forecast, by Application 2020 & 2033
- Table 26: United States Fresh Cherries Industry Volume (Metric Tons) Forecast, by Application 2020 & 2033
- Table 27: Global Fresh Cherries Industry Revenue billion Forecast, by Production Analysis 2020 & 2033
- Table 28: Global Fresh Cherries Industry Volume Metric Tons Forecast, by Production Analysis 2020 & 2033
- Table 29: Global Fresh Cherries Industry Revenue billion Forecast, by Consumption Analysis 2020 & 2033
- Table 30: Global Fresh Cherries Industry Volume Metric Tons Forecast, by Consumption Analysis 2020 & 2033
- Table 31: Global Fresh Cherries Industry Revenue billion Forecast, by Import Market Analysis (Value & Volume) 2020 & 2033
- Table 32: Global Fresh Cherries Industry Volume Metric Tons Forecast, by Import Market Analysis (Value & Volume) 2020 & 2033
- Table 33: Global Fresh Cherries Industry Revenue billion Forecast, by Export Market Analysis (Value & Volume) 2020 & 2033
- Table 34: Global Fresh Cherries Industry Volume Metric Tons Forecast, by Export Market Analysis (Value & Volume) 2020 & 2033
- Table 35: Global Fresh Cherries Industry Revenue billion Forecast, by Price Trend Analysis 2020 & 2033
- Table 36: Global Fresh Cherries Industry Volume Metric Tons Forecast, by Price Trend Analysis 2020 & 2033
- Table 37: Global Fresh Cherries Industry Revenue billion Forecast, by Country 2020 & 2033
- Table 38: Global Fresh Cherries Industry Volume Metric Tons Forecast, by Country 2020 & 2033
- Table 39: Spain Fresh Cherries Industry Revenue (billion) Forecast, by Application 2020 & 2033
- Table 40: Spain Fresh Cherries Industry Volume (Metric Tons) Forecast, by Application 2020 & 2033
- Table 41: Global Fresh Cherries Industry Revenue billion Forecast, by Production Analysis 2020 & 2033
- Table 42: Global Fresh Cherries Industry Volume Metric Tons Forecast, by Production Analysis 2020 & 2033
- Table 43: Global Fresh Cherries Industry Revenue billion Forecast, by Consumption Analysis 2020 & 2033
- Table 44: Global Fresh Cherries Industry Volume Metric Tons Forecast, by Consumption Analysis 2020 & 2033
- Table 45: Global Fresh Cherries Industry Revenue billion Forecast, by Import Market Analysis (Value & Volume) 2020 & 2033
- Table 46: Global Fresh Cherries Industry Volume Metric Tons Forecast, by Import Market Analysis (Value & Volume) 2020 & 2033
- Table 47: Global Fresh Cherries Industry Revenue billion Forecast, by Export Market Analysis (Value & Volume) 2020 & 2033
- Table 48: Global Fresh Cherries Industry Volume Metric Tons Forecast, by Export Market Analysis (Value & Volume) 2020 & 2033
- Table 49: Global Fresh Cherries Industry Revenue billion Forecast, by Price Trend Analysis 2020 & 2033
- Table 50: Global Fresh Cherries Industry Volume Metric Tons Forecast, by Price Trend Analysis 2020 & 2033
- Table 51: Global Fresh Cherries Industry Revenue billion Forecast, by Country 2020 & 2033
- Table 52: Global Fresh Cherries Industry Volume Metric Tons Forecast, by Country 2020 & 2033
- Table 53: China Fresh Cherries Industry Revenue (billion) Forecast, by Application 2020 & 2033
- Table 54: China Fresh Cherries Industry Volume (Metric Tons) Forecast, by Application 2020 & 2033
- Table 55: Global Fresh Cherries Industry Revenue billion Forecast, by Production Analysis 2020 & 2033
- Table 56: Global Fresh Cherries Industry Volume Metric Tons Forecast, by Production Analysis 2020 & 2033
- Table 57: Global Fresh Cherries Industry Revenue billion Forecast, by Consumption Analysis 2020 & 2033
- Table 58: Global Fresh Cherries Industry Volume Metric Tons Forecast, by Consumption Analysis 2020 & 2033
- Table 59: Global Fresh Cherries Industry Revenue billion Forecast, by Import Market Analysis (Value & Volume) 2020 & 2033
- Table 60: Global Fresh Cherries Industry Volume Metric Tons Forecast, by Import Market Analysis (Value & Volume) 2020 & 2033
- Table 61: Global Fresh Cherries Industry Revenue billion Forecast, by Export Market Analysis (Value & Volume) 2020 & 2033
- Table 62: Global Fresh Cherries Industry Volume Metric Tons Forecast, by Export Market Analysis (Value & Volume) 2020 & 2033
- Table 63: Global Fresh Cherries Industry Revenue billion Forecast, by Price Trend Analysis 2020 & 2033
- Table 64: Global Fresh Cherries Industry Volume Metric Tons Forecast, by Price Trend Analysis 2020 & 2033
- Table 65: Global Fresh Cherries Industry Revenue billion Forecast, by Country 2020 & 2033
- Table 66: Global Fresh Cherries Industry Volume Metric Tons Forecast, by Country 2020 & 2033
- Table 67: Chile Fresh Cherries Industry Revenue (billion) Forecast, by Application 2020 & 2033
- Table 68: Chile Fresh Cherries Industry Volume (Metric Tons) Forecast, by Application 2020 & 2033
- Table 69: Global Fresh Cherries Industry Revenue billion Forecast, by Production Analysis 2020 & 2033
- Table 70: Global Fresh Cherries Industry Volume Metric Tons Forecast, by Production Analysis 2020 & 2033
- Table 71: Global Fresh Cherries Industry Revenue billion Forecast, by Consumption Analysis 2020 & 2033
- Table 72: Global Fresh Cherries Industry Volume Metric Tons Forecast, by Consumption Analysis 2020 & 2033
- Table 73: Global Fresh Cherries Industry Revenue billion Forecast, by Import Market Analysis (Value & Volume) 2020 & 2033
- Table 74: Global Fresh Cherries Industry Volume Metric Tons Forecast, by Import Market Analysis (Value & Volume) 2020 & 2033
- Table 75: Global Fresh Cherries Industry Revenue billion Forecast, by Export Market Analysis (Value & Volume) 2020 & 2033
- Table 76: Global Fresh Cherries Industry Volume Metric Tons Forecast, by Export Market Analysis (Value & Volume) 2020 & 2033
- Table 77: Global Fresh Cherries Industry Revenue billion Forecast, by Price Trend Analysis 2020 & 2033
- Table 78: Global Fresh Cherries Industry Volume Metric Tons Forecast, by Price Trend Analysis 2020 & 2033
- Table 79: Global Fresh Cherries Industry Revenue billion Forecast, by Country 2020 & 2033
- Table 80: Global Fresh Cherries Industry Volume Metric Tons Forecast, by Country 2020 & 2033
- Table 81: Turkey Fresh Cherries Industry Revenue (billion) Forecast, by Application 2020 & 2033
- Table 82: Turkey Fresh Cherries Industry Volume (Metric Tons) Forecast, by Application 2020 & 2033
Frequently Asked Questions
1. What is the projected Compound Annual Growth Rate (CAGR) of the Fresh Cherries Industry?
The projected CAGR is approximately 6.9%.
2. Which companies are prominent players in the Fresh Cherries Industry?
Key companies in the market include Erie Fruits International, Rainier Fruit Company , Stemilt Growers , Northwest Cherry Growers , Chelan Fresh .
3. What are the main segments of the Fresh Cherries Industry?
The market segments include Production Analysis, Consumption Analysis, Import Market Analysis (Value & Volume), Export Market Analysis (Value & Volume), Price Trend Analysis.
4. Can you provide details about the market size?
The market size is estimated to be USD 68 billion as of 2022.
5. What are some drivers contributing to market growth?
; Awareness About Health Benefits Associated With Pecan Consumption; Wide Application of Pecan.
6. What are the notable trends driving market growth?
Increasing Demand for Imported Sweet Cherries.
7. Are there any restraints impacting market growth?
; Volatility in the Prices; Adverse Weather Conditions Affecting Yield.
8. Can you provide examples of recent developments in the market?
October 2021: For the 2020-21 season, the United States Department of Agriculture (USDA) reported that US imports of Chilean cherries totaled about 6,800 metric tons. While China has been the main receiver of Chilean cherries, the industry is working diligently to develop other markets, including the United States.
9. What pricing options are available for accessing the report?
Pricing options include single-user, multi-user, and enterprise licenses priced at USD 4750, USD 5250, and USD 8750 respectively.
10. Is the market size provided in terms of value or volume?
The market size is provided in terms of value, measured in billion and volume, measured in Metric Tons.
11. Are there any specific market keywords associated with the report?
Yes, the market keyword associated with the report is "Fresh Cherries Industry," which aids in identifying and referencing the specific market segment covered.
12. How do I determine which pricing option suits my needs best?
The pricing options vary based on user requirements and access needs. Individual users may opt for single-user licenses, while businesses requiring broader access may choose multi-user or enterprise licenses for cost-effective access to the report.
13. Are there any additional resources or data provided in the Fresh Cherries Industry report?
While the report offers comprehensive insights, it's advisable to review the specific contents or supplementary materials provided to ascertain if additional resources or data are available.
14. How can I stay updated on further developments or reports in the Fresh Cherries Industry?
To stay informed about further developments, trends, and reports in the Fresh Cherries Industry, consider subscribing to industry newsletters, following relevant companies and organizations, or regularly checking reputable industry news sources and publications.
Methodology
Step 1 - Identification of Relevant Samples Size from Population Database


Step 2 - Approaches for Defining Global Market Size (Value, Volume* & Price*)

Note*: In applicable scenarios
Step 3 - Data Sources
Primary Research
- Web Analytics
- Survey Reports
- Research Institute
- Latest Research Reports
- Opinion Leaders
Secondary Research
- Annual Reports
- White Paper
- Latest Press Release
- Industry Association
- Paid Database
- Investor Presentations

Step 4 - Data Triangulation
Involves using different sources of information in order to increase the validity of a study
These sources are likely to be stakeholders in a program - participants, other researchers, program staff, other community members, and so on.
Then we put all data in single framework & apply various statistical tools to find out the dynamic on the market.
During the analysis stage, feedback from the stakeholder groups would be compared to determine areas of agreement as well as areas of divergence