

Key Insights
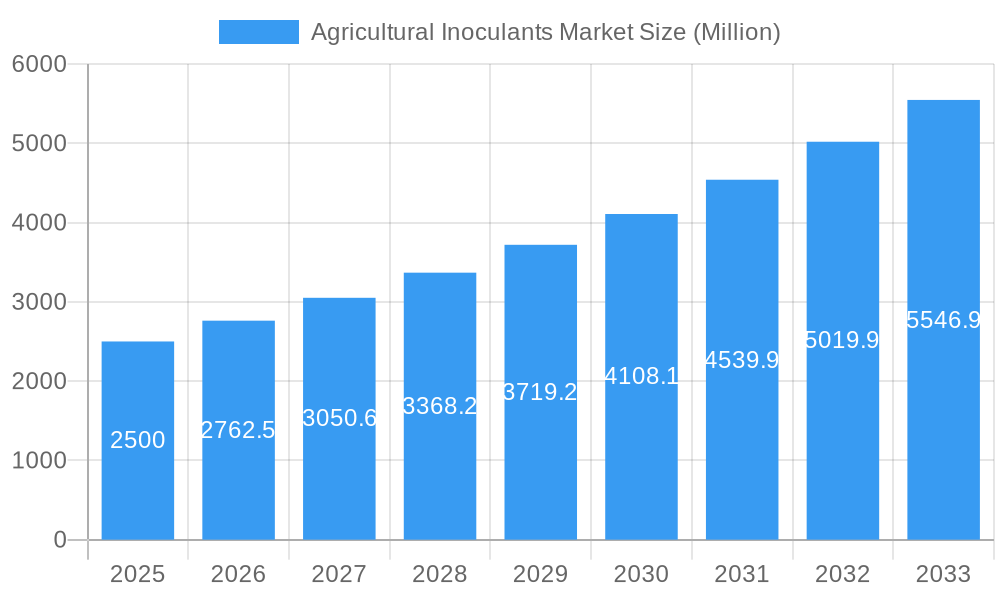
The Agricultural Inoculants Market, valued at approximately $XX million in 2025, is projected to experience robust growth, exhibiting a Compound Annual Growth Rate (CAGR) of 10.50% from 2025 to 2033. This expansion is fueled by several key drivers. Increasing global food demand, coupled with the growing awareness of sustainable agricultural practices, is pushing farmers towards eco-friendly solutions like bio-inoculants. Furthermore, stringent government regulations aimed at reducing reliance on chemical fertilizers and pesticides are creating a favorable environment for the market's growth. The rising adoption of precision agriculture techniques, enabling targeted application of inoculants, also contributes to market expansion. Segment-wise, Crop Nutrition and Seed Inoculation applications are expected to dominate, driven by their efficacy in improving nutrient uptake and germination rates respectively. Geographically, North America and Europe currently hold significant market shares, but the Asia-Pacific region is anticipated to witness the fastest growth due to its expanding agricultural sector and increasing adoption of advanced farming techniques. However, factors like high initial investment costs for implementing inoculant technology and potential inconsistencies in product efficacy across diverse soil and climatic conditions could pose challenges to market growth. Competition amongst established players and emerging biotech firms is intensifying, leading to innovation in product development and application methods.
Agricultural Inoculants Market Market Size (In Billion)
The market segmentation offers diverse opportunities. While Grains and Cereals currently dominate the crop type segment, Pulses and Oilseeds are showing promising growth potential due to increasing demand for these crops. Among microorganisms, Bacteria holds a larger market share compared to Fungi, although both segments are expected to witness significant expansion driven by ongoing research and development in microbial strains with enhanced efficacy. The diversity in mode of application (Seed vs Soil Inoculation) caters to specific crop needs and farming practices, thereby contributing to the market's holistic growth. The presence of key players like Bioceres Crop Solutions, Novozymes, and BASF SE indicates a competitive yet innovative landscape, further driving market evolution and expansion over the forecast period. Future growth will likely be shaped by advancements in inoculant formulation, targeted delivery systems, and a deeper understanding of plant-microbe interactions.
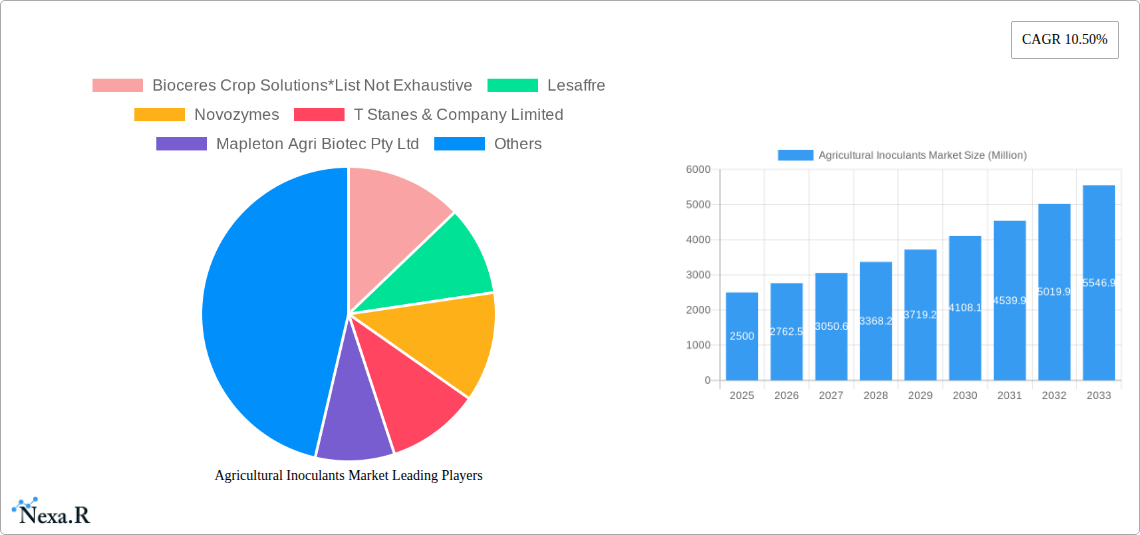
Agricultural Inoculants Market Company Market Share
Agricultural Inoculants Market: A Comprehensive Market Report (2019-2033)
This comprehensive report provides an in-depth analysis of the Agricultural Inoculants Market, encompassing market dynamics, growth trends, regional performance, product landscape, and key players. The study period covers 2019-2033, with 2025 serving as the base and estimated year. This report is essential for industry professionals, investors, and stakeholders seeking a complete understanding of this dynamic market. The market is segmented by function (Crop Nutrition, Crop Protection), microorganism (Bacteria, Fungi, Other Microorganisms), mode of application (Seed Inoculation, Soil Inoculation), and crop type (Grains and Cereals, Pulses and Oilseeds, Commercial Crops, Fruits and Vegetables, Other Applications). The total market size is projected to reach XX Million units by 2033.
Agricultural Inoculants Market Dynamics & Structure
The Agricultural Inoculants market is characterized by moderate concentration, with key players like Bioceres Crop Solutions, Lesaffre, Novozymes, and BASF SE holding significant market share. However, the entry of smaller, specialized companies and ongoing mergers and acquisitions (M&A) activities are shaping the competitive landscape. Technological advancements, particularly in microorganism strain development and delivery systems, are key innovation drivers. Stringent regulatory frameworks concerning biopesticide registration and labeling present challenges but also ensure market integrity. The increasing demand for sustainable agricultural practices and the growing awareness of the benefits of inoculants are major factors propelling market growth. Biofertilizers and other biological alternatives are key competitive substitutes.
- Market Concentration: Moderately concentrated, with top 5 players holding approximately xx% market share in 2024.
- M&A Activity: An average of xx deals annually during 2019-2024, primarily focused on expanding product portfolios and geographical reach.
- Innovation Barriers: High R&D costs, complex regulatory processes, and challenges in scaling up production.
- End-User Demographics: Predominantly large-scale commercial farms, with increasing adoption by smaller farms and organic producers.
Agricultural Inoculants Market Growth Trends & Insights
The Agricultural Inoculants market experienced steady growth during the historical period (2019-2024), driven by factors such as increasing demand for sustainable agriculture, rising crop yields, and growing awareness among farmers regarding the benefits of using inoculants. The market is expected to witness a CAGR of xx% during the forecast period (2025-2033), reaching an estimated size of XX Million units by 2033. This growth is propelled by technological advancements leading to more efficient and effective inoculant formulations, expansion into new geographical markets, and increasing government support for sustainable agricultural practices. Market penetration is highest in developed regions, but emerging markets present significant untapped potential. Consumer behavior is shifting towards environmentally friendly agricultural solutions, favouring the adoption of inoculants. Technological disruptions, such as the development of precision application technologies and novel microorganism strains, are contributing to growth.
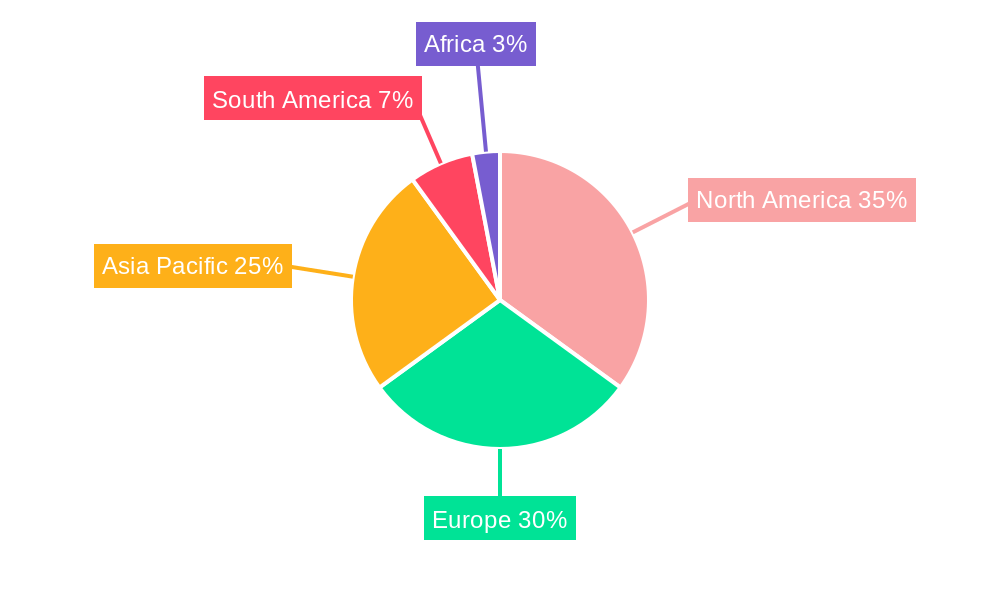
Dominant Regions, Countries, or Segments in Agricultural Inoculants Market
North America and Europe currently dominate the Agricultural Inoculants market, driven by high awareness among farmers, advanced agricultural practices, and strong regulatory support for biopesticides. However, Asia-Pacific is expected to exhibit the highest growth rate during the forecast period due to expanding agricultural land, increasing crop production, and rising adoption of sustainable farming methods.
- Leading Segment: Crop Nutrition segment holds the largest market share due to high demand for nitrogen fixation and phosphorus solubilization.
- Dominant Region: North America, with a market share of approximately xx% in 2024.
- Fastest-Growing Region: Asia-Pacific, driven by increasing agricultural production and government initiatives promoting sustainable agriculture.
- Key Drivers: Favorable government policies, increased investments in agricultural R&D, and growing awareness of environmentally friendly farming practices.
Agricultural Inoculants Market Product Landscape
The Agricultural Inoculants market offers a diverse range of products tailored to specific crops and applications. Innovations focus on improving the efficacy, shelf life, and application methods of inoculants. Products are often formulated as liquid suspensions, powders, or granules, designed for seed or soil application. Technological advancements include the development of encapsulated inoculants for improved survival and efficacy, and the use of advanced microbial screening techniques to identify superior strains. Unique selling propositions often include enhanced nutrient uptake, improved stress tolerance, and increased crop yields.
Key Drivers, Barriers & Challenges in Agricultural Inoculants Market
Key Drivers:
- Growing demand for sustainable and eco-friendly agricultural practices.
- Increasing awareness of the economic and environmental benefits of inoculants.
- Technological advancements leading to improved efficacy and application methods.
- Government regulations and policies promoting the use of biopesticides.
Challenges & Restraints:
- High R&D costs and complexity associated with developing new inoculant strains.
- Lack of awareness among farmers, particularly in developing countries.
- inconsistent product quality and efficacy across different manufacturers.
- Storage and transport issues affecting inoculant viability. This affects approximately xx% of inoculant products annually.
Emerging Opportunities in Agricultural Inoculants Market
- Expanding into new geographical markets with significant agricultural potential.
- Development of inoculants for new crop types and specific soil conditions.
- Increased focus on precision application technologies.
- Collaboration between agricultural technology companies and research institutions to accelerate innovation.
- Growing demand for organic and bio-based agricultural products.
Growth Accelerators in the Agricultural Inoculants Market Industry
Strategic partnerships between inoculant manufacturers and seed companies are accelerating market growth by improving product distribution and access to farmers. Technological breakthroughs, including advanced microbial strain development and precision application techniques, are leading to improved product efficacy and wider adoption. Expanding into emerging markets with strong agricultural sectors is another key growth driver.
Key Players Shaping the Agricultural Inoculants Market Market
- Bioceres Crop Solutions
- Lesaffre
- Novozymes
- T Stanes & Company Limited
- Mapleton Agri Biotec Pty Ltd
- New Edge Microbials Pty Ltd
- AEA Investors (Verdesian Life Sciences LLC)
- Premier Tech
- Lallemond Inc
- BASF SE
Notable Milestones in Agricultural Inoculants Market Sector
- September 2021: Novozymes launched three biological inoculants (BioniQ, TagTeam BioniQPro, and TagTeam BioniQChickpea) in the United States.
- September 2022: Syngenta Seedcare and Bioceres Crop Solutions partnered to commercialize Bioceres' biological solutions globally (excluding Argentina).
- January 2023: Verdesian Life Science launched Accolade, a biological growth enhancement liquid containing Azospirillum brasilense.
In-Depth Agricultural Inoculants Market Market Outlook
The Agricultural Inoculants market is poised for significant growth over the next decade, driven by factors such as increasing demand for sustainable agriculture, technological advancements, and expanding geographical reach. Strategic partnerships and investments in R&D will further accelerate market expansion. Opportunities exist in developing innovative products tailored to specific crop needs and expanding into new geographical markets, particularly in developing countries with significant agricultural potential. The market is expected to witness substantial growth, with a continued increase in adoption rates and a broadening range of applications.
Agricultural Inoculants Market Segmentation
- 1. Production Analysis
- 2. Consumption Analysis
- 3. Import Market Analysis (Value & Volume)
- 4. Export Market Analysis (Value & Volume)
- 5. Price Trend Analysis
Agricultural Inoculants Market Segmentation By Geography
-
1. North America
- 1.1. United States
- 1.2. Canada
- 1.3. Mexico
-
2. South America
- 2.1. Brazil
- 2.2. Argentina
- 2.3. Rest of South America
-
3. Europe
- 3.1. United Kingdom
- 3.2. Germany
- 3.3. France
- 3.4. Italy
- 3.5. Spain
- 3.6. Russia
- 3.7. Benelux
- 3.8. Nordics
- 3.9. Rest of Europe
-
4. Middle East & Africa
- 4.1. Turkey
- 4.2. Israel
- 4.3. GCC
- 4.4. North Africa
- 4.5. South Africa
- 4.6. Rest of Middle East & Africa
-
5. Asia Pacific
- 5.1. China
- 5.2. India
- 5.3. Japan
- 5.4. South Korea
- 5.5. ASEAN
- 5.6. Oceania
- 5.7. Rest of Asia Pacific
Agricultural Inoculants Market Regional Market Share
Geographic Coverage of Agricultural Inoculants Market
Agricultural Inoculants Market REPORT HIGHLIGHTS
| Aspects | Details |
|---|---|
| Study Period | 2020-2034 |
| Base Year | 2025 |
| Estimated Year | 2026 |
| Forecast Period | 2026-2034 |
| Historical Period | 2020-2025 |
| Growth Rate | CAGR of 5.65% from 2020-2034 |
| Segmentation |
|
Table of Contents
- 1. Introduction
- 1.1. Research Scope
- 1.2. Market Segmentation
- 1.3. Research Methodology
- 1.4. Definitions and Assumptions
- 2. Executive Summary
- 2.1. Introduction
- 3. Market Dynamics
- 3.1. Introduction
- 3.2. Market Drivers
- 3.2.1. Adoption of Organic and Eco-friendly Farming Practices; Declining Area of Arable Land and Rising Food Security Concerns
- 3.3. Market Restrains
- 3.3.1. High Demand for Conventional and Synthetic Products; Lack of Awareness and Other Factors Limiting the Adoption of Agricultural Inoculants
- 3.4. Market Trends
- 3.4.1. Adoption of Organic and Eco-friendly Farming Practices
- 4. Market Factor Analysis
- 4.1. Porters Five Forces
- 4.2. Supply/Value Chain
- 4.3. PESTEL analysis
- 4.4. Market Entropy
- 4.5. Patent/Trademark Analysis
- 5. Global Agricultural Inoculants Market Analysis, Insights and Forecast, 2020-2032
- 5.1. Market Analysis, Insights and Forecast - by Production Analysis
- 5.2. Market Analysis, Insights and Forecast - by Consumption Analysis
- 5.3. Market Analysis, Insights and Forecast - by Import Market Analysis (Value & Volume)
- 5.4. Market Analysis, Insights and Forecast - by Export Market Analysis (Value & Volume)
- 5.5. Market Analysis, Insights and Forecast - by Price Trend Analysis
- 5.6. Market Analysis, Insights and Forecast - by Region
- 5.6.1. North America
- 5.6.2. South America
- 5.6.3. Europe
- 5.6.4. Middle East & Africa
- 5.6.5. Asia Pacific
- 5.1. Market Analysis, Insights and Forecast - by Production Analysis
- 6. North America Agricultural Inoculants Market Analysis, Insights and Forecast, 2020-2032
- 6.1. Market Analysis, Insights and Forecast - by Production Analysis
- 6.2. Market Analysis, Insights and Forecast - by Consumption Analysis
- 6.3. Market Analysis, Insights and Forecast - by Import Market Analysis (Value & Volume)
- 6.4. Market Analysis, Insights and Forecast - by Export Market Analysis (Value & Volume)
- 6.5. Market Analysis, Insights and Forecast - by Price Trend Analysis
- 6.1. Market Analysis, Insights and Forecast - by Production Analysis
- 7. South America Agricultural Inoculants Market Analysis, Insights and Forecast, 2020-2032
- 7.1. Market Analysis, Insights and Forecast - by Production Analysis
- 7.2. Market Analysis, Insights and Forecast - by Consumption Analysis
- 7.3. Market Analysis, Insights and Forecast - by Import Market Analysis (Value & Volume)
- 7.4. Market Analysis, Insights and Forecast - by Export Market Analysis (Value & Volume)
- 7.5. Market Analysis, Insights and Forecast - by Price Trend Analysis
- 7.1. Market Analysis, Insights and Forecast - by Production Analysis
- 8. Europe Agricultural Inoculants Market Analysis, Insights and Forecast, 2020-2032
- 8.1. Market Analysis, Insights and Forecast - by Production Analysis
- 8.2. Market Analysis, Insights and Forecast - by Consumption Analysis
- 8.3. Market Analysis, Insights and Forecast - by Import Market Analysis (Value & Volume)
- 8.4. Market Analysis, Insights and Forecast - by Export Market Analysis (Value & Volume)
- 8.5. Market Analysis, Insights and Forecast - by Price Trend Analysis
- 8.1. Market Analysis, Insights and Forecast - by Production Analysis
- 9. Middle East & Africa Agricultural Inoculants Market Analysis, Insights and Forecast, 2020-2032
- 9.1. Market Analysis, Insights and Forecast - by Production Analysis
- 9.2. Market Analysis, Insights and Forecast - by Consumption Analysis
- 9.3. Market Analysis, Insights and Forecast - by Import Market Analysis (Value & Volume)
- 9.4. Market Analysis, Insights and Forecast - by Export Market Analysis (Value & Volume)
- 9.5. Market Analysis, Insights and Forecast - by Price Trend Analysis
- 9.1. Market Analysis, Insights and Forecast - by Production Analysis
- 10. Asia Pacific Agricultural Inoculants Market Analysis, Insights and Forecast, 2020-2032
- 10.1. Market Analysis, Insights and Forecast - by Production Analysis
- 10.2. Market Analysis, Insights and Forecast - by Consumption Analysis
- 10.3. Market Analysis, Insights and Forecast - by Import Market Analysis (Value & Volume)
- 10.4. Market Analysis, Insights and Forecast - by Export Market Analysis (Value & Volume)
- 10.5. Market Analysis, Insights and Forecast - by Price Trend Analysis
- 10.1. Market Analysis, Insights and Forecast - by Production Analysis
- 11. Competitive Analysis
- 11.1. Global Market Share Analysis 2025
- 11.2. Company Profiles
- 11.2.1 Bioceres Crop Solutions*List Not Exhaustive
- 11.2.1.1. Overview
- 11.2.1.2. Products
- 11.2.1.3. SWOT Analysis
- 11.2.1.4. Recent Developments
- 11.2.1.5. Financials (Based on Availability)
- 11.2.2 Lesaffre
- 11.2.2.1. Overview
- 11.2.2.2. Products
- 11.2.2.3. SWOT Analysis
- 11.2.2.4. Recent Developments
- 11.2.2.5. Financials (Based on Availability)
- 11.2.3 Novozymes
- 11.2.3.1. Overview
- 11.2.3.2. Products
- 11.2.3.3. SWOT Analysis
- 11.2.3.4. Recent Developments
- 11.2.3.5. Financials (Based on Availability)
- 11.2.4 T Stanes & Company Limited
- 11.2.4.1. Overview
- 11.2.4.2. Products
- 11.2.4.3. SWOT Analysis
- 11.2.4.4. Recent Developments
- 11.2.4.5. Financials (Based on Availability)
- 11.2.5 Mapleton Agri Biotec Pty Ltd
- 11.2.5.1. Overview
- 11.2.5.2. Products
- 11.2.5.3. SWOT Analysis
- 11.2.5.4. Recent Developments
- 11.2.5.5. Financials (Based on Availability)
- 11.2.6 New Edge Microbials Pty Ltd
- 11.2.6.1. Overview
- 11.2.6.2. Products
- 11.2.6.3. SWOT Analysis
- 11.2.6.4. Recent Developments
- 11.2.6.5. Financials (Based on Availability)
- 11.2.7 AEA Investors (Verdesian Life Sciences LLC)
- 11.2.7.1. Overview
- 11.2.7.2. Products
- 11.2.7.3. SWOT Analysis
- 11.2.7.4. Recent Developments
- 11.2.7.5. Financials (Based on Availability)
- 11.2.8 Premier Tech
- 11.2.8.1. Overview
- 11.2.8.2. Products
- 11.2.8.3. SWOT Analysis
- 11.2.8.4. Recent Developments
- 11.2.8.5. Financials (Based on Availability)
- 11.2.9 Lallemond Inc
- 11.2.9.1. Overview
- 11.2.9.2. Products
- 11.2.9.3. SWOT Analysis
- 11.2.9.4. Recent Developments
- 11.2.9.5. Financials (Based on Availability)
- 11.2.10 BASF SE
- 11.2.10.1. Overview
- 11.2.10.2. Products
- 11.2.10.3. SWOT Analysis
- 11.2.10.4. Recent Developments
- 11.2.10.5. Financials (Based on Availability)
- 11.2.1 Bioceres Crop Solutions*List Not Exhaustive
List of Figures
- Figure 1: Global Agricultural Inoculants Market Revenue Breakdown (undefined, %) by Region 2025 & 2033
- Figure 2: North America Agricultural Inoculants Market Revenue (undefined), by Production Analysis 2025 & 2033
- Figure 3: North America Agricultural Inoculants Market Revenue Share (%), by Production Analysis 2025 & 2033
- Figure 4: North America Agricultural Inoculants Market Revenue (undefined), by Consumption Analysis 2025 & 2033
- Figure 5: North America Agricultural Inoculants Market Revenue Share (%), by Consumption Analysis 2025 & 2033
- Figure 6: North America Agricultural Inoculants Market Revenue (undefined), by Import Market Analysis (Value & Volume) 2025 & 2033
- Figure 7: North America Agricultural Inoculants Market Revenue Share (%), by Import Market Analysis (Value & Volume) 2025 & 2033
- Figure 8: North America Agricultural Inoculants Market Revenue (undefined), by Export Market Analysis (Value & Volume) 2025 & 2033
- Figure 9: North America Agricultural Inoculants Market Revenue Share (%), by Export Market Analysis (Value & Volume) 2025 & 2033
- Figure 10: North America Agricultural Inoculants Market Revenue (undefined), by Price Trend Analysis 2025 & 2033
- Figure 11: North America Agricultural Inoculants Market Revenue Share (%), by Price Trend Analysis 2025 & 2033
- Figure 12: North America Agricultural Inoculants Market Revenue (undefined), by Country 2025 & 2033
- Figure 13: North America Agricultural Inoculants Market Revenue Share (%), by Country 2025 & 2033
- Figure 14: South America Agricultural Inoculants Market Revenue (undefined), by Production Analysis 2025 & 2033
- Figure 15: South America Agricultural Inoculants Market Revenue Share (%), by Production Analysis 2025 & 2033
- Figure 16: South America Agricultural Inoculants Market Revenue (undefined), by Consumption Analysis 2025 & 2033
- Figure 17: South America Agricultural Inoculants Market Revenue Share (%), by Consumption Analysis 2025 & 2033
- Figure 18: South America Agricultural Inoculants Market Revenue (undefined), by Import Market Analysis (Value & Volume) 2025 & 2033
- Figure 19: South America Agricultural Inoculants Market Revenue Share (%), by Import Market Analysis (Value & Volume) 2025 & 2033
- Figure 20: South America Agricultural Inoculants Market Revenue (undefined), by Export Market Analysis (Value & Volume) 2025 & 2033
- Figure 21: South America Agricultural Inoculants Market Revenue Share (%), by Export Market Analysis (Value & Volume) 2025 & 2033
- Figure 22: South America Agricultural Inoculants Market Revenue (undefined), by Price Trend Analysis 2025 & 2033
- Figure 23: South America Agricultural Inoculants Market Revenue Share (%), by Price Trend Analysis 2025 & 2033
- Figure 24: South America Agricultural Inoculants Market Revenue (undefined), by Country 2025 & 2033
- Figure 25: South America Agricultural Inoculants Market Revenue Share (%), by Country 2025 & 2033
- Figure 26: Europe Agricultural Inoculants Market Revenue (undefined), by Production Analysis 2025 & 2033
- Figure 27: Europe Agricultural Inoculants Market Revenue Share (%), by Production Analysis 2025 & 2033
- Figure 28: Europe Agricultural Inoculants Market Revenue (undefined), by Consumption Analysis 2025 & 2033
- Figure 29: Europe Agricultural Inoculants Market Revenue Share (%), by Consumption Analysis 2025 & 2033
- Figure 30: Europe Agricultural Inoculants Market Revenue (undefined), by Import Market Analysis (Value & Volume) 2025 & 2033
- Figure 31: Europe Agricultural Inoculants Market Revenue Share (%), by Import Market Analysis (Value & Volume) 2025 & 2033
- Figure 32: Europe Agricultural Inoculants Market Revenue (undefined), by Export Market Analysis (Value & Volume) 2025 & 2033
- Figure 33: Europe Agricultural Inoculants Market Revenue Share (%), by Export Market Analysis (Value & Volume) 2025 & 2033
- Figure 34: Europe Agricultural Inoculants Market Revenue (undefined), by Price Trend Analysis 2025 & 2033
- Figure 35: Europe Agricultural Inoculants Market Revenue Share (%), by Price Trend Analysis 2025 & 2033
- Figure 36: Europe Agricultural Inoculants Market Revenue (undefined), by Country 2025 & 2033
- Figure 37: Europe Agricultural Inoculants Market Revenue Share (%), by Country 2025 & 2033
- Figure 38: Middle East & Africa Agricultural Inoculants Market Revenue (undefined), by Production Analysis 2025 & 2033
- Figure 39: Middle East & Africa Agricultural Inoculants Market Revenue Share (%), by Production Analysis 2025 & 2033
- Figure 40: Middle East & Africa Agricultural Inoculants Market Revenue (undefined), by Consumption Analysis 2025 & 2033
- Figure 41: Middle East & Africa Agricultural Inoculants Market Revenue Share (%), by Consumption Analysis 2025 & 2033
- Figure 42: Middle East & Africa Agricultural Inoculants Market Revenue (undefined), by Import Market Analysis (Value & Volume) 2025 & 2033
- Figure 43: Middle East & Africa Agricultural Inoculants Market Revenue Share (%), by Import Market Analysis (Value & Volume) 2025 & 2033
- Figure 44: Middle East & Africa Agricultural Inoculants Market Revenue (undefined), by Export Market Analysis (Value & Volume) 2025 & 2033
- Figure 45: Middle East & Africa Agricultural Inoculants Market Revenue Share (%), by Export Market Analysis (Value & Volume) 2025 & 2033
- Figure 46: Middle East & Africa Agricultural Inoculants Market Revenue (undefined), by Price Trend Analysis 2025 & 2033
- Figure 47: Middle East & Africa Agricultural Inoculants Market Revenue Share (%), by Price Trend Analysis 2025 & 2033
- Figure 48: Middle East & Africa Agricultural Inoculants Market Revenue (undefined), by Country 2025 & 2033
- Figure 49: Middle East & Africa Agricultural Inoculants Market Revenue Share (%), by Country 2025 & 2033
- Figure 50: Asia Pacific Agricultural Inoculants Market Revenue (undefined), by Production Analysis 2025 & 2033
- Figure 51: Asia Pacific Agricultural Inoculants Market Revenue Share (%), by Production Analysis 2025 & 2033
- Figure 52: Asia Pacific Agricultural Inoculants Market Revenue (undefined), by Consumption Analysis 2025 & 2033
- Figure 53: Asia Pacific Agricultural Inoculants Market Revenue Share (%), by Consumption Analysis 2025 & 2033
- Figure 54: Asia Pacific Agricultural Inoculants Market Revenue (undefined), by Import Market Analysis (Value & Volume) 2025 & 2033
- Figure 55: Asia Pacific Agricultural Inoculants Market Revenue Share (%), by Import Market Analysis (Value & Volume) 2025 & 2033
- Figure 56: Asia Pacific Agricultural Inoculants Market Revenue (undefined), by Export Market Analysis (Value & Volume) 2025 & 2033
- Figure 57: Asia Pacific Agricultural Inoculants Market Revenue Share (%), by Export Market Analysis (Value & Volume) 2025 & 2033
- Figure 58: Asia Pacific Agricultural Inoculants Market Revenue (undefined), by Price Trend Analysis 2025 & 2033
- Figure 59: Asia Pacific Agricultural Inoculants Market Revenue Share (%), by Price Trend Analysis 2025 & 2033
- Figure 60: Asia Pacific Agricultural Inoculants Market Revenue (undefined), by Country 2025 & 2033
- Figure 61: Asia Pacific Agricultural Inoculants Market Revenue Share (%), by Country 2025 & 2033
List of Tables
- Table 1: Global Agricultural Inoculants Market Revenue undefined Forecast, by Production Analysis 2020 & 2033
- Table 2: Global Agricultural Inoculants Market Revenue undefined Forecast, by Consumption Analysis 2020 & 2033
- Table 3: Global Agricultural Inoculants Market Revenue undefined Forecast, by Import Market Analysis (Value & Volume) 2020 & 2033
- Table 4: Global Agricultural Inoculants Market Revenue undefined Forecast, by Export Market Analysis (Value & Volume) 2020 & 2033
- Table 5: Global Agricultural Inoculants Market Revenue undefined Forecast, by Price Trend Analysis 2020 & 2033
- Table 6: Global Agricultural Inoculants Market Revenue undefined Forecast, by Region 2020 & 2033
- Table 7: Global Agricultural Inoculants Market Revenue undefined Forecast, by Production Analysis 2020 & 2033
- Table 8: Global Agricultural Inoculants Market Revenue undefined Forecast, by Consumption Analysis 2020 & 2033
- Table 9: Global Agricultural Inoculants Market Revenue undefined Forecast, by Import Market Analysis (Value & Volume) 2020 & 2033
- Table 10: Global Agricultural Inoculants Market Revenue undefined Forecast, by Export Market Analysis (Value & Volume) 2020 & 2033
- Table 11: Global Agricultural Inoculants Market Revenue undefined Forecast, by Price Trend Analysis 2020 & 2033
- Table 12: Global Agricultural Inoculants Market Revenue undefined Forecast, by Country 2020 & 2033
- Table 13: United States Agricultural Inoculants Market Revenue (undefined) Forecast, by Application 2020 & 2033
- Table 14: Canada Agricultural Inoculants Market Revenue (undefined) Forecast, by Application 2020 & 2033
- Table 15: Mexico Agricultural Inoculants Market Revenue (undefined) Forecast, by Application 2020 & 2033
- Table 16: Global Agricultural Inoculants Market Revenue undefined Forecast, by Production Analysis 2020 & 2033
- Table 17: Global Agricultural Inoculants Market Revenue undefined Forecast, by Consumption Analysis 2020 & 2033
- Table 18: Global Agricultural Inoculants Market Revenue undefined Forecast, by Import Market Analysis (Value & Volume) 2020 & 2033
- Table 19: Global Agricultural Inoculants Market Revenue undefined Forecast, by Export Market Analysis (Value & Volume) 2020 & 2033
- Table 20: Global Agricultural Inoculants Market Revenue undefined Forecast, by Price Trend Analysis 2020 & 2033
- Table 21: Global Agricultural Inoculants Market Revenue undefined Forecast, by Country 2020 & 2033
- Table 22: Brazil Agricultural Inoculants Market Revenue (undefined) Forecast, by Application 2020 & 2033
- Table 23: Argentina Agricultural Inoculants Market Revenue (undefined) Forecast, by Application 2020 & 2033
- Table 24: Rest of South America Agricultural Inoculants Market Revenue (undefined) Forecast, by Application 2020 & 2033
- Table 25: Global Agricultural Inoculants Market Revenue undefined Forecast, by Production Analysis 2020 & 2033
- Table 26: Global Agricultural Inoculants Market Revenue undefined Forecast, by Consumption Analysis 2020 & 2033
- Table 27: Global Agricultural Inoculants Market Revenue undefined Forecast, by Import Market Analysis (Value & Volume) 2020 & 2033
- Table 28: Global Agricultural Inoculants Market Revenue undefined Forecast, by Export Market Analysis (Value & Volume) 2020 & 2033
- Table 29: Global Agricultural Inoculants Market Revenue undefined Forecast, by Price Trend Analysis 2020 & 2033
- Table 30: Global Agricultural Inoculants Market Revenue undefined Forecast, by Country 2020 & 2033
- Table 31: United Kingdom Agricultural Inoculants Market Revenue (undefined) Forecast, by Application 2020 & 2033
- Table 32: Germany Agricultural Inoculants Market Revenue (undefined) Forecast, by Application 2020 & 2033
- Table 33: France Agricultural Inoculants Market Revenue (undefined) Forecast, by Application 2020 & 2033
- Table 34: Italy Agricultural Inoculants Market Revenue (undefined) Forecast, by Application 2020 & 2033
- Table 35: Spain Agricultural Inoculants Market Revenue (undefined) Forecast, by Application 2020 & 2033
- Table 36: Russia Agricultural Inoculants Market Revenue (undefined) Forecast, by Application 2020 & 2033
- Table 37: Benelux Agricultural Inoculants Market Revenue (undefined) Forecast, by Application 2020 & 2033
- Table 38: Nordics Agricultural Inoculants Market Revenue (undefined) Forecast, by Application 2020 & 2033
- Table 39: Rest of Europe Agricultural Inoculants Market Revenue (undefined) Forecast, by Application 2020 & 2033
- Table 40: Global Agricultural Inoculants Market Revenue undefined Forecast, by Production Analysis 2020 & 2033
- Table 41: Global Agricultural Inoculants Market Revenue undefined Forecast, by Consumption Analysis 2020 & 2033
- Table 42: Global Agricultural Inoculants Market Revenue undefined Forecast, by Import Market Analysis (Value & Volume) 2020 & 2033
- Table 43: Global Agricultural Inoculants Market Revenue undefined Forecast, by Export Market Analysis (Value & Volume) 2020 & 2033
- Table 44: Global Agricultural Inoculants Market Revenue undefined Forecast, by Price Trend Analysis 2020 & 2033
- Table 45: Global Agricultural Inoculants Market Revenue undefined Forecast, by Country 2020 & 2033
- Table 46: Turkey Agricultural Inoculants Market Revenue (undefined) Forecast, by Application 2020 & 2033
- Table 47: Israel Agricultural Inoculants Market Revenue (undefined) Forecast, by Application 2020 & 2033
- Table 48: GCC Agricultural Inoculants Market Revenue (undefined) Forecast, by Application 2020 & 2033
- Table 49: North Africa Agricultural Inoculants Market Revenue (undefined) Forecast, by Application 2020 & 2033
- Table 50: South Africa Agricultural Inoculants Market Revenue (undefined) Forecast, by Application 2020 & 2033
- Table 51: Rest of Middle East & Africa Agricultural Inoculants Market Revenue (undefined) Forecast, by Application 2020 & 2033
- Table 52: Global Agricultural Inoculants Market Revenue undefined Forecast, by Production Analysis 2020 & 2033
- Table 53: Global Agricultural Inoculants Market Revenue undefined Forecast, by Consumption Analysis 2020 & 2033
- Table 54: Global Agricultural Inoculants Market Revenue undefined Forecast, by Import Market Analysis (Value & Volume) 2020 & 2033
- Table 55: Global Agricultural Inoculants Market Revenue undefined Forecast, by Export Market Analysis (Value & Volume) 2020 & 2033
- Table 56: Global Agricultural Inoculants Market Revenue undefined Forecast, by Price Trend Analysis 2020 & 2033
- Table 57: Global Agricultural Inoculants Market Revenue undefined Forecast, by Country 2020 & 2033
- Table 58: China Agricultural Inoculants Market Revenue (undefined) Forecast, by Application 2020 & 2033
- Table 59: India Agricultural Inoculants Market Revenue (undefined) Forecast, by Application 2020 & 2033
- Table 60: Japan Agricultural Inoculants Market Revenue (undefined) Forecast, by Application 2020 & 2033
- Table 61: South Korea Agricultural Inoculants Market Revenue (undefined) Forecast, by Application 2020 & 2033
- Table 62: ASEAN Agricultural Inoculants Market Revenue (undefined) Forecast, by Application 2020 & 2033
- Table 63: Oceania Agricultural Inoculants Market Revenue (undefined) Forecast, by Application 2020 & 2033
- Table 64: Rest of Asia Pacific Agricultural Inoculants Market Revenue (undefined) Forecast, by Application 2020 & 2033
Frequently Asked Questions
1. What is the projected Compound Annual Growth Rate (CAGR) of the Agricultural Inoculants Market?
The projected CAGR is approximately 5.65%.
2. Which companies are prominent players in the Agricultural Inoculants Market?
Key companies in the market include Bioceres Crop Solutions*List Not Exhaustive, Lesaffre, Novozymes, T Stanes & Company Limited, Mapleton Agri Biotec Pty Ltd, New Edge Microbials Pty Ltd, AEA Investors (Verdesian Life Sciences LLC), Premier Tech, Lallemond Inc, BASF SE.
3. What are the main segments of the Agricultural Inoculants Market?
The market segments include Production Analysis, Consumption Analysis, Import Market Analysis (Value & Volume), Export Market Analysis (Value & Volume), Price Trend Analysis.
4. Can you provide details about the market size?
The market size is estimated to be USD XXX N/A as of 2022.
5. What are some drivers contributing to market growth?
Adoption of Organic and Eco-friendly Farming Practices; Declining Area of Arable Land and Rising Food Security Concerns.
6. What are the notable trends driving market growth?
Adoption of Organic and Eco-friendly Farming Practices.
7. Are there any restraints impacting market growth?
High Demand for Conventional and Synthetic Products; Lack of Awareness and Other Factors Limiting the Adoption of Agricultural Inoculants.
8. Can you provide examples of recent developments in the market?
January 2023: VerdesianLife Science launched Accolade, a new biological growth enhancement liquid for crops containing Azospirillum Brasilense, a fixing bacterium that can increase root development and secondary lateral root systems, leading to increased nutrient uptake and higher yields.
9. What pricing options are available for accessing the report?
Pricing options include single-user, multi-user, and enterprise licenses priced at USD 4750, USD 5250, and USD 8750 respectively.
10. Is the market size provided in terms of value or volume?
The market size is provided in terms of value, measured in N/A.
11. Are there any specific market keywords associated with the report?
Yes, the market keyword associated with the report is "Agricultural Inoculants Market," which aids in identifying and referencing the specific market segment covered.
12. How do I determine which pricing option suits my needs best?
The pricing options vary based on user requirements and access needs. Individual users may opt for single-user licenses, while businesses requiring broader access may choose multi-user or enterprise licenses for cost-effective access to the report.
13. Are there any additional resources or data provided in the Agricultural Inoculants Market report?
While the report offers comprehensive insights, it's advisable to review the specific contents or supplementary materials provided to ascertain if additional resources or data are available.
14. How can I stay updated on further developments or reports in the Agricultural Inoculants Market?
To stay informed about further developments, trends, and reports in the Agricultural Inoculants Market, consider subscribing to industry newsletters, following relevant companies and organizations, or regularly checking reputable industry news sources and publications.
Methodology
Step 1 - Identification of Relevant Samples Size from Population Database


Step 2 - Approaches for Defining Global Market Size (Value, Volume* & Price*)

Note*: In applicable scenarios
Step 3 - Data Sources
Primary Research
- Web Analytics
- Survey Reports
- Research Institute
- Latest Research Reports
- Opinion Leaders
Secondary Research
- Annual Reports
- White Paper
- Latest Press Release
- Industry Association
- Paid Database
- Investor Presentations

Step 4 - Data Triangulation
Involves using different sources of information in order to increase the validity of a study
These sources are likely to be stakeholders in a program - participants, other researchers, program staff, other community members, and so on.
Then we put all data in single framework & apply various statistical tools to find out the dynamic on the market.
During the analysis stage, feedback from the stakeholder groups would be compared to determine areas of agreement as well as areas of divergence