

Key Insights
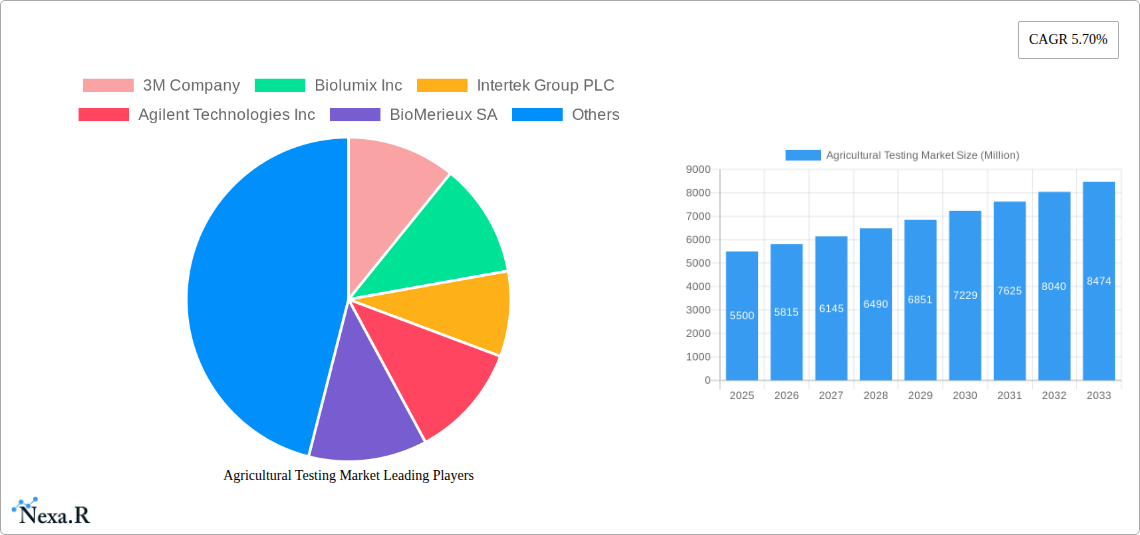
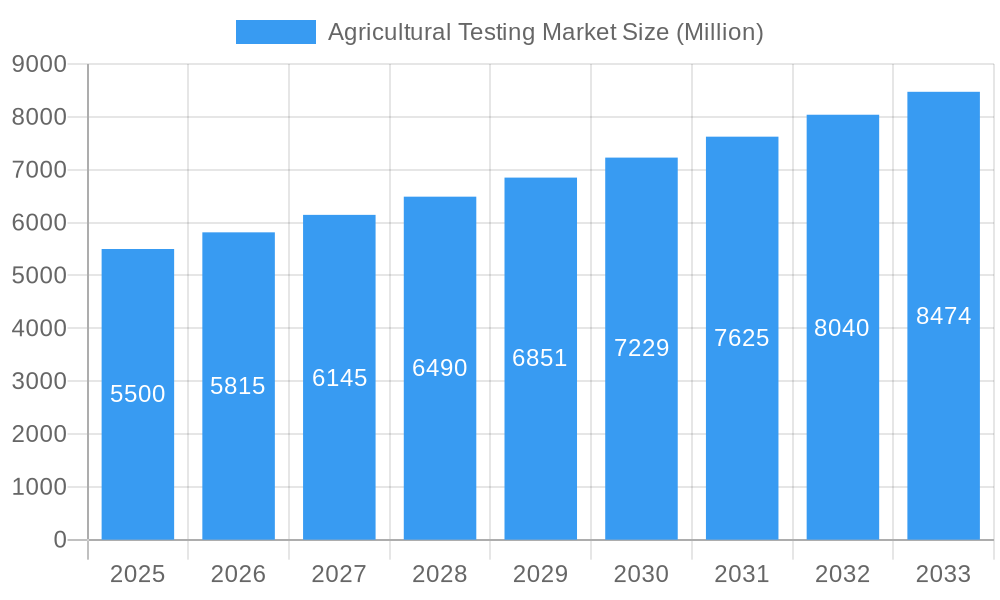
The global Agricultural Testing Market is poised for significant expansion, projected to reach an estimated market size of $5,500 million by the end of 2025, exhibiting a robust Compound Annual Growth Rate (CAGR) of 5.70% throughout the forecast period of 2025-2033. This growth is primarily fueled by an escalating global demand for safe and high-quality food products, stringent regulatory frameworks governing food safety and environmental standards, and the increasing adoption of precision agriculture techniques. Farmers and agricultural stakeholders are increasingly investing in comprehensive testing services to ensure crop health, soil fertility, and the absence of harmful contaminants, thereby enhancing yield and marketability. Furthermore, growing awareness regarding the detrimental effects of pesticide residues and genetically modified organisms (GMOs) in food products is driving the demand for advanced testing solutions. The market is also experiencing a surge in demand for disease diagnostics in livestock and aquaculture, further contributing to its upward trajectory.
Agricultural Testing Market Market Size (In Billion)
Key market drivers include the imperative to comply with international food safety standards, the need for residue analysis of pesticides, herbicides, and fungicides, and the growing focus on soil health and nutrient management. Innovations in analytical technologies, such as advanced molecular diagnostics and chromatography, are enhancing the accuracy and speed of testing, making it more accessible and cost-effective. The market is segmented across various testing types, including soil analysis, water testing, seed testing, food and feed analysis, and disease diagnostics. Geographically, Asia Pacific is anticipated to witness the fastest growth due to its large agricultural base and increasing investments in modern farming practices, while North America and Europe remain dominant markets due to well-established regulatory landscapes and high consumer awareness. Major restraints include the high initial cost of advanced testing equipment and the shortage of skilled personnel in certain regions, though these are being mitigated by technological advancements and training initiatives.
Agricultural Testing Market Company Market Share
Agricultural Testing Market: Comprehensive Market Analysis and Future Outlook (2019–2033)
This in-depth report provides a definitive analysis of the global Agricultural Testing Market, meticulously examining its dynamics, growth trends, and future trajectory. Covering the historical period from 2019 to 2024, with a base and estimated year of 2025, the report forecasts market evolution through 2033. It delivers granular insights into production and consumption analyses, import/export markets (value and volume), and price trends. The report leverages high-traffic keywords such as "agricultural testing," "soil testing," "food safety testing," "crop diagnostics," "agrichemical testing," "plant pathology testing," and "livestock testing" to ensure maximum search engine visibility for industry professionals and stakeholders seeking critical market intelligence.
Key Market Segments Covered:
This report is an indispensable resource for agribusinesses, testing laboratories, government agencies, investors, and technology providers aiming to navigate the complexities and capitalize on the significant growth opportunities within the Agricultural Testing Market.
- Production Analysis: Understanding the supply-side landscape of agricultural testing services and technologies.
- Consumption Analysis: Gauging the demand for agricultural testing across various end-user industries and geographical regions.
- Import Market Analysis (Value & Volume): Analyzing the flow of agricultural testing products and services into different markets.
- Export Market Analysis (Value & Volume): Examining the global reach and competitiveness of agricultural testing solutions.
- Price Trend Analysis: Tracking historical and projected price movements for agricultural testing services and equipment.
Agricultural Testing Market Dynamics & Structure
The Agricultural Testing Market is characterized by a moderate to high concentration, with key players investing heavily in technological innovation and strategic acquisitions. The primary drivers of market growth stem from increasing global food demand, stringent food safety regulations, and a growing emphasis on sustainable agricultural practices. Technological advancements in areas like genomics, spectroscopy, and digital diagnostics are revolutionizing crop health monitoring, soil analysis, and residue testing, thereby enhancing efficiency and accuracy. Regulatory frameworks, particularly concerning pesticide residues, genetically modified organisms (GMOs), and foodborne pathogens, are compelling wider adoption of rigorous testing protocols. Competitive product substitutes exist, ranging from traditional wet chemistry methods to advanced biosensors, each offering different cost-benefit profiles. End-user demographics are diversifying, with smallholder farmers increasingly seeking accessible testing solutions alongside large-scale agricultural corporations and food manufacturers. Mergers and acquisitions (M&A) are a significant trend, as established companies acquire smaller, innovative firms to expand their service portfolios and geographical reach. For instance, the market has witnessed numerous deals aimed at consolidating laboratory networks or integrating cutting-edge diagnostic technologies.
- Market Concentration: Dominated by a mix of large multinational corporations and specialized regional laboratories.
- Technological Innovation Drivers: Advancements in DNA sequencing, PCR, immunoassay, spectroscopy (NIR, LIBS), and IoT-enabled sensors for real-time monitoring.
- Regulatory Frameworks: Increasing stringency in food safety, pesticide residue limits, and environmental compliance across major agricultural economies.
- Competitive Product Substitutes: Traditional lab-based testing vs. on-site portable diagnostic kits and remote sensing technologies.
- End-User Demographics: Expansion from large corporations to SMEs, organic farmers, and government agricultural departments.
- M&A Trends: Frequent consolidation to gain market share, access new technologies, and broaden service offerings.
Agricultural Testing Market Growth Trends & Insights
The Agricultural Testing Market is projected for substantial growth, driven by an escalating global population that necessitates increased food production, coupled with a heightened awareness of food safety and quality. This surge in demand is fundamentally reshaping agricultural practices, pushing for greater reliance on scientific testing and analysis to optimize crop yields, ensure product integrity, and meet evolving consumer expectations. The adoption rates of advanced agricultural testing services are steadily climbing, propelled by the undeniable benefits they offer, including early disease detection, precise nutrient management, and effective pest control strategies. These benefits translate directly into reduced crop losses and improved farm profitability. Technological disruptions are at the forefront of this market expansion, with innovations like AI-powered image analysis for disease identification, rapid molecular diagnostic tools for pathogen detection, and sophisticated soil sensing technologies providing unprecedented levels of insight into farm conditions. These advancements are making testing more accessible, faster, and more accurate than ever before.
Consumer behavior shifts are also playing a pivotal role. Consumers are increasingly demanding transparency regarding the origin and safety of their food, driving stricter testing requirements throughout the agricultural supply chain, from the farm to the fork. This includes a growing preference for organically grown produce and products free from harmful residues, which mandates rigorous testing for pesticides, heavy metals, and other contaminants. Furthermore, the global push towards sustainable agriculture and the imperative to mitigate the environmental impact of farming are creating new avenues for testing services, such as soil health assessments and water quality analyses. The market size evolution is a testament to these converging trends, with consistent year-on-year growth anticipated. For example, the market penetration of advanced soil nutrient testing has significantly increased, allowing farmers to apply fertilizers more judiciously, thereby reducing waste and environmental runoff. The overall CAGR for the Agricultural Testing Market is expected to remain robust throughout the forecast period, reflecting its critical importance in modern agriculture and food systems.
Dominant Regions, Countries, or Segments in Agricultural Testing Market
North America currently stands as a dominant region in the Agricultural Testing Market, driven by its technologically advanced agricultural sector, robust regulatory framework, and substantial investments in research and development. The United States, in particular, is a powerhouse, owing to its large-scale commercial farming operations, stringent food safety standards enforced by agencies like the FDA and USDA, and a proactive approach to adopting innovative agricultural technologies. The Consumption Analysis segment within North America is particularly strong, reflecting the widespread demand for diverse testing services across crop production, livestock management, and food processing.
Key drivers of this regional dominance include:
- Economic Policies: Supportive government policies that encourage innovation and the adoption of advanced farming techniques.
- Infrastructure: Well-established laboratory networks, advanced logistics, and widespread internet connectivity facilitating data sharing and remote analysis.
- Consumer Demand for Safety: A high level of consumer awareness and demand for safe, high-quality food products, which translates into stringent testing requirements for producers.
- Technological Adoption: A high propensity among North American farmers and agribusinesses to invest in and adopt new technologies, including precision agriculture tools and advanced diagnostic systems.
In terms of specific segments, Production Analysis in North America is characterized by a sophisticated infrastructure of accredited laboratories offering a comprehensive suite of testing services, from routine soil analysis to complex genetic testing for disease resistance in crops. The Import Market Analysis also plays a role, as specialized testing equipment and reagents are often imported to support the advanced domestic testing capabilities. The market share within North America is significant, contributing a substantial portion to the global market revenue. The growth potential in this region remains high, fueled by ongoing advancements in agri-tech and continuous efforts to enhance food security and sustainability.
Agricultural Testing Market Product Landscape
The product landscape of the Agricultural Testing Market is diverse, encompassing a wide array of solutions designed to address various needs within the agricultural value chain. These include laboratory-based analytical services and sophisticated instrumentation for on-site testing. Key product categories include soil testing kits for nutrient analysis, pH, and organic matter content; plant tissue analysis for identifying deficiencies and toxicities; pesticide residue testing solutions employing techniques like GC-MS and LC-MS; GMO detection kits; pathogen and disease diagnostics leveraging PCR and immunoassay technologies; and animal health testing for diseases and genetic profiling. Innovations are continuously enhancing performance metrics such as sensitivity, specificity, speed, and cost-effectiveness. For example, the development of portable spectrometers allows for rapid, in-field assessment of crop health and soil composition, offering unique selling propositions of immediate actionable insights.
Key Drivers, Barriers & Challenges in Agricultural Testing Market
Key Drivers:
- Growing Global Population & Food Demand: The continuous need to increase food production efficiency and safety is a primary market driver.
- Stringent Food Safety Regulations: Government mandates and consumer expectations for safe food products are compelling wider adoption of testing.
- Advancements in Agri-Technology: Innovations in diagnostics, precision agriculture, and data analytics are making testing more accessible and effective.
- Focus on Sustainable Agriculture: The drive towards environmentally friendly farming practices necessitates soil health, water quality, and residue testing.
Barriers & Challenges:
- High Initial Investment Costs: Advanced testing equipment and laboratory infrastructure can be expensive, particularly for smallholder farmers.
- Limited Awareness and Technical Expertise: In some regions, a lack of awareness about the benefits of testing and insufficient technical expertise hinders adoption.
- Regulatory Hurdles and Standardization: Inconsistent or evolving regulatory standards across different regions can create complexities for global market players.
- Supply Chain Disruptions: Potential issues in the availability of reagents, consumables, and skilled personnel can impact service delivery.
- Competitive Pressures: A highly competitive landscape with numerous players can lead to price wars and pressure on profit margins.
Emerging Opportunities in Agricultural Testing Market
Emerging opportunities in the Agricultural Testing Market are largely centered around precision agriculture, biotechnology, and the increasing demand for sustainably produced food. The integration of IoT devices and AI into farming operations presents a significant opportunity for real-time, data-driven testing solutions for crop monitoring, soil health, and irrigation management. The growing consumer preference for organic, non-GMO, and allergen-free products is driving demand for specialized testing services that can certify these attributes. Furthermore, advancements in genomic testing for livestock and crops offer potential for disease resistance, improved yield, and enhanced breeding programs, opening up new service niches. The expansion of agricultural testing into emerging economies, where farming practices are modernizing, also represents a substantial untapped market.
Growth Accelerators in the Agricultural Testing Market Industry
Several factors are accelerating the growth of the Agricultural Testing Market. Technological breakthroughs in areas such as rapid molecular diagnostics, spectroscopic analysis, and digital imaging are making testing more efficient, accurate, and cost-effective. Strategic partnerships between technology providers, testing laboratories, and agricultural enterprises are crucial for developing integrated solutions and expanding market reach. For instance, collaborations that combine on-farm sensor data with laboratory analysis provide a more comprehensive understanding of crop and soil conditions. Market expansion strategies, including the development of localized testing services and affordable testing packages tailored to the needs of smallholder farmers, are also key growth accelerators. The increasing emphasis on traceability and transparency in the food supply chain further boosts the demand for reliable testing and certification services.
Key Players Shaping the Agricultural Testing Market Market
- 3M Company
- Biolumix Inc
- Intertek Group PLC
- Agilent Technologies Inc
- BioMerieux SA
- Aurea Agrosciences
- SCS Global Services
- Apal Agricultural Laboratory
- ALS Limited
- Eurofins Scientific
- EMD Millipore Corporation
- Bureau Veritas SA
- Element Materials Technology
- TUV Nord Group
- Charm Sciences Inc
- Neogen Corporation
Notable Milestones in Agricultural Testing Market Sector
- February 2023: Hill laboratories company signed a joint partnership agreement with Merieux Nutrisciences. The Hill Laboratories team will work with the Mérieux NutriSciences team of experts to provide comprehensive solutions for New Zealand food businesses, encompassing food safety testing and auditing services.
- November 2022: SCS Global Services company launched a new plant-based certification program. This program has an ANSI-accredited standards development body, distinguishing plant-based brands based on rigorous auditing, testing, and labeling requirements.
- August 2022: Hill laboratories innovated a new soil test method (Hot Water Carbon (HWEC) test) using near infra-red spectroscopy (NIRS) for testing agronomic soil samples (excluding peats). The use of NIRS for soil tests allows quick and affordable results.
In-Depth Agricultural Testing Market Market Outlook
The Agricultural Testing Market is poised for sustained and robust growth, fueled by an indispensable role in ensuring global food security, quality, and sustainability. Future market potential is immense, driven by the relentless need to optimize agricultural output while minimizing environmental impact. Strategic opportunities lie in the further integration of digital technologies, such as AI and blockchain, to enhance traceability and data integrity in agricultural testing. The development of more advanced, user-friendly, and cost-effective diagnostic tools for on-farm use will be critical for expanding market reach to a broader base of farmers. Collaborations that bridge the gap between technological innovation and practical agricultural application will be paramount in unlocking new revenue streams and addressing the evolving challenges of modern agriculture.
Agricultural Testing Market Segmentation
- 1. Production Analysis
- 2. Consumption Analysis
- 3. Import Market Analysis (Value & Volume)
- 4. Export Market Analysis (Value & Volume)
- 5. Price Trend Analysis
Agricultural Testing Market Segmentation By Geography
-
1. North America
- 1.1. United States
- 1.2. Canada
- 1.3. Mexico
-
2. South America
- 2.1. Brazil
- 2.2. Argentina
- 2.3. Rest of South America
-
3. Europe
- 3.1. United Kingdom
- 3.2. Germany
- 3.3. France
- 3.4. Italy
- 3.5. Spain
- 3.6. Russia
- 3.7. Benelux
- 3.8. Nordics
- 3.9. Rest of Europe
-
4. Middle East & Africa
- 4.1. Turkey
- 4.2. Israel
- 4.3. GCC
- 4.4. North Africa
- 4.5. South Africa
- 4.6. Rest of Middle East & Africa
-
5. Asia Pacific
- 5.1. China
- 5.2. India
- 5.3. Japan
- 5.4. South Korea
- 5.5. ASEAN
- 5.6. Oceania
- 5.7. Rest of Asia Pacific
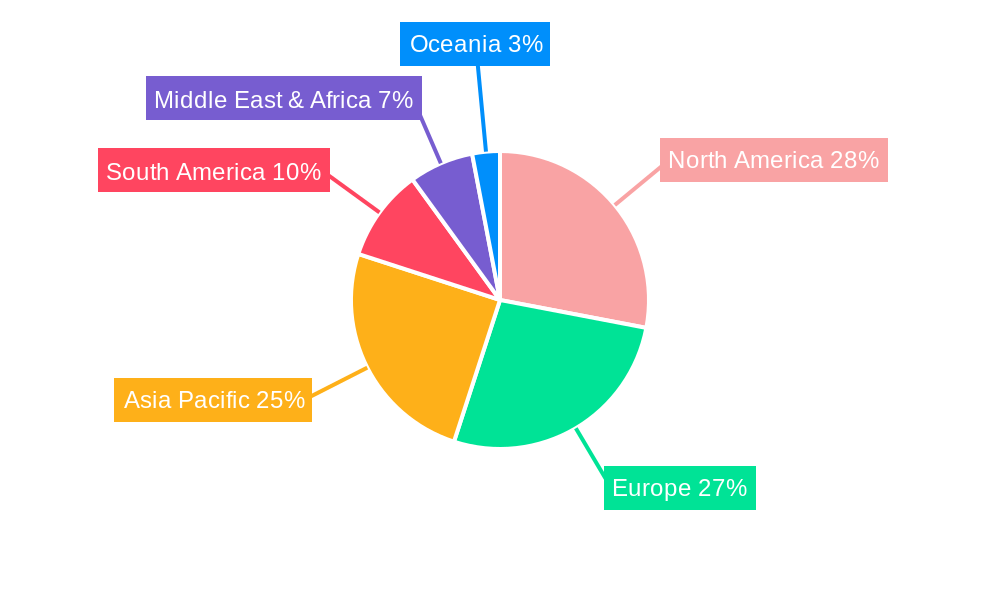
Agricultural Testing Market Regional Market Share
Geographic Coverage of Agricultural Testing Market
Agricultural Testing Market REPORT HIGHLIGHTS
| Aspects | Details |
|---|---|
| Study Period | 2020-2034 |
| Base Year | 2025 |
| Estimated Year | 2026 |
| Forecast Period | 2026-2034 |
| Historical Period | 2020-2025 |
| Growth Rate | CAGR of 5.70% from 2020-2034 |
| Segmentation |
|
Table of Contents
- 1. Introduction
- 1.1. Research Scope
- 1.2. Market Segmentation
- 1.3. Research Objective
- 1.4. Definitions and Assumptions
- 2. Executive Summary
- 2.1. Market Snapshot
- 3. Market Dynamics
- 3.1. Market Drivers
- 3.2. Market Restrains
- 3.3. Market Trends
- 3.4. Market Opportunities
- 4. Market Factor Analysis
- 4.1. Porters Five Forces
- 4.1.1. Bargaining Power of Suppliers
- 4.1.2. Bargaining Power of Buyers
- 4.1.3. Threat of New Entrants
- 4.1.4. Threat of Substitutes
- 4.1.5. Competitive Rivalry
- 4.2. PESTEL analysis
- 4.3. BCG Analysis
- 4.3.1. Stars (High Growth, High Market Share)
- 4.3.2. Cash Cows (Low Growth, High Market Share)
- 4.3.3. Question Mark (High Growth, Low Market Share)
- 4.3.4. Dogs (Low Growth, Low Market Share)
- 4.4. Ansoff Matrix Analysis
- 4.5. Supply Chain Analysis
- 4.6. Regulatory Landscape
- 4.7. Current Market Potential and Opportunity Assessment (TAM–SAM–SOM Framework)
- 4.8. NRP Analyst Note
- 4.1. Porters Five Forces
- 5. Market Analysis, Insights and Forecast 2021-2033
- 5.1. Market Analysis, Insights and Forecast - by Production Analysis
- 5.2. Market Analysis, Insights and Forecast - by Consumption Analysis
- 5.3. Market Analysis, Insights and Forecast - by Import Market Analysis (Value & Volume)
- 5.4. Market Analysis, Insights and Forecast - by Export Market Analysis (Value & Volume)
- 5.5. Market Analysis, Insights and Forecast - by Price Trend Analysis
- 5.6. Market Analysis, Insights and Forecast - by Region
- 5.6.1. North America
- 5.6.2. South America
- 5.6.3. Europe
- 5.6.4. Middle East & Africa
- 5.6.5. Asia Pacific
- 6. Global Agricultural Testing Market Analysis, Insights and Forecast, 2021-2033
- 6.1. Market Analysis, Insights and Forecast - by Production Analysis
- 6.2. Market Analysis, Insights and Forecast - by Consumption Analysis
- 6.3. Market Analysis, Insights and Forecast - by Import Market Analysis (Value & Volume)
- 6.4. Market Analysis, Insights and Forecast - by Export Market Analysis (Value & Volume)
- 6.5. Market Analysis, Insights and Forecast - by Price Trend Analysis
- 7. North America Agricultural Testing Market Analysis, Insights and Forecast, 2020-2032
- 7.1. Market Analysis, Insights and Forecast - by Production Analysis
- 7.2. Market Analysis, Insights and Forecast - by Consumption Analysis
- 7.3. Market Analysis, Insights and Forecast - by Import Market Analysis (Value & Volume)
- 7.4. Market Analysis, Insights and Forecast - by Export Market Analysis (Value & Volume)
- 7.5. Market Analysis, Insights and Forecast - by Price Trend Analysis
- 8. South America Agricultural Testing Market Analysis, Insights and Forecast, 2020-2032
- 8.1. Market Analysis, Insights and Forecast - by Production Analysis
- 8.2. Market Analysis, Insights and Forecast - by Consumption Analysis
- 8.3. Market Analysis, Insights and Forecast - by Import Market Analysis (Value & Volume)
- 8.4. Market Analysis, Insights and Forecast - by Export Market Analysis (Value & Volume)
- 8.5. Market Analysis, Insights and Forecast - by Price Trend Analysis
- 9. Europe Agricultural Testing Market Analysis, Insights and Forecast, 2020-2032
- 9.1. Market Analysis, Insights and Forecast - by Production Analysis
- 9.2. Market Analysis, Insights and Forecast - by Consumption Analysis
- 9.3. Market Analysis, Insights and Forecast - by Import Market Analysis (Value & Volume)
- 9.4. Market Analysis, Insights and Forecast - by Export Market Analysis (Value & Volume)
- 9.5. Market Analysis, Insights and Forecast - by Price Trend Analysis
- 10. Middle East & Africa Agricultural Testing Market Analysis, Insights and Forecast, 2020-2032
- 10.1. Market Analysis, Insights and Forecast - by Production Analysis
- 10.2. Market Analysis, Insights and Forecast - by Consumption Analysis
- 10.3. Market Analysis, Insights and Forecast - by Import Market Analysis (Value & Volume)
- 10.4. Market Analysis, Insights and Forecast - by Export Market Analysis (Value & Volume)
- 10.5. Market Analysis, Insights and Forecast - by Price Trend Analysis
- 11. Asia Pacific Agricultural Testing Market Analysis, Insights and Forecast, 2020-2032
- 11.1. Market Analysis, Insights and Forecast - by Production Analysis
- 11.2. Market Analysis, Insights and Forecast - by Consumption Analysis
- 11.3. Market Analysis, Insights and Forecast - by Import Market Analysis (Value & Volume)
- 11.4. Market Analysis, Insights and Forecast - by Export Market Analysis (Value & Volume)
- 11.5. Market Analysis, Insights and Forecast - by Price Trend Analysis
- 12. Competitive Analysis
- 12.1. Company Profiles
- 12.1.1 3M Company
- 12.1.1.1. Company Overview
- 12.1.1.2. Products
- 12.1.1.3. Company Financials
- 12.1.1.4. SWOT Analysis
- 12.1.2 Biolumix Inc
- 12.1.2.1. Company Overview
- 12.1.2.2. Products
- 12.1.2.3. Company Financials
- 12.1.2.4. SWOT Analysis
- 12.1.3 Intertek Group PLC
- 12.1.3.1. Company Overview
- 12.1.3.2. Products
- 12.1.3.3. Company Financials
- 12.1.3.4. SWOT Analysis
- 12.1.4 Agilent Technologies Inc
- 12.1.4.1. Company Overview
- 12.1.4.2. Products
- 12.1.4.3. Company Financials
- 12.1.4.4. SWOT Analysis
- 12.1.5 BioMerieux SA
- 12.1.5.1. Company Overview
- 12.1.5.2. Products
- 12.1.5.3. Company Financials
- 12.1.5.4. SWOT Analysis
- 12.1.6 Aurea Agrosciences
- 12.1.6.1. Company Overview
- 12.1.6.2. Products
- 12.1.6.3. Company Financials
- 12.1.6.4. SWOT Analysis
- 12.1.7 SCS Global Services
- 12.1.7.1. Company Overview
- 12.1.7.2. Products
- 12.1.7.3. Company Financials
- 12.1.7.4. SWOT Analysis
- 12.1.8 Apal Agricultural Laboratory
- 12.1.8.1. Company Overview
- 12.1.8.2. Products
- 12.1.8.3. Company Financials
- 12.1.8.4. SWOT Analysis
- 12.1.9 ALS Limited
- 12.1.9.1. Company Overview
- 12.1.9.2. Products
- 12.1.9.3. Company Financials
- 12.1.9.4. SWOT Analysis
- 12.1.10 Eurofins Scientific
- 12.1.10.1. Company Overview
- 12.1.10.2. Products
- 12.1.10.3. Company Financials
- 12.1.10.4. SWOT Analysis
- 12.1.11 EMD Millipore Corporation
- 12.1.11.1. Company Overview
- 12.1.11.2. Products
- 12.1.11.3. Company Financials
- 12.1.11.4. SWOT Analysis
- 12.1.12 Bureau Veritas SA
- 12.1.12.1. Company Overview
- 12.1.12.2. Products
- 12.1.12.3. Company Financials
- 12.1.12.4. SWOT Analysis
- 12.1.13 Element Materials Technology
- 12.1.13.1. Company Overview
- 12.1.13.2. Products
- 12.1.13.3. Company Financials
- 12.1.13.4. SWOT Analysis
- 12.1.14 TUV Nord Group
- 12.1.14.1. Company Overview
- 12.1.14.2. Products
- 12.1.14.3. Company Financials
- 12.1.14.4. SWOT Analysis
- 12.1.15 Charm Sciences Inc
- 12.1.15.1. Company Overview
- 12.1.15.2. Products
- 12.1.15.3. Company Financials
- 12.1.15.4. SWOT Analysis
- 12.1.16 Neogen Corporation
- 12.1.16.1. Company Overview
- 12.1.16.2. Products
- 12.1.16.3. Company Financials
- 12.1.16.4. SWOT Analysis
- 12.1.1 3M Company
- 12.2. Market Entropy
- 12.2.1 Company's Key Areas Served
- 12.2.2 Recent Developments
- 12.3. Company Market Share Analysis 2025
- 12.3.1 Top 5 Companies Market Share Analysis
- 12.3.2 Top 3 Companies Market Share Analysis
- 12.4. List of Potential Customers
- 13. Research Methodology
List of Figures
- Figure 1: Global Agricultural Testing Market Revenue Breakdown (Million, %) by Region 2025 & 2033
- Figure 2: North America Agricultural Testing Market Revenue (Million), by Production Analysis 2025 & 2033
- Figure 3: North America Agricultural Testing Market Revenue Share (%), by Production Analysis 2025 & 2033
- Figure 4: North America Agricultural Testing Market Revenue (Million), by Consumption Analysis 2025 & 2033
- Figure 5: North America Agricultural Testing Market Revenue Share (%), by Consumption Analysis 2025 & 2033
- Figure 6: North America Agricultural Testing Market Revenue (Million), by Import Market Analysis (Value & Volume) 2025 & 2033
- Figure 7: North America Agricultural Testing Market Revenue Share (%), by Import Market Analysis (Value & Volume) 2025 & 2033
- Figure 8: North America Agricultural Testing Market Revenue (Million), by Export Market Analysis (Value & Volume) 2025 & 2033
- Figure 9: North America Agricultural Testing Market Revenue Share (%), by Export Market Analysis (Value & Volume) 2025 & 2033
- Figure 10: North America Agricultural Testing Market Revenue (Million), by Price Trend Analysis 2025 & 2033
- Figure 11: North America Agricultural Testing Market Revenue Share (%), by Price Trend Analysis 2025 & 2033
- Figure 12: North America Agricultural Testing Market Revenue (Million), by Country 2025 & 2033
- Figure 13: North America Agricultural Testing Market Revenue Share (%), by Country 2025 & 2033
- Figure 14: South America Agricultural Testing Market Revenue (Million), by Production Analysis 2025 & 2033
- Figure 15: South America Agricultural Testing Market Revenue Share (%), by Production Analysis 2025 & 2033
- Figure 16: South America Agricultural Testing Market Revenue (Million), by Consumption Analysis 2025 & 2033
- Figure 17: South America Agricultural Testing Market Revenue Share (%), by Consumption Analysis 2025 & 2033
- Figure 18: South America Agricultural Testing Market Revenue (Million), by Import Market Analysis (Value & Volume) 2025 & 2033
- Figure 19: South America Agricultural Testing Market Revenue Share (%), by Import Market Analysis (Value & Volume) 2025 & 2033
- Figure 20: South America Agricultural Testing Market Revenue (Million), by Export Market Analysis (Value & Volume) 2025 & 2033
- Figure 21: South America Agricultural Testing Market Revenue Share (%), by Export Market Analysis (Value & Volume) 2025 & 2033
- Figure 22: South America Agricultural Testing Market Revenue (Million), by Price Trend Analysis 2025 & 2033
- Figure 23: South America Agricultural Testing Market Revenue Share (%), by Price Trend Analysis 2025 & 2033
- Figure 24: South America Agricultural Testing Market Revenue (Million), by Country 2025 & 2033
- Figure 25: South America Agricultural Testing Market Revenue Share (%), by Country 2025 & 2033
- Figure 26: Europe Agricultural Testing Market Revenue (Million), by Production Analysis 2025 & 2033
- Figure 27: Europe Agricultural Testing Market Revenue Share (%), by Production Analysis 2025 & 2033
- Figure 28: Europe Agricultural Testing Market Revenue (Million), by Consumption Analysis 2025 & 2033
- Figure 29: Europe Agricultural Testing Market Revenue Share (%), by Consumption Analysis 2025 & 2033
- Figure 30: Europe Agricultural Testing Market Revenue (Million), by Import Market Analysis (Value & Volume) 2025 & 2033
- Figure 31: Europe Agricultural Testing Market Revenue Share (%), by Import Market Analysis (Value & Volume) 2025 & 2033
- Figure 32: Europe Agricultural Testing Market Revenue (Million), by Export Market Analysis (Value & Volume) 2025 & 2033
- Figure 33: Europe Agricultural Testing Market Revenue Share (%), by Export Market Analysis (Value & Volume) 2025 & 2033
- Figure 34: Europe Agricultural Testing Market Revenue (Million), by Price Trend Analysis 2025 & 2033
- Figure 35: Europe Agricultural Testing Market Revenue Share (%), by Price Trend Analysis 2025 & 2033
- Figure 36: Europe Agricultural Testing Market Revenue (Million), by Country 2025 & 2033
- Figure 37: Europe Agricultural Testing Market Revenue Share (%), by Country 2025 & 2033
- Figure 38: Middle East & Africa Agricultural Testing Market Revenue (Million), by Production Analysis 2025 & 2033
- Figure 39: Middle East & Africa Agricultural Testing Market Revenue Share (%), by Production Analysis 2025 & 2033
- Figure 40: Middle East & Africa Agricultural Testing Market Revenue (Million), by Consumption Analysis 2025 & 2033
- Figure 41: Middle East & Africa Agricultural Testing Market Revenue Share (%), by Consumption Analysis 2025 & 2033
- Figure 42: Middle East & Africa Agricultural Testing Market Revenue (Million), by Import Market Analysis (Value & Volume) 2025 & 2033
- Figure 43: Middle East & Africa Agricultural Testing Market Revenue Share (%), by Import Market Analysis (Value & Volume) 2025 & 2033
- Figure 44: Middle East & Africa Agricultural Testing Market Revenue (Million), by Export Market Analysis (Value & Volume) 2025 & 2033
- Figure 45: Middle East & Africa Agricultural Testing Market Revenue Share (%), by Export Market Analysis (Value & Volume) 2025 & 2033
- Figure 46: Middle East & Africa Agricultural Testing Market Revenue (Million), by Price Trend Analysis 2025 & 2033
- Figure 47: Middle East & Africa Agricultural Testing Market Revenue Share (%), by Price Trend Analysis 2025 & 2033
- Figure 48: Middle East & Africa Agricultural Testing Market Revenue (Million), by Country 2025 & 2033
- Figure 49: Middle East & Africa Agricultural Testing Market Revenue Share (%), by Country 2025 & 2033
- Figure 50: Asia Pacific Agricultural Testing Market Revenue (Million), by Production Analysis 2025 & 2033
- Figure 51: Asia Pacific Agricultural Testing Market Revenue Share (%), by Production Analysis 2025 & 2033
- Figure 52: Asia Pacific Agricultural Testing Market Revenue (Million), by Consumption Analysis 2025 & 2033
- Figure 53: Asia Pacific Agricultural Testing Market Revenue Share (%), by Consumption Analysis 2025 & 2033
- Figure 54: Asia Pacific Agricultural Testing Market Revenue (Million), by Import Market Analysis (Value & Volume) 2025 & 2033
- Figure 55: Asia Pacific Agricultural Testing Market Revenue Share (%), by Import Market Analysis (Value & Volume) 2025 & 2033
- Figure 56: Asia Pacific Agricultural Testing Market Revenue (Million), by Export Market Analysis (Value & Volume) 2025 & 2033
- Figure 57: Asia Pacific Agricultural Testing Market Revenue Share (%), by Export Market Analysis (Value & Volume) 2025 & 2033
- Figure 58: Asia Pacific Agricultural Testing Market Revenue (Million), by Price Trend Analysis 2025 & 2033
- Figure 59: Asia Pacific Agricultural Testing Market Revenue Share (%), by Price Trend Analysis 2025 & 2033
- Figure 60: Asia Pacific Agricultural Testing Market Revenue (Million), by Country 2025 & 2033
- Figure 61: Asia Pacific Agricultural Testing Market Revenue Share (%), by Country 2025 & 2033
List of Tables
- Table 1: Global Agricultural Testing Market Revenue Million Forecast, by Production Analysis 2020 & 2033
- Table 2: Global Agricultural Testing Market Revenue Million Forecast, by Consumption Analysis 2020 & 2033
- Table 3: Global Agricultural Testing Market Revenue Million Forecast, by Import Market Analysis (Value & Volume) 2020 & 2033
- Table 4: Global Agricultural Testing Market Revenue Million Forecast, by Export Market Analysis (Value & Volume) 2020 & 2033
- Table 5: Global Agricultural Testing Market Revenue Million Forecast, by Price Trend Analysis 2020 & 2033
- Table 6: Global Agricultural Testing Market Revenue Million Forecast, by Region 2020 & 2033
- Table 7: Global Agricultural Testing Market Revenue Million Forecast, by Production Analysis 2020 & 2033
- Table 8: Global Agricultural Testing Market Revenue Million Forecast, by Consumption Analysis 2020 & 2033
- Table 9: Global Agricultural Testing Market Revenue Million Forecast, by Import Market Analysis (Value & Volume) 2020 & 2033
- Table 10: Global Agricultural Testing Market Revenue Million Forecast, by Export Market Analysis (Value & Volume) 2020 & 2033
- Table 11: Global Agricultural Testing Market Revenue Million Forecast, by Price Trend Analysis 2020 & 2033
- Table 12: Global Agricultural Testing Market Revenue Million Forecast, by Country 2020 & 2033
- Table 13: United States Agricultural Testing Market Revenue (Million) Forecast, by Application 2020 & 2033
- Table 14: Canada Agricultural Testing Market Revenue (Million) Forecast, by Application 2020 & 2033
- Table 15: Mexico Agricultural Testing Market Revenue (Million) Forecast, by Application 2020 & 2033
- Table 16: Global Agricultural Testing Market Revenue Million Forecast, by Production Analysis 2020 & 2033
- Table 17: Global Agricultural Testing Market Revenue Million Forecast, by Consumption Analysis 2020 & 2033
- Table 18: Global Agricultural Testing Market Revenue Million Forecast, by Import Market Analysis (Value & Volume) 2020 & 2033
- Table 19: Global Agricultural Testing Market Revenue Million Forecast, by Export Market Analysis (Value & Volume) 2020 & 2033
- Table 20: Global Agricultural Testing Market Revenue Million Forecast, by Price Trend Analysis 2020 & 2033
- Table 21: Global Agricultural Testing Market Revenue Million Forecast, by Country 2020 & 2033
- Table 22: Brazil Agricultural Testing Market Revenue (Million) Forecast, by Application 2020 & 2033
- Table 23: Argentina Agricultural Testing Market Revenue (Million) Forecast, by Application 2020 & 2033
- Table 24: Rest of South America Agricultural Testing Market Revenue (Million) Forecast, by Application 2020 & 2033
- Table 25: Global Agricultural Testing Market Revenue Million Forecast, by Production Analysis 2020 & 2033
- Table 26: Global Agricultural Testing Market Revenue Million Forecast, by Consumption Analysis 2020 & 2033
- Table 27: Global Agricultural Testing Market Revenue Million Forecast, by Import Market Analysis (Value & Volume) 2020 & 2033
- Table 28: Global Agricultural Testing Market Revenue Million Forecast, by Export Market Analysis (Value & Volume) 2020 & 2033
- Table 29: Global Agricultural Testing Market Revenue Million Forecast, by Price Trend Analysis 2020 & 2033
- Table 30: Global Agricultural Testing Market Revenue Million Forecast, by Country 2020 & 2033
- Table 31: United Kingdom Agricultural Testing Market Revenue (Million) Forecast, by Application 2020 & 2033
- Table 32: Germany Agricultural Testing Market Revenue (Million) Forecast, by Application 2020 & 2033
- Table 33: France Agricultural Testing Market Revenue (Million) Forecast, by Application 2020 & 2033
- Table 34: Italy Agricultural Testing Market Revenue (Million) Forecast, by Application 2020 & 2033
- Table 35: Spain Agricultural Testing Market Revenue (Million) Forecast, by Application 2020 & 2033
- Table 36: Russia Agricultural Testing Market Revenue (Million) Forecast, by Application 2020 & 2033
- Table 37: Benelux Agricultural Testing Market Revenue (Million) Forecast, by Application 2020 & 2033
- Table 38: Nordics Agricultural Testing Market Revenue (Million) Forecast, by Application 2020 & 2033
- Table 39: Rest of Europe Agricultural Testing Market Revenue (Million) Forecast, by Application 2020 & 2033
- Table 40: Global Agricultural Testing Market Revenue Million Forecast, by Production Analysis 2020 & 2033
- Table 41: Global Agricultural Testing Market Revenue Million Forecast, by Consumption Analysis 2020 & 2033
- Table 42: Global Agricultural Testing Market Revenue Million Forecast, by Import Market Analysis (Value & Volume) 2020 & 2033
- Table 43: Global Agricultural Testing Market Revenue Million Forecast, by Export Market Analysis (Value & Volume) 2020 & 2033
- Table 44: Global Agricultural Testing Market Revenue Million Forecast, by Price Trend Analysis 2020 & 2033
- Table 45: Global Agricultural Testing Market Revenue Million Forecast, by Country 2020 & 2033
- Table 46: Turkey Agricultural Testing Market Revenue (Million) Forecast, by Application 2020 & 2033
- Table 47: Israel Agricultural Testing Market Revenue (Million) Forecast, by Application 2020 & 2033
- Table 48: GCC Agricultural Testing Market Revenue (Million) Forecast, by Application 2020 & 2033
- Table 49: North Africa Agricultural Testing Market Revenue (Million) Forecast, by Application 2020 & 2033
- Table 50: South Africa Agricultural Testing Market Revenue (Million) Forecast, by Application 2020 & 2033
- Table 51: Rest of Middle East & Africa Agricultural Testing Market Revenue (Million) Forecast, by Application 2020 & 2033
- Table 52: Global Agricultural Testing Market Revenue Million Forecast, by Production Analysis 2020 & 2033
- Table 53: Global Agricultural Testing Market Revenue Million Forecast, by Consumption Analysis 2020 & 2033
- Table 54: Global Agricultural Testing Market Revenue Million Forecast, by Import Market Analysis (Value & Volume) 2020 & 2033
- Table 55: Global Agricultural Testing Market Revenue Million Forecast, by Export Market Analysis (Value & Volume) 2020 & 2033
- Table 56: Global Agricultural Testing Market Revenue Million Forecast, by Price Trend Analysis 2020 & 2033
- Table 57: Global Agricultural Testing Market Revenue Million Forecast, by Country 2020 & 2033
- Table 58: China Agricultural Testing Market Revenue (Million) Forecast, by Application 2020 & 2033
- Table 59: India Agricultural Testing Market Revenue (Million) Forecast, by Application 2020 & 2033
- Table 60: Japan Agricultural Testing Market Revenue (Million) Forecast, by Application 2020 & 2033
- Table 61: South Korea Agricultural Testing Market Revenue (Million) Forecast, by Application 2020 & 2033
- Table 62: ASEAN Agricultural Testing Market Revenue (Million) Forecast, by Application 2020 & 2033
- Table 63: Oceania Agricultural Testing Market Revenue (Million) Forecast, by Application 2020 & 2033
- Table 64: Rest of Asia Pacific Agricultural Testing Market Revenue (Million) Forecast, by Application 2020 & 2033
Frequently Asked Questions
1. What is the projected Compound Annual Growth Rate (CAGR) of the Agricultural Testing Market?
The projected CAGR is approximately 5.70%.
2. Which companies are prominent players in the Agricultural Testing Market?
Key companies in the market include 3M Company, Biolumix Inc, Intertek Group PLC, Agilent Technologies Inc, BioMerieux SA, Aurea Agrosciences, SCS Global Services, Apal Agricultural Laboratory, ALS Limited, Eurofins Scientific, EMD Millipore Corporation, Bureau Veritas SA, Element Materials Technology, TUV Nord Group, Charm Sciences Inc, Neogen Corporation.
3. What are the main segments of the Agricultural Testing Market?
The market segments include Production Analysis, Consumption Analysis, Import Market Analysis (Value & Volume), Export Market Analysis (Value & Volume), Price Trend Analysis.
4. Can you provide details about the market size?
The market size is estimated to be USD XX Million as of 2022.
5. What are some drivers contributing to market growth?
Need for Custom Product Development; Use of CROs for Regulatory Services.
6. What are the notable trends driving market growth?
Regulations and Legislations Pertaining to Agriculture and Environmental Safety.
7. Are there any restraints impacting market growth?
Data and Cyber Security Concerns; Lack of Experts and Professionals in this Industry.
8. Can you provide examples of recent developments in the market?
February 2023: Hill laboratories company signed a joint partnership agreement with Merieux Nutrisciences. The Hill Laboratories team will work with the Mérieux NutriSciences team of experts to provide comprehensive solutions for New Zealand food businesses, encompassing food safety testing and auditing services.
9. What pricing options are available for accessing the report?
Pricing options include single-user, multi-user, and enterprise licenses priced at USD 4750, USD 5250, and USD 8750 respectively.
10. Is the market size provided in terms of value or volume?
The market size is provided in terms of value, measured in Million.
11. Are there any specific market keywords associated with the report?
Yes, the market keyword associated with the report is "Agricultural Testing Market," which aids in identifying and referencing the specific market segment covered.
12. How do I determine which pricing option suits my needs best?
The pricing options vary based on user requirements and access needs. Individual users may opt for single-user licenses, while businesses requiring broader access may choose multi-user or enterprise licenses for cost-effective access to the report.
13. Are there any additional resources or data provided in the Agricultural Testing Market report?
While the report offers comprehensive insights, it's advisable to review the specific contents or supplementary materials provided to ascertain if additional resources or data are available.
14. How can I stay updated on further developments or reports in the Agricultural Testing Market?
To stay informed about further developments, trends, and reports in the Agricultural Testing Market, consider subscribing to industry newsletters, following relevant companies and organizations, or regularly checking reputable industry news sources and publications.
Methodology
Step 1 - Identification of Relevant Samples Size from Population Database


Step 2 - Approaches for Defining Global Market Size (Value, Volume* & Price*)

Note*: In applicable scenarios
Step 3 - Data Sources
Primary Research
- Web Analytics
- Survey Reports
- Research Institute
- Latest Research Reports
- Opinion Leaders
Secondary Research
- Annual Reports
- White Paper
- Latest Press Release
- Industry Association
- Paid Database
- Investor Presentations

Step 4 - Data Triangulation
Involves using different sources of information in order to increase the validity of a study
These sources are likely to be stakeholders in a program - participants, other researchers, program staff, other community members, and so on.
Then we put all data in single framework & apply various statistical tools to find out the dynamic on the market.
During the analysis stage, feedback from the stakeholder groups would be compared to determine areas of agreement as well as areas of divergence