

Key Insights
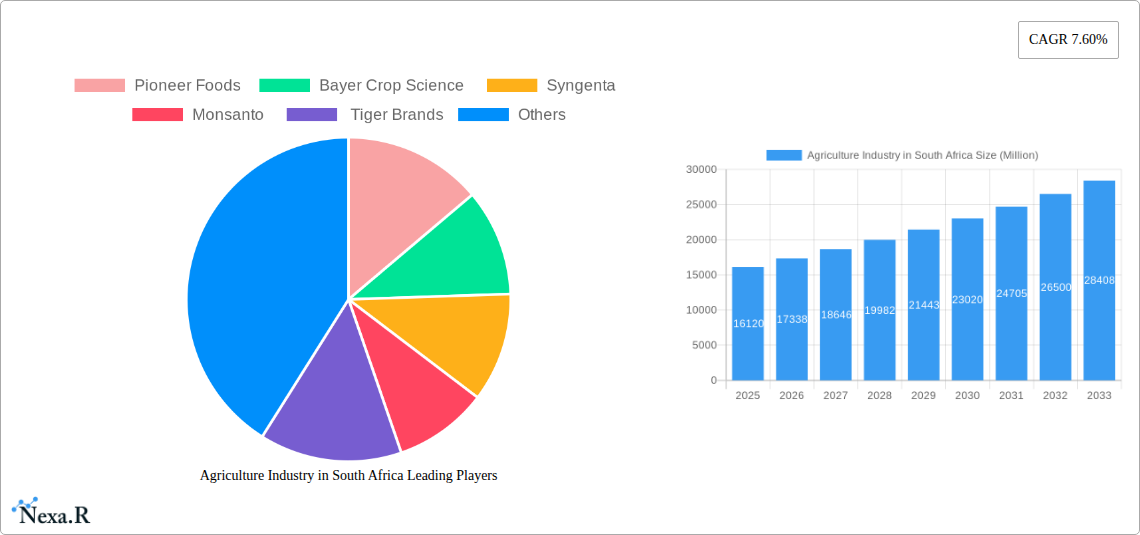
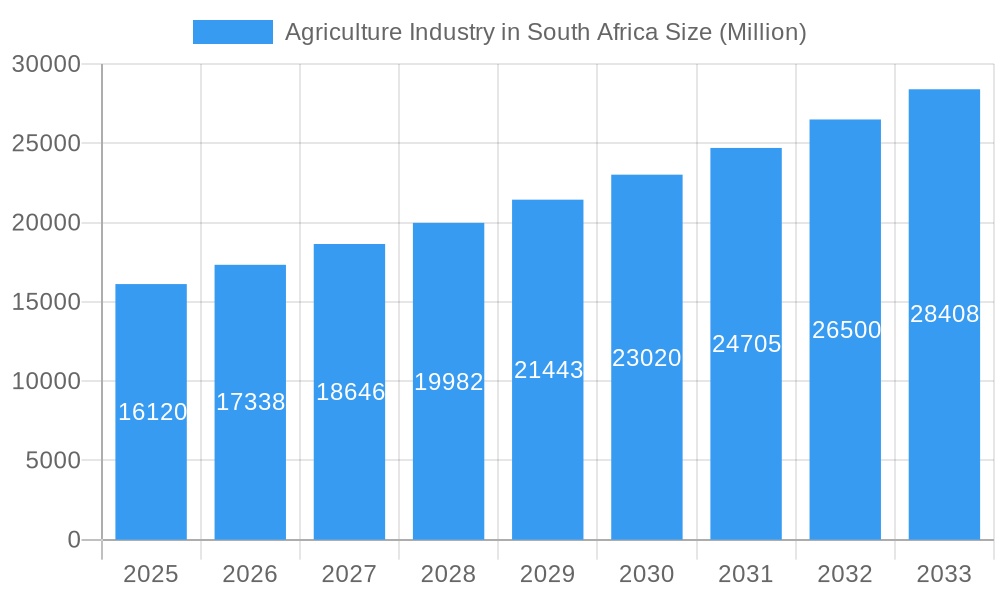
The South African agricultural industry, valued at approximately $16.12 billion in 2025, is projected to experience robust growth, exhibiting a Compound Annual Growth Rate (CAGR) of 7.60% from 2025 to 2033. This expansion is driven by several key factors. Increased demand for food and agricultural products, both domestically and for export, fuels this growth. Government initiatives promoting sustainable agricultural practices and investments in irrigation and technology are also contributing significantly. Furthermore, the diversification of crops, including a focus on high-value fruits and vegetables for export markets, enhances the sector's resilience and profitability. However, challenges persist, including water scarcity, climate change impacts such as erratic rainfall and droughts, and the high cost of inputs like fertilizers and pesticides. These constraints require strategic mitigation strategies involving advanced water management techniques, climate-resilient crop varieties, and efficient resource utilization. The segment encompassing cereals, fruits, vegetables, and oilseeds shows strong potential, with cereals likely dominating market share due to their staple nature in the South African diet. Competition among key players like Pioneer Foods, Bayer Crop Science, Syngenta, Monsanto, and Tiger Brands further shapes market dynamics, leading to innovation and efficiency improvements across the value chain.
Agriculture Industry in South Africa Market Size (In Billion)
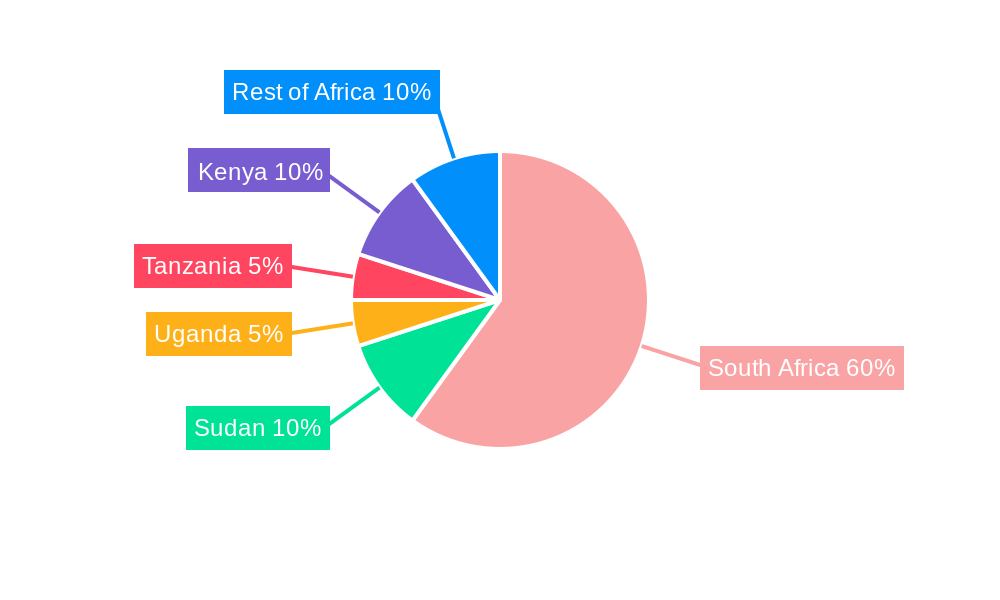
The forecast period (2025-2033) anticipates continuous growth, though the rate may fluctuate due to external factors like global economic conditions and international trade policies. The focus on sustainable practices, technological advancements in precision agriculture, and value chain optimization will determine the long-term success of the industry. Strategic investments in research and development, coupled with effective risk management strategies to mitigate climate change effects and input cost volatility, are crucial for sustained growth and profitability within the South African agricultural landscape. The regional focus on countries like South Africa, Sudan, Uganda, Tanzania, and Kenya within Africa highlights the importance of addressing regional disparities and promoting equitable access to resources and technologies for optimal sector-wide development.
Agriculture Industry in South Africa Company Market Share
Agriculture Industry in South Africa: A Comprehensive Market Report (2019-2033)
This comprehensive report provides a detailed analysis of the South African agriculture industry, encompassing market dynamics, growth trends, dominant segments, and key players. With a study period spanning 2019-2033, a base year of 2025, and a forecast period of 2025-2033, this report offers invaluable insights for industry professionals, investors, and stakeholders. The report uses Million units (ZAR) as the measurement for all monetary values.
Agriculture Industry in South Africa Market Dynamics & Structure
The South African agricultural sector is characterized by a dynamic interplay between a few large, established agribusinesses and a vast network of smaller, often specialized farms. While technological adoption is on an upward trajectory, its widespread implementation is often hampered by challenges such as limited access to affordable finance and uneven distribution of digital infrastructure across the country's diverse regions. A robust regulatory environment, encompassing crucial aspects like land reform initiatives and stringent environmental protection laws, plays a pivotal role in shaping market operations and strategic decisions. Furthermore, the availability of competitive product substitutes for certain agricultural outputs directly influences pricing strategies and market share dynamics. The diverse end-user base, spanning from large-scale commercial enterprises to emerging smallholder farmers, creates multifaceted demand patterns that require tailored approaches. Mergers and acquisitions (M&A) activity has been a consistent feature in recent years, predominantly focused on consolidating market presence within specific agricultural sub-sectors.
- Market Concentration: Highly concentrated (e.g., >80%) in Cereals and Oilseeds, reflecting economies of scale; Moderately concentrated (e.g., 40-60%) in Fruits and Vegetables, allowing for greater diversity and specialization.
- M&A Deal Volume (2019-2024): Approximately [Insert Number] deals, with an estimated total value of [Insert Value] Million ZAR, indicating strategic consolidation and expansion.
- Technological Innovation Drivers: Advancements in precision agriculture for optimized resource management, cutting-edge biotechnology for improved crop yields and resilience, and the implementation of sophisticated irrigation techniques to combat water scarcity.
- Innovation Barriers: Significant capital expenditure required for advanced technologies, persistent skills shortages in specialized agricultural fields, and the challenging task of extending technological access to remote rural communities.
- Regulatory Framework: A comprehensive framework including land redistribution policies, water use rights management, evolving environmental sustainability regulations, and strict phytosanitary standards for both domestic and international trade.
Agriculture Industry in South Africa Growth Trends & Insights
The South African agriculture industry has demonstrated steady growth over the historical period (2019-2024), driven by increasing domestic demand and exports. The market size expanded from xx Million ZAR in 2019 to xx Million ZAR in 2024, exhibiting a CAGR of xx%. Technological disruptions, particularly in precision agriculture and biotechnology, are gradually increasing adoption rates, enhancing yields and efficiency. Consumer behavior shifts towards healthier food options and increased awareness of sustainable agricultural practices are also influencing market trends. However, climatic variability and water scarcity pose significant challenges. The forecast period (2025-2033) projects continued growth, albeit at a moderated pace, reaching an estimated xx Million ZAR by 2033. Market penetration of new technologies is expected to increase steadily, contributing to enhanced productivity.
Dominant Regions, Countries, or Segments in Agriculture Industry in South Africa
The Cereals segment stands as the foremost contributor to the South African agricultural industry, propelled by robust domestic consumption needs and significant opportunities in international export markets. Geographically, the Western Cape and Mpumalanga provinces emerge as key agricultural hubs, largely owing to their advantageous climatic conditions and well-developed logistical and processing infrastructure.
- Cereals Dominance Factors: Sustained high domestic consumption, substantial global export markets, and a well-established production and supply chain infrastructure.
- Fruits and Vegetables Growth Potential: Increasing consumer preference for healthy and fresh produce, expanding avenues for export to international markets, and supportive government programs aimed at boosting horticultural production.
- Oilseeds: Driven by robust demand for edible oils and a burgeoning biofuel sector that requires domestic feedstock.
- Key Drivers: Favorable climatic conditions prevalent in key growing regions, targeted government support programs such as agricultural subsidies and incentives, and the availability of efficient infrastructure for transportation and market access.
Agriculture Industry in South Africa Product Landscape
The South African agricultural product landscape is diverse, encompassing a wide range of crops and livestock. Recent product innovations include drought-resistant crop varieties, improved animal breeds, and specialized fertilizers. Technological advancements such as precision agriculture techniques, drone technology for monitoring, and data analytics are enhancing efficiency and productivity. These innovations are driving improvements in yield, quality, and resource utilization. Unique selling propositions focus on quality, sustainability certifications, and traceability.
Key Drivers, Barriers & Challenges in Agriculture Industry in South Africa
Key Drivers: Increasing domestic demand, growing export markets, technological advancements (precision agriculture, biotechnology), favorable government policies (in certain areas).
Key Challenges: Climate change (drought, extreme weather), water scarcity, land reform challenges, high input costs (fertilizers, seeds, machinery), infrastructure limitations in rural areas, skills shortages, competition from international producers. The impact of these challenges is estimated to reduce annual growth by approximately xx% in the forecast period.
Emerging Opportunities in Agriculture Industry in South Africa
Significant emerging opportunities lie in the development and widespread adoption of drought-resistant and climate-resilient crop varieties, fostering the expansion of organic and sustainable farming practices, and cultivating the value-added agriculture sector through enhanced processing and packaging capabilities. Untapped export markets for unique and niche agricultural products also present considerable potential. Strategic investments in agricultural technology, including advanced mechanization and digital farming solutions, alongside critical infrastructure upgrades, will be instrumental in bolstering productivity and ensuring long-term sustainability. The burgeoning field of agritourism offers an additional and promising avenue for diversification and economic growth within the sector.
Growth Accelerators in the Agriculture Industry in South Africa Industry
Long-term growth in the South African agricultural sector will be accelerated by technological breakthroughs in precision agriculture and biotechnology, strategic partnerships between farmers and technology providers, and government initiatives promoting sustainable agricultural practices. Expanding export markets, particularly into Africa, and developing value-added agricultural products will also contribute to growth.
Key Players Shaping the Agriculture Industry in South Africa Market
- Pioneer Foods (now part of PepsiCo)
- Bayer Crop Science
- Syngenta
- [Note: Monsanto was acquired by Bayer in 2018. For historical context, it's relevant, but currently, Bayer is the primary entity.]
- Tiger Brands
- [Consider adding other significant local players like AVI, RCL Foods, Omnia Holdings, or major agricultural cooperatives if available.]
Notable Milestones in Agriculture Industry in South Africa Sector
- 2020: Government initiates a comprehensive national agricultural technology strategy aimed at driving innovation and modernization.
- 2021: Substantial governmental and private sector investment directed towards upgrading and expanding irrigation infrastructure, particularly in regions susceptible to drought.
- 2022: A notable increase in merger and acquisition activity within the agricultural inputs and services sector, indicating strategic consolidation and market restructuring.
- 2023: Successful introduction and wider availability of new drought-resistant crop varieties, offering enhanced resilience against challenging climatic conditions.
- [Add a more recent milestone if available, e.g., related to a specific policy, technology adoption, or export achievement.]
In-Depth Agriculture Industry in South Africa Market Outlook
The future of the South African agriculture industry is promising, driven by ongoing technological advancements, growing domestic and export demand, and increasing focus on sustainability. Strategic partnerships, investments in infrastructure, and effective government policies will be crucial in unlocking the full potential of the sector. The consistent growth projected for the forecast period indicates a positive outlook, but challenges related to climate change and resource management must be actively addressed.
Agriculture Industry in South Africa Segmentation
-
1. Crop Type
- 1.1. Cereals
- 1.2. Fruits
- 1.3. Vegetables
- 1.4. Oilseeds
-
2. Crop Type
- 2.1. Cereals
- 2.2. Fruits
- 2.3. Vegetables
- 2.4. Oilseeds
Agriculture Industry in South Africa Segmentation By Geography
-
1. North America
- 1.1. United States
- 1.2. Canada
- 1.3. Mexico
-
2. South America
- 2.1. Brazil
- 2.2. Argentina
- 2.3. Rest of South America
-
3. Europe
- 3.1. United Kingdom
- 3.2. Germany
- 3.3. France
- 3.4. Italy
- 3.5. Spain
- 3.6. Russia
- 3.7. Benelux
- 3.8. Nordics
- 3.9. Rest of Europe
-
4. Middle East & Africa
- 4.1. Turkey
- 4.2. Israel
- 4.3. GCC
- 4.4. North Africa
- 4.5. South Africa
- 4.6. Rest of Middle East & Africa
-
5. Asia Pacific
- 5.1. China
- 5.2. India
- 5.3. Japan
- 5.4. South Korea
- 5.5. ASEAN
- 5.6. Oceania
- 5.7. Rest of Asia Pacific
Agriculture Industry in South Africa Regional Market Share
Geographic Coverage of Agriculture Industry in South Africa
Agriculture Industry in South Africa REPORT HIGHLIGHTS
| Aspects | Details |
|---|---|
| Study Period | 2020-2034 |
| Base Year | 2025 |
| Estimated Year | 2026 |
| Forecast Period | 2026-2034 |
| Historical Period | 2020-2025 |
| Growth Rate | CAGR of 7.60% from 2020-2034 |
| Segmentation |
|
Table of Contents
- 1. Introduction
- 1.1. Research Scope
- 1.2. Market Segmentation
- 1.3. Research Methodology
- 1.4. Definitions and Assumptions
- 2. Executive Summary
- 2.1. Introduction
- 3. Market Dynamics
- 3.1. Introduction
- 3.2. Market Drivers
- 3.2.1. Rising Consumption of Cashew Nuts as a Healthy Snack; Increasing Government initiatives; Growing Cashew Nut Imports in The United States
- 3.3. Market Restrains
- 3.3.1. Hazardous Climatic Condition Hinders Cashew Production; Stringent Regulations Related To Food Quality Standards
- 3.4. Market Trends
- 3.4.1. High Demand for Food Crops with the rising population
- 4. Market Factor Analysis
- 4.1. Porters Five Forces
- 4.2. Supply/Value Chain
- 4.3. PESTEL analysis
- 4.4. Market Entropy
- 4.5. Patent/Trademark Analysis
- 5. Global Agriculture Industry in South Africa Analysis, Insights and Forecast, 2020-2032
- 5.1. Market Analysis, Insights and Forecast - by Crop Type
- 5.1.1. Cereals
- 5.1.2. Fruits
- 5.1.3. Vegetables
- 5.1.4. Oilseeds
- 5.2. Market Analysis, Insights and Forecast - by Crop Type
- 5.2.1. Cereals
- 5.2.2. Fruits
- 5.2.3. Vegetables
- 5.2.4. Oilseeds
- 5.3. Market Analysis, Insights and Forecast - by Region
- 5.3.1. North America
- 5.3.2. South America
- 5.3.3. Europe
- 5.3.4. Middle East & Africa
- 5.3.5. Asia Pacific
- 5.1. Market Analysis, Insights and Forecast - by Crop Type
- 6. North America Agriculture Industry in South Africa Analysis, Insights and Forecast, 2020-2032
- 6.1. Market Analysis, Insights and Forecast - by Crop Type
- 6.1.1. Cereals
- 6.1.2. Fruits
- 6.1.3. Vegetables
- 6.1.4. Oilseeds
- 6.2. Market Analysis, Insights and Forecast - by Crop Type
- 6.2.1. Cereals
- 6.2.2. Fruits
- 6.2.3. Vegetables
- 6.2.4. Oilseeds
- 6.1. Market Analysis, Insights and Forecast - by Crop Type
- 7. South America Agriculture Industry in South Africa Analysis, Insights and Forecast, 2020-2032
- 7.1. Market Analysis, Insights and Forecast - by Crop Type
- 7.1.1. Cereals
- 7.1.2. Fruits
- 7.1.3. Vegetables
- 7.1.4. Oilseeds
- 7.2. Market Analysis, Insights and Forecast - by Crop Type
- 7.2.1. Cereals
- 7.2.2. Fruits
- 7.2.3. Vegetables
- 7.2.4. Oilseeds
- 7.1. Market Analysis, Insights and Forecast - by Crop Type
- 8. Europe Agriculture Industry in South Africa Analysis, Insights and Forecast, 2020-2032
- 8.1. Market Analysis, Insights and Forecast - by Crop Type
- 8.1.1. Cereals
- 8.1.2. Fruits
- 8.1.3. Vegetables
- 8.1.4. Oilseeds
- 8.2. Market Analysis, Insights and Forecast - by Crop Type
- 8.2.1. Cereals
- 8.2.2. Fruits
- 8.2.3. Vegetables
- 8.2.4. Oilseeds
- 8.1. Market Analysis, Insights and Forecast - by Crop Type
- 9. Middle East & Africa Agriculture Industry in South Africa Analysis, Insights and Forecast, 2020-2032
- 9.1. Market Analysis, Insights and Forecast - by Crop Type
- 9.1.1. Cereals
- 9.1.2. Fruits
- 9.1.3. Vegetables
- 9.1.4. Oilseeds
- 9.2. Market Analysis, Insights and Forecast - by Crop Type
- 9.2.1. Cereals
- 9.2.2. Fruits
- 9.2.3. Vegetables
- 9.2.4. Oilseeds
- 9.1. Market Analysis, Insights and Forecast - by Crop Type
- 10. Asia Pacific Agriculture Industry in South Africa Analysis, Insights and Forecast, 2020-2032
- 10.1. Market Analysis, Insights and Forecast - by Crop Type
- 10.1.1. Cereals
- 10.1.2. Fruits
- 10.1.3. Vegetables
- 10.1.4. Oilseeds
- 10.2. Market Analysis, Insights and Forecast - by Crop Type
- 10.2.1. Cereals
- 10.2.2. Fruits
- 10.2.3. Vegetables
- 10.2.4. Oilseeds
- 10.1. Market Analysis, Insights and Forecast - by Crop Type
- 11. Competitive Analysis
- 11.1. Global Market Share Analysis 2025
- 11.2. Company Profiles
- 11.2.1 Pioneer Foods
- 11.2.1.1. Overview
- 11.2.1.2. Products
- 11.2.1.3. SWOT Analysis
- 11.2.1.4. Recent Developments
- 11.2.1.5. Financials (Based on Availability)
- 11.2.2 Bayer Crop Science
- 11.2.2.1. Overview
- 11.2.2.2. Products
- 11.2.2.3. SWOT Analysis
- 11.2.2.4. Recent Developments
- 11.2.2.5. Financials (Based on Availability)
- 11.2.3 Syngenta
- 11.2.3.1. Overview
- 11.2.3.2. Products
- 11.2.3.3. SWOT Analysis
- 11.2.3.4. Recent Developments
- 11.2.3.5. Financials (Based on Availability)
- 11.2.4 Monsanto
- 11.2.4.1. Overview
- 11.2.4.2. Products
- 11.2.4.3. SWOT Analysis
- 11.2.4.4. Recent Developments
- 11.2.4.5. Financials (Based on Availability)
- 11.2.5 Tiger Brands
- 11.2.5.1. Overview
- 11.2.5.2. Products
- 11.2.5.3. SWOT Analysis
- 11.2.5.4. Recent Developments
- 11.2.5.5. Financials (Based on Availability)
- 11.2.1 Pioneer Foods
List of Figures
- Figure 1: Global Agriculture Industry in South Africa Revenue Breakdown (Million, %) by Region 2025 & 2033
- Figure 2: North America Agriculture Industry in South Africa Revenue (Million), by Crop Type 2025 & 2033
- Figure 3: North America Agriculture Industry in South Africa Revenue Share (%), by Crop Type 2025 & 2033
- Figure 4: North America Agriculture Industry in South Africa Revenue (Million), by Crop Type 2025 & 2033
- Figure 5: North America Agriculture Industry in South Africa Revenue Share (%), by Crop Type 2025 & 2033
- Figure 6: North America Agriculture Industry in South Africa Revenue (Million), by Country 2025 & 2033
- Figure 7: North America Agriculture Industry in South Africa Revenue Share (%), by Country 2025 & 2033
- Figure 8: South America Agriculture Industry in South Africa Revenue (Million), by Crop Type 2025 & 2033
- Figure 9: South America Agriculture Industry in South Africa Revenue Share (%), by Crop Type 2025 & 2033
- Figure 10: South America Agriculture Industry in South Africa Revenue (Million), by Crop Type 2025 & 2033
- Figure 11: South America Agriculture Industry in South Africa Revenue Share (%), by Crop Type 2025 & 2033
- Figure 12: South America Agriculture Industry in South Africa Revenue (Million), by Country 2025 & 2033
- Figure 13: South America Agriculture Industry in South Africa Revenue Share (%), by Country 2025 & 2033
- Figure 14: Europe Agriculture Industry in South Africa Revenue (Million), by Crop Type 2025 & 2033
- Figure 15: Europe Agriculture Industry in South Africa Revenue Share (%), by Crop Type 2025 & 2033
- Figure 16: Europe Agriculture Industry in South Africa Revenue (Million), by Crop Type 2025 & 2033
- Figure 17: Europe Agriculture Industry in South Africa Revenue Share (%), by Crop Type 2025 & 2033
- Figure 18: Europe Agriculture Industry in South Africa Revenue (Million), by Country 2025 & 2033
- Figure 19: Europe Agriculture Industry in South Africa Revenue Share (%), by Country 2025 & 2033
- Figure 20: Middle East & Africa Agriculture Industry in South Africa Revenue (Million), by Crop Type 2025 & 2033
- Figure 21: Middle East & Africa Agriculture Industry in South Africa Revenue Share (%), by Crop Type 2025 & 2033
- Figure 22: Middle East & Africa Agriculture Industry in South Africa Revenue (Million), by Crop Type 2025 & 2033
- Figure 23: Middle East & Africa Agriculture Industry in South Africa Revenue Share (%), by Crop Type 2025 & 2033
- Figure 24: Middle East & Africa Agriculture Industry in South Africa Revenue (Million), by Country 2025 & 2033
- Figure 25: Middle East & Africa Agriculture Industry in South Africa Revenue Share (%), by Country 2025 & 2033
- Figure 26: Asia Pacific Agriculture Industry in South Africa Revenue (Million), by Crop Type 2025 & 2033
- Figure 27: Asia Pacific Agriculture Industry in South Africa Revenue Share (%), by Crop Type 2025 & 2033
- Figure 28: Asia Pacific Agriculture Industry in South Africa Revenue (Million), by Crop Type 2025 & 2033
- Figure 29: Asia Pacific Agriculture Industry in South Africa Revenue Share (%), by Crop Type 2025 & 2033
- Figure 30: Asia Pacific Agriculture Industry in South Africa Revenue (Million), by Country 2025 & 2033
- Figure 31: Asia Pacific Agriculture Industry in South Africa Revenue Share (%), by Country 2025 & 2033
List of Tables
- Table 1: Global Agriculture Industry in South Africa Revenue Million Forecast, by Crop Type 2020 & 2033
- Table 2: Global Agriculture Industry in South Africa Revenue Million Forecast, by Crop Type 2020 & 2033
- Table 3: Global Agriculture Industry in South Africa Revenue Million Forecast, by Region 2020 & 2033
- Table 4: Global Agriculture Industry in South Africa Revenue Million Forecast, by Crop Type 2020 & 2033
- Table 5: Global Agriculture Industry in South Africa Revenue Million Forecast, by Crop Type 2020 & 2033
- Table 6: Global Agriculture Industry in South Africa Revenue Million Forecast, by Country 2020 & 2033
- Table 7: United States Agriculture Industry in South Africa Revenue (Million) Forecast, by Application 2020 & 2033
- Table 8: Canada Agriculture Industry in South Africa Revenue (Million) Forecast, by Application 2020 & 2033
- Table 9: Mexico Agriculture Industry in South Africa Revenue (Million) Forecast, by Application 2020 & 2033
- Table 10: Global Agriculture Industry in South Africa Revenue Million Forecast, by Crop Type 2020 & 2033
- Table 11: Global Agriculture Industry in South Africa Revenue Million Forecast, by Crop Type 2020 & 2033
- Table 12: Global Agriculture Industry in South Africa Revenue Million Forecast, by Country 2020 & 2033
- Table 13: Brazil Agriculture Industry in South Africa Revenue (Million) Forecast, by Application 2020 & 2033
- Table 14: Argentina Agriculture Industry in South Africa Revenue (Million) Forecast, by Application 2020 & 2033
- Table 15: Rest of South America Agriculture Industry in South Africa Revenue (Million) Forecast, by Application 2020 & 2033
- Table 16: Global Agriculture Industry in South Africa Revenue Million Forecast, by Crop Type 2020 & 2033
- Table 17: Global Agriculture Industry in South Africa Revenue Million Forecast, by Crop Type 2020 & 2033
- Table 18: Global Agriculture Industry in South Africa Revenue Million Forecast, by Country 2020 & 2033
- Table 19: United Kingdom Agriculture Industry in South Africa Revenue (Million) Forecast, by Application 2020 & 2033
- Table 20: Germany Agriculture Industry in South Africa Revenue (Million) Forecast, by Application 2020 & 2033
- Table 21: France Agriculture Industry in South Africa Revenue (Million) Forecast, by Application 2020 & 2033
- Table 22: Italy Agriculture Industry in South Africa Revenue (Million) Forecast, by Application 2020 & 2033
- Table 23: Spain Agriculture Industry in South Africa Revenue (Million) Forecast, by Application 2020 & 2033
- Table 24: Russia Agriculture Industry in South Africa Revenue (Million) Forecast, by Application 2020 & 2033
- Table 25: Benelux Agriculture Industry in South Africa Revenue (Million) Forecast, by Application 2020 & 2033
- Table 26: Nordics Agriculture Industry in South Africa Revenue (Million) Forecast, by Application 2020 & 2033
- Table 27: Rest of Europe Agriculture Industry in South Africa Revenue (Million) Forecast, by Application 2020 & 2033
- Table 28: Global Agriculture Industry in South Africa Revenue Million Forecast, by Crop Type 2020 & 2033
- Table 29: Global Agriculture Industry in South Africa Revenue Million Forecast, by Crop Type 2020 & 2033
- Table 30: Global Agriculture Industry in South Africa Revenue Million Forecast, by Country 2020 & 2033
- Table 31: Turkey Agriculture Industry in South Africa Revenue (Million) Forecast, by Application 2020 & 2033
- Table 32: Israel Agriculture Industry in South Africa Revenue (Million) Forecast, by Application 2020 & 2033
- Table 33: GCC Agriculture Industry in South Africa Revenue (Million) Forecast, by Application 2020 & 2033
- Table 34: North Africa Agriculture Industry in South Africa Revenue (Million) Forecast, by Application 2020 & 2033
- Table 35: South Africa Agriculture Industry in South Africa Revenue (Million) Forecast, by Application 2020 & 2033
- Table 36: Rest of Middle East & Africa Agriculture Industry in South Africa Revenue (Million) Forecast, by Application 2020 & 2033
- Table 37: Global Agriculture Industry in South Africa Revenue Million Forecast, by Crop Type 2020 & 2033
- Table 38: Global Agriculture Industry in South Africa Revenue Million Forecast, by Crop Type 2020 & 2033
- Table 39: Global Agriculture Industry in South Africa Revenue Million Forecast, by Country 2020 & 2033
- Table 40: China Agriculture Industry in South Africa Revenue (Million) Forecast, by Application 2020 & 2033
- Table 41: India Agriculture Industry in South Africa Revenue (Million) Forecast, by Application 2020 & 2033
- Table 42: Japan Agriculture Industry in South Africa Revenue (Million) Forecast, by Application 2020 & 2033
- Table 43: South Korea Agriculture Industry in South Africa Revenue (Million) Forecast, by Application 2020 & 2033
- Table 44: ASEAN Agriculture Industry in South Africa Revenue (Million) Forecast, by Application 2020 & 2033
- Table 45: Oceania Agriculture Industry in South Africa Revenue (Million) Forecast, by Application 2020 & 2033
- Table 46: Rest of Asia Pacific Agriculture Industry in South Africa Revenue (Million) Forecast, by Application 2020 & 2033
Frequently Asked Questions
1. What is the projected Compound Annual Growth Rate (CAGR) of the Agriculture Industry in South Africa?
The projected CAGR is approximately 7.60%.
2. Which companies are prominent players in the Agriculture Industry in South Africa?
Key companies in the market include Pioneer Foods , Bayer Crop Science , Syngenta , Monsanto , Tiger Brands.
3. What are the main segments of the Agriculture Industry in South Africa?
The market segments include Crop Type, Crop Type.
4. Can you provide details about the market size?
The market size is estimated to be USD 16.12 Million as of 2022.
5. What are some drivers contributing to market growth?
Rising Consumption of Cashew Nuts as a Healthy Snack; Increasing Government initiatives; Growing Cashew Nut Imports in The United States.
6. What are the notable trends driving market growth?
High Demand for Food Crops with the rising population.
7. Are there any restraints impacting market growth?
Hazardous Climatic Condition Hinders Cashew Production; Stringent Regulations Related To Food Quality Standards.
8. Can you provide examples of recent developments in the market?
N/A
9. What pricing options are available for accessing the report?
Pricing options include single-user, multi-user, and enterprise licenses priced at USD 3800, USD 4500, and USD 5800 respectively.
10. Is the market size provided in terms of value or volume?
The market size is provided in terms of value, measured in Million.
11. Are there any specific market keywords associated with the report?
Yes, the market keyword associated with the report is "Agriculture Industry in South Africa," which aids in identifying and referencing the specific market segment covered.
12. How do I determine which pricing option suits my needs best?
The pricing options vary based on user requirements and access needs. Individual users may opt for single-user licenses, while businesses requiring broader access may choose multi-user or enterprise licenses for cost-effective access to the report.
13. Are there any additional resources or data provided in the Agriculture Industry in South Africa report?
While the report offers comprehensive insights, it's advisable to review the specific contents or supplementary materials provided to ascertain if additional resources or data are available.
14. How can I stay updated on further developments or reports in the Agriculture Industry in South Africa?
To stay informed about further developments, trends, and reports in the Agriculture Industry in South Africa, consider subscribing to industry newsletters, following relevant companies and organizations, or regularly checking reputable industry news sources and publications.
Methodology
Step 1 - Identification of Relevant Samples Size from Population Database


Step 2 - Approaches for Defining Global Market Size (Value, Volume* & Price*)

Note*: In applicable scenarios
Step 3 - Data Sources
Primary Research
- Web Analytics
- Survey Reports
- Research Institute
- Latest Research Reports
- Opinion Leaders
Secondary Research
- Annual Reports
- White Paper
- Latest Press Release
- Industry Association
- Paid Database
- Investor Presentations

Step 4 - Data Triangulation
Involves using different sources of information in order to increase the validity of a study
These sources are likely to be stakeholders in a program - participants, other researchers, program staff, other community members, and so on.
Then we put all data in single framework & apply various statistical tools to find out the dynamic on the market.
During the analysis stage, feedback from the stakeholder groups would be compared to determine areas of agreement as well as areas of divergence