

Key Insights
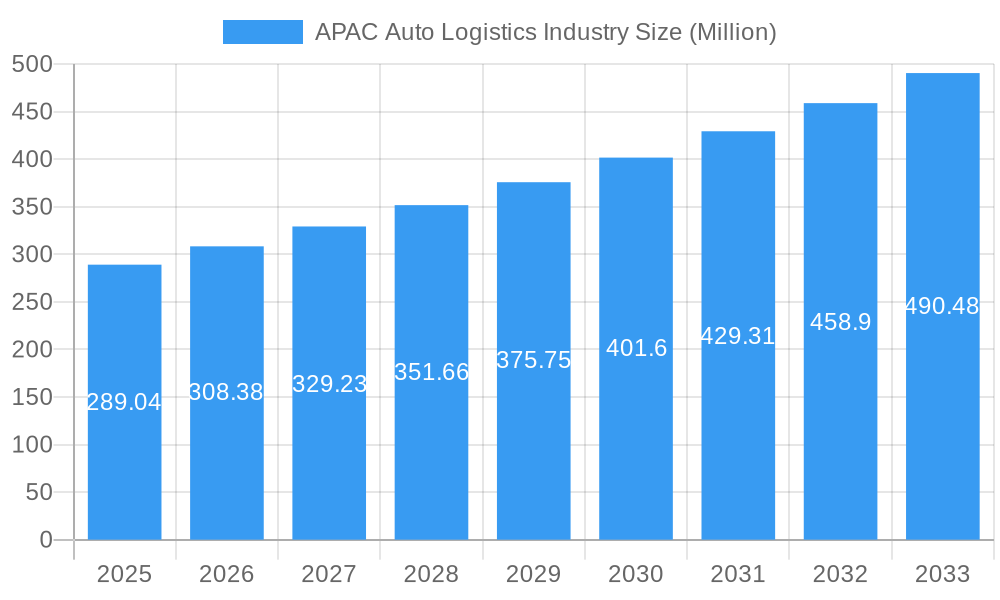
The Asia-Pacific (APAC) auto logistics market, valued at $289.04 million in 2025, is projected to experience robust growth, exhibiting a Compound Annual Growth Rate (CAGR) exceeding 6.50% from 2025 to 2033. This expansion is fueled by several key factors. The burgeoning automotive manufacturing and sales within the region, particularly in China, India, and other Southeast Asian nations, significantly drives demand for efficient and reliable auto logistics services. Increasing investments in infrastructure, including improved road networks and port facilities, further enhance the sector's capacity to handle the growing volume of vehicle and component shipments. The rise of e-commerce and the increasing popularity of online vehicle sales are also contributing to market growth by creating a demand for specialized last-mile delivery solutions. Furthermore, the adoption of advanced technologies such as blockchain for supply chain transparency and AI-powered route optimization is streamlining operations and improving efficiency, thereby attracting investments and boosting market growth.
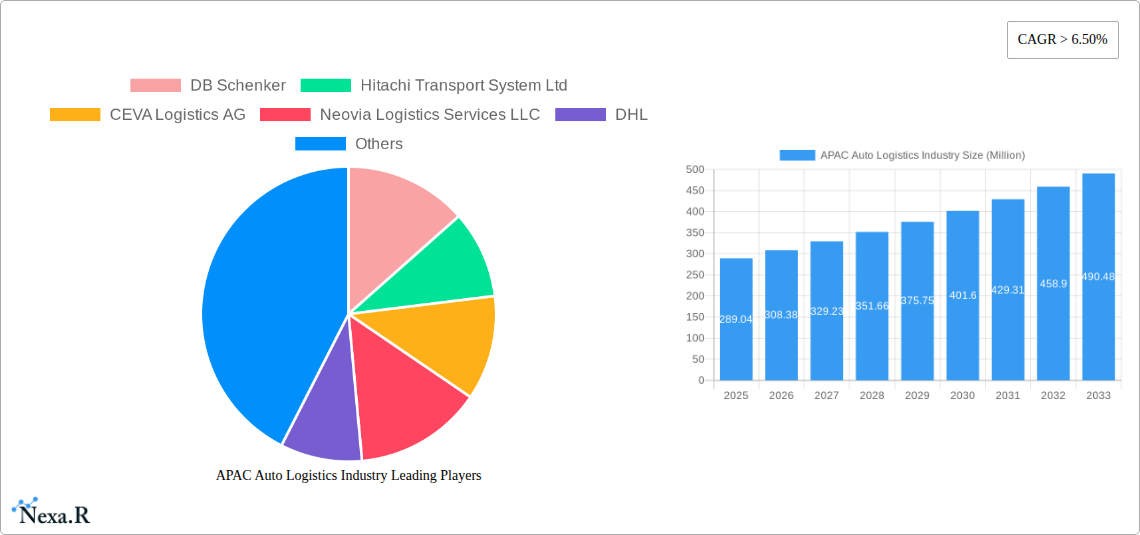
APAC Auto Logistics Industry Market Size (In Million)
However, challenges remain. Fluctuations in fuel prices and geopolitical instability can impact transportation costs and overall market stability. The ongoing semiconductor shortage and disruptions in global supply chains also pose significant headwinds. Furthermore, stringent environmental regulations and the growing focus on sustainability are prompting logistics providers to adopt eco-friendly practices, which may involve higher initial investments. Despite these challenges, the long-term outlook for the APAC auto logistics market remains positive, driven by the sustained growth of the automotive industry and the ongoing technological advancements within the logistics sector. The market's segmentation by service type (transportation, warehousing, etc.), vehicle type (finished vehicles, components), and country provides valuable insights into specific growth opportunities and challenges across the region. Key players like DB Schenker, DHL, and others are strategically positioning themselves to capitalize on this growth potential through expansion, technological upgrades, and strategic partnerships.
APAC Auto Logistics Industry Company Market Share
APAC Auto Logistics Industry: 2019-2033 Market Report
This comprehensive report provides an in-depth analysis of the Asia-Pacific (APAC) auto logistics industry, covering market dynamics, growth trends, key players, and future outlook. With a study period spanning 2019-2033 (base year 2025, forecast period 2025-2033), this report is an essential resource for industry professionals, investors, and strategic decision-makers. The report segments the market by service (Transportation, Warehousing, Distribution & Inventory Management, Other Services), vehicle type (Finished Vehicle, Auto Components, Other types), and country (China, India, Japan, South Korea, Indonesia, Philippines, Rest of Asia-Pacific), offering granular insights into market size and growth potential.
APAC Auto Logistics Industry Market Dynamics & Structure
The APAC auto logistics market is characterized by a moderately concentrated landscape, with key players like DB Schenker, Hitachi Transport System Ltd, CEVA Logistics AG, Neovia Logistics Services LLC, DHL, Yusen Logistics Co Ltd, GEODIS, Nippon Express Co Ltd, United Parcel Service Inc, XPO Logistics Inc, KUEHNE + NAGEL International AG, DSV, and Ryder System Inc vying for market share. Market concentration is estimated at xx% in 2025, with the top 5 players holding a combined xx% share.
Technological innovation, particularly in areas like autonomous vehicles, blockchain technology for supply chain transparency, and AI-powered route optimization, is a major driver of market growth. However, integration challenges and high initial investment costs pose barriers to wider adoption. Stringent regulatory frameworks concerning data privacy and emission standards further impact market dynamics. The rising preference for electric vehicles (EVs) is creating new opportunities, while the emergence of alternative transportation modes such as rail and inland waterways presents both opportunities and challenges. Mergers and acquisitions (M&A) activity has been moderate in recent years, with an estimated xx number of deals completed in the last 5 years.
- Market Concentration: xx% in 2025 (Top 5 players: xx%)
- Technological Innovation: Autonomous vehicles, blockchain, AI
- Regulatory Landscape: Stringent data privacy and emission standards
- M&A Activity: xx deals in the past 5 years
APAC Auto Logistics Industry Growth Trends & Insights
The APAC auto logistics market has demonstrated robust and dynamic growth over the historical period (2019-2024). This expansion was propelled by a confluence of factors, including escalating vehicle production volumes across the region, the sustained rise of e-commerce platforms influencing consumer purchasing habits, and a notable increase in cross-border trade activities. In 2024, the market size was estimated at xx million units, reflecting a Compound Annual Growth Rate (CAGR) of xx% from 2019 to 2024. Market penetration currently stands at an estimated xx% in 2024. The industry is undergoing a significant transformation, accelerated by technological innovations such as the advent of autonomous trucking solutions and the widespread adoption of sophisticated digital logistics platforms. Furthermore, evolving consumer preferences, particularly a growing inclination towards purchasing vehicles online and the demand for expedited delivery services, are actively shaping market dynamics.
Looking ahead, the forecast period (2025-2033) indicates a trajectory of continued substantial growth. The market is projected to expand at a CAGR of xx%, reaching an impressive market size of xx million units by 2033. This anticipated growth will be primarily driven by the projected increase in vehicle production within rapidly developing emerging economies, significant advancements in logistics technologies that enhance efficiency and reduce costs, and proactive government support aimed at improving transportation infrastructure and fostering a conducive environment for the logistics sector.
Dominant Regions, Countries, or Segments in APAC Auto Logistics Industry
China remains the dominant market in the APAC region, accounting for xx% of the total market size in 2025, driven by its massive automotive industry and robust infrastructure. India is a rapidly growing market, with significant potential fueled by increasing vehicle production and government initiatives supporting infrastructure development. The Transportation segment dominates the service landscape, holding approximately xx% of market share, followed by Warehousing and Distribution & Inventory Management. The Finished Vehicle segment leads in terms of vehicle type, reflecting the high demand for new car deliveries.
- China: Largest market, xx% market share in 2025
- India: Rapid growth, high potential due to increased production and infrastructure development
- Transportation Segment: Dominates service landscape (xx% market share)
- Finished Vehicle Segment: Largest vehicle type segment
APAP Auto Logistics Industry Product Landscape
The APAP auto logistics industry is characterized by a diverse range of products and services, from traditional transportation and warehousing to advanced technology solutions such as AI-powered route optimization software and blockchain-based tracking systems. These solutions enhance efficiency, transparency, and security across the supply chain. Unique selling propositions often include reduced transit times, minimized damage rates, and improved traceability. Technological advancements in areas like autonomous vehicles, drone delivery, and IoT-enabled tracking devices are constantly shaping the product landscape.
Key Drivers, Barriers & Challenges in APAC Auto Logistics Industry
Key Drivers:
- Rising vehicle production in APAC countries.
- Growing e-commerce and online vehicle sales.
- Expanding infrastructure in emerging markets.
- Technological advancements in logistics and transportation.
Challenges & Restraints:
- Supply chain disruptions due to geopolitical uncertainties and pandemics. (Estimated impact: xx% reduction in efficiency in 2022)
- Stringent regulatory requirements impacting operational costs.
- Intense competition among established and emerging players. (Increased competition has reduced profit margins by an estimated xx% in 2024)
Emerging Opportunities in APAC Auto Logistics Industry
The APAC auto logistics landscape is ripe with emerging opportunities, catering to the evolving needs of the automotive sector:
- The burgeoning electric vehicle (EV) market presents a unique set of challenges and opportunities, necessitating the development and implementation of specialized logistics solutions for EV battery transportation, charging infrastructure support, and end-of-life battery management.
- Significant untapped potential lies in the expansion into less developed yet rapidly growing markets within Southeast Asia, requiring tailored logistics strategies to overcome infrastructure limitations and meet localized demand.
- There is a growing imperative and market demand for the development and adoption of sustainable and eco-friendly logistics solutions, including the optimization of transport routes, the use of alternative fuels, and the implementation of circular economy principles within the supply chain.
Growth Accelerators in the APAC Auto Logistics Industry
Several key factors are acting as powerful accelerators for the long-term growth of the APAC auto logistics industry:
- The formation of strategic partnerships and deep collaborations between leading logistics providers and prominent auto manufacturers is crucial for optimizing supply chain efficiencies, sharing expertise, and jointly developing innovative solutions.
- Continuous technological breakthroughs, particularly in the fields of automation, robotics, and artificial intelligence (AI), are revolutionizing operational processes, leading to enhanced speed, accuracy, and cost-effectiveness in logistics operations.
- Proactive and supportive government initiatives focused on enhancing transportation infrastructure, streamlining regulatory frameworks, and promoting the adoption of sustainable logistics practices are vital for fostering a favorable growth environment.
Key Players Shaping the APAC Auto Logistics Industry Market
- DB Schenker
- Hitachi Transport System Ltd
- CEVA Logistics AG
- Neovia Logistics Services LLC
- DHL
- Yusen Logistics Co Ltd
- GEODIS
- Nippon Express Co Ltd
- United Parcel Service Inc
- XPO Logistics Inc
- KUEHNE + NAGEL International AG
- DSV
- Ryder System Inc
Notable Milestones in APAC Auto Logistics Industry Sector
- December 2022: Tata Motors signed a contract with Everest Fleet Pvt. Ltd. for the delivery of 5,000 XPRES-T EVs.
- March 2023: Tata Motors received an order for 1000 XPRES-T EVs from OHM E Logistics Pvt. Ltd.
In-Depth APAC Auto Logistics Industry Market Outlook
The APAC auto logistics market is poised for sustained growth over the forecast period, driven by the factors mentioned previously. Strategic partnerships, investments in innovative technologies, and expansion into untapped markets will be key to success. The increasing adoption of sustainable logistics solutions presents a significant opportunity for growth, while addressing regulatory and environmental challenges will remain crucial. The market offers substantial potential for both established players and new entrants, making it an attractive sector for investment and expansion.
APAC Auto Logistics Industry Segmentation
-
1. Service
- 1.1. Transportation
- 1.2. Warehousing, Distribution and Inventory Management
- 1.3. Other Services
-
2. Type
- 2.1. Finished Vehicle
- 2.2. Auto Components
- 2.3. Other types
APAC Auto Logistics Industry Segmentation By Geography
-
1. North America
- 1.1. United States
- 1.2. Canada
- 1.3. Mexico
-
2. South America
- 2.1. Brazil
- 2.2. Argentina
- 2.3. Rest of South America
-
3. Europe
- 3.1. United Kingdom
- 3.2. Germany
- 3.3. France
- 3.4. Italy
- 3.5. Spain
- 3.6. Russia
- 3.7. Benelux
- 3.8. Nordics
- 3.9. Rest of Europe
-
4. Middle East & Africa
- 4.1. Turkey
- 4.2. Israel
- 4.3. GCC
- 4.4. North Africa
- 4.5. South Africa
- 4.6. Rest of Middle East & Africa
-
5. Asia Pacific
- 5.1. China
- 5.2. India
- 5.3. Japan
- 5.4. South Korea
- 5.5. ASEAN
- 5.6. Oceania
- 5.7. Rest of Asia Pacific
APAC Auto Logistics Industry Regional Market Share
Geographic Coverage of APAC Auto Logistics Industry
APAC Auto Logistics Industry REPORT HIGHLIGHTS
| Aspects | Details |
|---|---|
| Study Period | 2020-2034 |
| Base Year | 2025 |
| Estimated Year | 2026 |
| Forecast Period | 2026-2034 |
| Historical Period | 2020-2025 |
| Growth Rate | CAGR of > 6.50% from 2020-2034 |
| Segmentation |
|
Table of Contents
- 1. Introduction
- 1.1. Research Scope
- 1.2. Market Segmentation
- 1.3. Research Objective
- 1.4. Definitions and Assumptions
- 2. Executive Summary
- 2.1. Market Snapshot
- 3. Market Dynamics
- 3.1. Market Drivers
- 3.2. Market Restrains
- 3.3. Market Trends
- 3.4. Market Opportunities
- 4. Market Factor Analysis
- 4.1. Porters Five Forces
- 4.1.1. Bargaining Power of Suppliers
- 4.1.2. Bargaining Power of Buyers
- 4.1.3. Threat of New Entrants
- 4.1.4. Threat of Substitutes
- 4.1.5. Competitive Rivalry
- 4.2. PESTEL analysis
- 4.3. BCG Analysis
- 4.3.1. Stars (High Growth, High Market Share)
- 4.3.2. Cash Cows (Low Growth, High Market Share)
- 4.3.3. Question Mark (High Growth, Low Market Share)
- 4.3.4. Dogs (Low Growth, Low Market Share)
- 4.4. Ansoff Matrix Analysis
- 4.5. Supply Chain Analysis
- 4.6. Regulatory Landscape
- 4.7. Current Market Potential and Opportunity Assessment (TAM–SAM–SOM Framework)
- 4.8. NRP Analyst Note
- 4.1. Porters Five Forces
- 5. Market Analysis, Insights and Forecast 2021-2033
- 5.1. Market Analysis, Insights and Forecast - by Service
- 5.1.1. Transportation
- 5.1.2. Warehousing, Distribution and Inventory Management
- 5.1.3. Other Services
- 5.2. Market Analysis, Insights and Forecast - by Type
- 5.2.1. Finished Vehicle
- 5.2.2. Auto Components
- 5.2.3. Other types
- 5.3. Market Analysis, Insights and Forecast - by Region
- 5.3.1. North America
- 5.3.2. South America
- 5.3.3. Europe
- 5.3.4. Middle East & Africa
- 5.3.5. Asia Pacific
- 5.1. Market Analysis, Insights and Forecast - by Service
- 6. Global APAC Auto Logistics Industry Analysis, Insights and Forecast, 2021-2033
- 6.1. Market Analysis, Insights and Forecast - by Service
- 6.1.1. Transportation
- 6.1.2. Warehousing, Distribution and Inventory Management
- 6.1.3. Other Services
- 6.2. Market Analysis, Insights and Forecast - by Type
- 6.2.1. Finished Vehicle
- 6.2.2. Auto Components
- 6.2.3. Other types
- 6.1. Market Analysis, Insights and Forecast - by Service
- 7. North America APAC Auto Logistics Industry Analysis, Insights and Forecast, 2020-2032
- 7.1. Market Analysis, Insights and Forecast - by Service
- 7.1.1. Transportation
- 7.1.2. Warehousing, Distribution and Inventory Management
- 7.1.3. Other Services
- 7.2. Market Analysis, Insights and Forecast - by Type
- 7.2.1. Finished Vehicle
- 7.2.2. Auto Components
- 7.2.3. Other types
- 7.1. Market Analysis, Insights and Forecast - by Service
- 8. South America APAC Auto Logistics Industry Analysis, Insights and Forecast, 2020-2032
- 8.1. Market Analysis, Insights and Forecast - by Service
- 8.1.1. Transportation
- 8.1.2. Warehousing, Distribution and Inventory Management
- 8.1.3. Other Services
- 8.2. Market Analysis, Insights and Forecast - by Type
- 8.2.1. Finished Vehicle
- 8.2.2. Auto Components
- 8.2.3. Other types
- 8.1. Market Analysis, Insights and Forecast - by Service
- 9. Europe APAC Auto Logistics Industry Analysis, Insights and Forecast, 2020-2032
- 9.1. Market Analysis, Insights and Forecast - by Service
- 9.1.1. Transportation
- 9.1.2. Warehousing, Distribution and Inventory Management
- 9.1.3. Other Services
- 9.2. Market Analysis, Insights and Forecast - by Type
- 9.2.1. Finished Vehicle
- 9.2.2. Auto Components
- 9.2.3. Other types
- 9.1. Market Analysis, Insights and Forecast - by Service
- 10. Middle East & Africa APAC Auto Logistics Industry Analysis, Insights and Forecast, 2020-2032
- 10.1. Market Analysis, Insights and Forecast - by Service
- 10.1.1. Transportation
- 10.1.2. Warehousing, Distribution and Inventory Management
- 10.1.3. Other Services
- 10.2. Market Analysis, Insights and Forecast - by Type
- 10.2.1. Finished Vehicle
- 10.2.2. Auto Components
- 10.2.3. Other types
- 10.1. Market Analysis, Insights and Forecast - by Service
- 11. Asia Pacific APAC Auto Logistics Industry Analysis, Insights and Forecast, 2020-2032
- 11.1. Market Analysis, Insights and Forecast - by Service
- 11.1.1. Transportation
- 11.1.2. Warehousing, Distribution and Inventory Management
- 11.1.3. Other Services
- 11.2. Market Analysis, Insights and Forecast - by Type
- 11.2.1. Finished Vehicle
- 11.2.2. Auto Components
- 11.2.3. Other types
- 11.1. Market Analysis, Insights and Forecast - by Service
- 12. Competitive Analysis
- 12.1. Company Profiles
- 12.1.1 DB Schenker
- 12.1.1.1. Company Overview
- 12.1.1.2. Products
- 12.1.1.3. Company Financials
- 12.1.1.4. SWOT Analysis
- 12.1.2 Hitachi Transport System Ltd
- 12.1.2.1. Company Overview
- 12.1.2.2. Products
- 12.1.2.3. Company Financials
- 12.1.2.4. SWOT Analysis
- 12.1.3 CEVA Logistics AG
- 12.1.3.1. Company Overview
- 12.1.3.2. Products
- 12.1.3.3. Company Financials
- 12.1.3.4. SWOT Analysis
- 12.1.4 Neovia Logistics Services LLC
- 12.1.4.1. Company Overview
- 12.1.4.2. Products
- 12.1.4.3. Company Financials
- 12.1.4.4. SWOT Analysis
- 12.1.5 DHL
- 12.1.5.1. Company Overview
- 12.1.5.2. Products
- 12.1.5.3. Company Financials
- 12.1.5.4. SWOT Analysis
- 12.1.6 Yusen Logistics Co Ltd
- 12.1.6.1. Company Overview
- 12.1.6.2. Products
- 12.1.6.3. Company Financials
- 12.1.6.4. SWOT Analysis
- 12.1.7 GEODIS
- 12.1.7.1. Company Overview
- 12.1.7.2. Products
- 12.1.7.3. Company Financials
- 12.1.7.4. SWOT Analysis
- 12.1.8 Nippon Express Co Ltd
- 12.1.8.1. Company Overview
- 12.1.8.2. Products
- 12.1.8.3. Company Financials
- 12.1.8.4. SWOT Analysis
- 12.1.9 United Parcel Service Inc**List Not Exhaustive
- 12.1.9.1. Company Overview
- 12.1.9.2. Products
- 12.1.9.3. Company Financials
- 12.1.9.4. SWOT Analysis
- 12.1.10 XPO Logistics Inc
- 12.1.10.1. Company Overview
- 12.1.10.2. Products
- 12.1.10.3. Company Financials
- 12.1.10.4. SWOT Analysis
- 12.1.11 KUEHNE + NAGEL International AG
- 12.1.11.1. Company Overview
- 12.1.11.2. Products
- 12.1.11.3. Company Financials
- 12.1.11.4. SWOT Analysis
- 12.1.12 DSV
- 12.1.12.1. Company Overview
- 12.1.12.2. Products
- 12.1.12.3. Company Financials
- 12.1.12.4. SWOT Analysis
- 12.1.13 Ryder System Inc
- 12.1.13.1. Company Overview
- 12.1.13.2. Products
- 12.1.13.3. Company Financials
- 12.1.13.4. SWOT Analysis
- 12.1.1 DB Schenker
- 12.2. Market Entropy
- 12.2.1 Company's Key Areas Served
- 12.2.2 Recent Developments
- 12.3. Company Market Share Analysis 2025
- 12.3.1 Top 5 Companies Market Share Analysis
- 12.3.2 Top 3 Companies Market Share Analysis
- 12.4. List of Potential Customers
- 13. Research Methodology
List of Figures
- Figure 1: Global APAC Auto Logistics Industry Revenue Breakdown (Million, %) by Region 2025 & 2033
- Figure 2: North America APAC Auto Logistics Industry Revenue (Million), by Service 2025 & 2033
- Figure 3: North America APAC Auto Logistics Industry Revenue Share (%), by Service 2025 & 2033
- Figure 4: North America APAC Auto Logistics Industry Revenue (Million), by Type 2025 & 2033
- Figure 5: North America APAC Auto Logistics Industry Revenue Share (%), by Type 2025 & 2033
- Figure 6: North America APAC Auto Logistics Industry Revenue (Million), by Country 2025 & 2033
- Figure 7: North America APAC Auto Logistics Industry Revenue Share (%), by Country 2025 & 2033
- Figure 8: South America APAC Auto Logistics Industry Revenue (Million), by Service 2025 & 2033
- Figure 9: South America APAC Auto Logistics Industry Revenue Share (%), by Service 2025 & 2033
- Figure 10: South America APAC Auto Logistics Industry Revenue (Million), by Type 2025 & 2033
- Figure 11: South America APAC Auto Logistics Industry Revenue Share (%), by Type 2025 & 2033
- Figure 12: South America APAC Auto Logistics Industry Revenue (Million), by Country 2025 & 2033
- Figure 13: South America APAC Auto Logistics Industry Revenue Share (%), by Country 2025 & 2033
- Figure 14: Europe APAC Auto Logistics Industry Revenue (Million), by Service 2025 & 2033
- Figure 15: Europe APAC Auto Logistics Industry Revenue Share (%), by Service 2025 & 2033
- Figure 16: Europe APAC Auto Logistics Industry Revenue (Million), by Type 2025 & 2033
- Figure 17: Europe APAC Auto Logistics Industry Revenue Share (%), by Type 2025 & 2033
- Figure 18: Europe APAC Auto Logistics Industry Revenue (Million), by Country 2025 & 2033
- Figure 19: Europe APAC Auto Logistics Industry Revenue Share (%), by Country 2025 & 2033
- Figure 20: Middle East & Africa APAC Auto Logistics Industry Revenue (Million), by Service 2025 & 2033
- Figure 21: Middle East & Africa APAC Auto Logistics Industry Revenue Share (%), by Service 2025 & 2033
- Figure 22: Middle East & Africa APAC Auto Logistics Industry Revenue (Million), by Type 2025 & 2033
- Figure 23: Middle East & Africa APAC Auto Logistics Industry Revenue Share (%), by Type 2025 & 2033
- Figure 24: Middle East & Africa APAC Auto Logistics Industry Revenue (Million), by Country 2025 & 2033
- Figure 25: Middle East & Africa APAC Auto Logistics Industry Revenue Share (%), by Country 2025 & 2033
- Figure 26: Asia Pacific APAC Auto Logistics Industry Revenue (Million), by Service 2025 & 2033
- Figure 27: Asia Pacific APAC Auto Logistics Industry Revenue Share (%), by Service 2025 & 2033
- Figure 28: Asia Pacific APAC Auto Logistics Industry Revenue (Million), by Type 2025 & 2033
- Figure 29: Asia Pacific APAC Auto Logistics Industry Revenue Share (%), by Type 2025 & 2033
- Figure 30: Asia Pacific APAC Auto Logistics Industry Revenue (Million), by Country 2025 & 2033
- Figure 31: Asia Pacific APAC Auto Logistics Industry Revenue Share (%), by Country 2025 & 2033
List of Tables
- Table 1: Global APAC Auto Logistics Industry Revenue Million Forecast, by Service 2020 & 2033
- Table 2: Global APAC Auto Logistics Industry Revenue Million Forecast, by Type 2020 & 2033
- Table 3: Global APAC Auto Logistics Industry Revenue Million Forecast, by Region 2020 & 2033
- Table 4: Global APAC Auto Logistics Industry Revenue Million Forecast, by Service 2020 & 2033
- Table 5: Global APAC Auto Logistics Industry Revenue Million Forecast, by Type 2020 & 2033
- Table 6: Global APAC Auto Logistics Industry Revenue Million Forecast, by Country 2020 & 2033
- Table 7: United States APAC Auto Logistics Industry Revenue (Million) Forecast, by Application 2020 & 2033
- Table 8: Canada APAC Auto Logistics Industry Revenue (Million) Forecast, by Application 2020 & 2033
- Table 9: Mexico APAC Auto Logistics Industry Revenue (Million) Forecast, by Application 2020 & 2033
- Table 10: Global APAC Auto Logistics Industry Revenue Million Forecast, by Service 2020 & 2033
- Table 11: Global APAC Auto Logistics Industry Revenue Million Forecast, by Type 2020 & 2033
- Table 12: Global APAC Auto Logistics Industry Revenue Million Forecast, by Country 2020 & 2033
- Table 13: Brazil APAC Auto Logistics Industry Revenue (Million) Forecast, by Application 2020 & 2033
- Table 14: Argentina APAC Auto Logistics Industry Revenue (Million) Forecast, by Application 2020 & 2033
- Table 15: Rest of South America APAC Auto Logistics Industry Revenue (Million) Forecast, by Application 2020 & 2033
- Table 16: Global APAC Auto Logistics Industry Revenue Million Forecast, by Service 2020 & 2033
- Table 17: Global APAC Auto Logistics Industry Revenue Million Forecast, by Type 2020 & 2033
- Table 18: Global APAC Auto Logistics Industry Revenue Million Forecast, by Country 2020 & 2033
- Table 19: United Kingdom APAC Auto Logistics Industry Revenue (Million) Forecast, by Application 2020 & 2033
- Table 20: Germany APAC Auto Logistics Industry Revenue (Million) Forecast, by Application 2020 & 2033
- Table 21: France APAC Auto Logistics Industry Revenue (Million) Forecast, by Application 2020 & 2033
- Table 22: Italy APAC Auto Logistics Industry Revenue (Million) Forecast, by Application 2020 & 2033
- Table 23: Spain APAC Auto Logistics Industry Revenue (Million) Forecast, by Application 2020 & 2033
- Table 24: Russia APAC Auto Logistics Industry Revenue (Million) Forecast, by Application 2020 & 2033
- Table 25: Benelux APAC Auto Logistics Industry Revenue (Million) Forecast, by Application 2020 & 2033
- Table 26: Nordics APAC Auto Logistics Industry Revenue (Million) Forecast, by Application 2020 & 2033
- Table 27: Rest of Europe APAC Auto Logistics Industry Revenue (Million) Forecast, by Application 2020 & 2033
- Table 28: Global APAC Auto Logistics Industry Revenue Million Forecast, by Service 2020 & 2033
- Table 29: Global APAC Auto Logistics Industry Revenue Million Forecast, by Type 2020 & 2033
- Table 30: Global APAC Auto Logistics Industry Revenue Million Forecast, by Country 2020 & 2033
- Table 31: Turkey APAC Auto Logistics Industry Revenue (Million) Forecast, by Application 2020 & 2033
- Table 32: Israel APAC Auto Logistics Industry Revenue (Million) Forecast, by Application 2020 & 2033
- Table 33: GCC APAC Auto Logistics Industry Revenue (Million) Forecast, by Application 2020 & 2033
- Table 34: North Africa APAC Auto Logistics Industry Revenue (Million) Forecast, by Application 2020 & 2033
- Table 35: South Africa APAC Auto Logistics Industry Revenue (Million) Forecast, by Application 2020 & 2033
- Table 36: Rest of Middle East & Africa APAC Auto Logistics Industry Revenue (Million) Forecast, by Application 2020 & 2033
- Table 37: Global APAC Auto Logistics Industry Revenue Million Forecast, by Service 2020 & 2033
- Table 38: Global APAC Auto Logistics Industry Revenue Million Forecast, by Type 2020 & 2033
- Table 39: Global APAC Auto Logistics Industry Revenue Million Forecast, by Country 2020 & 2033
- Table 40: China APAC Auto Logistics Industry Revenue (Million) Forecast, by Application 2020 & 2033
- Table 41: India APAC Auto Logistics Industry Revenue (Million) Forecast, by Application 2020 & 2033
- Table 42: Japan APAC Auto Logistics Industry Revenue (Million) Forecast, by Application 2020 & 2033
- Table 43: South Korea APAC Auto Logistics Industry Revenue (Million) Forecast, by Application 2020 & 2033
- Table 44: ASEAN APAC Auto Logistics Industry Revenue (Million) Forecast, by Application 2020 & 2033
- Table 45: Oceania APAC Auto Logistics Industry Revenue (Million) Forecast, by Application 2020 & 2033
- Table 46: Rest of Asia Pacific APAC Auto Logistics Industry Revenue (Million) Forecast, by Application 2020 & 2033
Frequently Asked Questions
1. What is the projected Compound Annual Growth Rate (CAGR) of the APAC Auto Logistics Industry?
The projected CAGR is approximately > 6.50%.
2. Which companies are prominent players in the APAC Auto Logistics Industry?
Key companies in the market include DB Schenker, Hitachi Transport System Ltd, CEVA Logistics AG, Neovia Logistics Services LLC, DHL, Yusen Logistics Co Ltd, GEODIS, Nippon Express Co Ltd, United Parcel Service Inc**List Not Exhaustive, XPO Logistics Inc, KUEHNE + NAGEL International AG, DSV, Ryder System Inc.
3. What are the main segments of the APAC Auto Logistics Industry?
The market segments include Service, Type.
4. Can you provide details about the market size?
The market size is estimated to be USD 289.04 Million as of 2022.
5. What are some drivers contributing to market growth?
Rising Number of Partnerships among Automobile Manufacturers and Logistics Partners; Growth in international trade.
6. What are the notable trends driving market growth?
Demand for Electric Vehicles are increasing in the region.
7. Are there any restraints impacting market growth?
Nature of Supply Chain Business.
8. Can you provide examples of recent developments in the market?
March 2023: Tata Motors, One of India’s leading automobile manufacturers and the pioneer of India’s EV evolution, received an order for providing 1000 XPRES-T EVs to OHM E Logistics Pvt. Ltd. in Hyderabad for their electric cab transportation services. These cars will be delivered to OHM E Logistics in a phased manner.
9. What pricing options are available for accessing the report?
Pricing options include single-user, multi-user, and enterprise licenses priced at USD 4750, USD 4950, and USD 6800 respectively.
10. Is the market size provided in terms of value or volume?
The market size is provided in terms of value, measured in Million.
11. Are there any specific market keywords associated with the report?
Yes, the market keyword associated with the report is "APAC Auto Logistics Industry," which aids in identifying and referencing the specific market segment covered.
12. How do I determine which pricing option suits my needs best?
The pricing options vary based on user requirements and access needs. Individual users may opt for single-user licenses, while businesses requiring broader access may choose multi-user or enterprise licenses for cost-effective access to the report.
13. Are there any additional resources or data provided in the APAC Auto Logistics Industry report?
While the report offers comprehensive insights, it's advisable to review the specific contents or supplementary materials provided to ascertain if additional resources or data are available.
14. How can I stay updated on further developments or reports in the APAC Auto Logistics Industry?
To stay informed about further developments, trends, and reports in the APAC Auto Logistics Industry, consider subscribing to industry newsletters, following relevant companies and organizations, or regularly checking reputable industry news sources and publications.
Methodology
Step 1 - Identification of Relevant Samples Size from Population Database


Step 2 - Approaches for Defining Global Market Size (Value, Volume* & Price*)

Note*: In applicable scenarios
Step 3 - Data Sources
Primary Research
- Web Analytics
- Survey Reports
- Research Institute
- Latest Research Reports
- Opinion Leaders
Secondary Research
- Annual Reports
- White Paper
- Latest Press Release
- Industry Association
- Paid Database
- Investor Presentations

Step 4 - Data Triangulation
Involves using different sources of information in order to increase the validity of a study
These sources are likely to be stakeholders in a program - participants, other researchers, program staff, other community members, and so on.
Then we put all data in single framework & apply various statistical tools to find out the dynamic on the market.
During the analysis stage, feedback from the stakeholder groups would be compared to determine areas of agreement as well as areas of divergence