

Key Insights
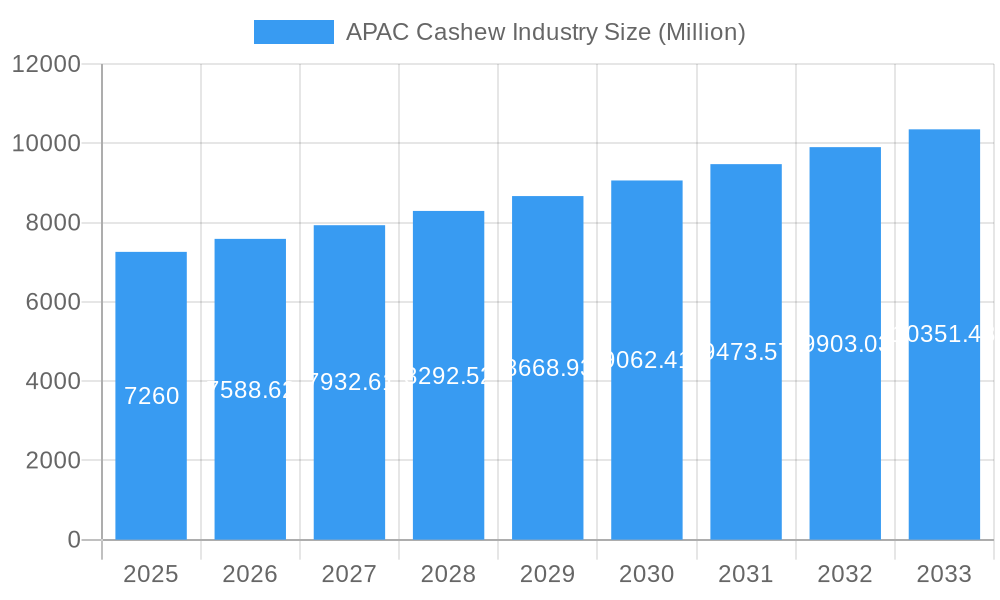
The Asia-Pacific (APAC) cashew industry presents a robust market opportunity, projected to reach a value of $7.26 billion in 2025 and exhibiting a Compound Annual Growth Rate (CAGR) of 4.44% from 2025 to 2033. This growth is fueled by several key drivers. Rising disposable incomes across the region, particularly in developing economies like India and China, are boosting consumer demand for premium snacks and confectionery products, including cashews. The increasing health consciousness among consumers is also driving demand for cashews, recognized for their nutritional value and inclusion in nutraceutical products. Furthermore, the growing popularity of online retail channels expands market accessibility and facilitates sales growth. Processed cashew nuts, catering to convenience and diverse culinary applications, significantly contribute to the overall market size. Within the APAC region, countries such as India and Vietnam, known for their significant cashew production and processing capabilities, are major market players. However, challenges such as fluctuating raw material prices and supply chain vulnerabilities due to climate change and geopolitical factors may act as restraints to growth. The industry is also witnessing increasing competition, pushing companies to focus on innovation, branding, and value-added products to maintain their market share. Strategic partnerships and acquisitions are anticipated as key strategies to expand market reach and bolster overall competitiveness.
APAC Cashew Industry Market Size (In Billion)
The segmentation of the APAC cashew market further reveals growth opportunities across various channels and applications. The food industry remains the largest application segment, followed by the confectionery and nutraceutical industries. Retail channels dominate distribution, though online sales are experiencing a rapid expansion, driven by e-commerce penetration and changing consumer behavior. Key players like Olam International and Sime Darby Oils are strategically positioned to benefit from these trends. However, the industry needs to address sustainability concerns related to cashew production and processing, emphasizing ethical sourcing and environmentally responsible practices to ensure long-term viability and consumer trust. Competition within this market is fierce, particularly among large-scale processors and exporters. The ability to offer competitive pricing while maintaining quality and ensuring consistent supply will be critical for success in the coming years.
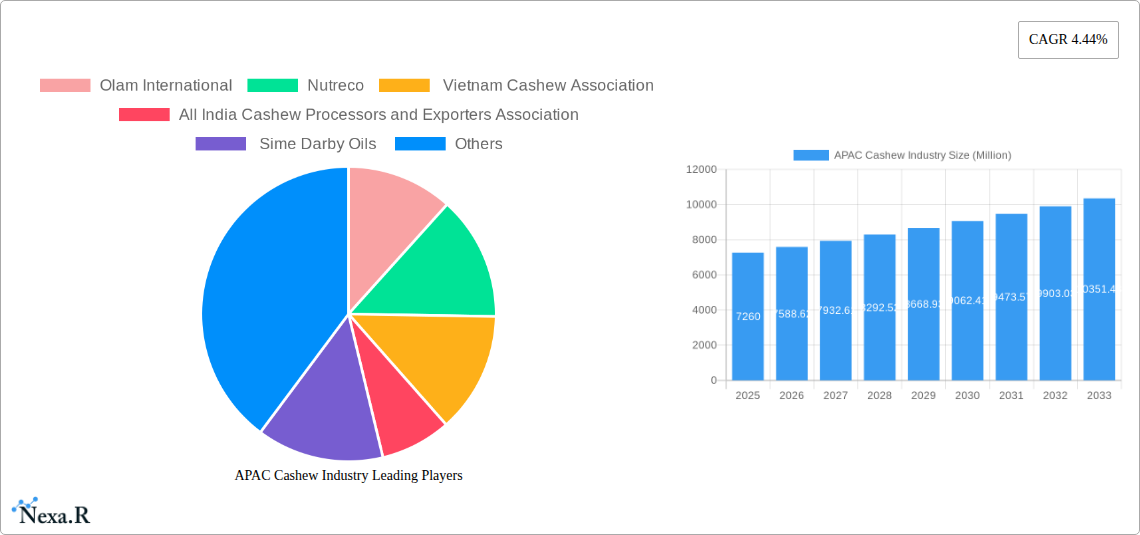
APAC Cashew Industry Company Market Share
APAC Cashew Industry Market Report: 2019-2033
This comprehensive report provides an in-depth analysis of the Asia-Pacific (APAC) cashew industry, covering market dynamics, growth trends, dominant segments, and key players. With a study period spanning 2019-2033, a base year of 2025, and a forecast period of 2025-2033, this report is an invaluable resource for industry professionals, investors, and strategic decision-makers. The report utilizes data from the historical period of 2019-2024 to provide robust insights and predictions. Market values are presented in million units.
APAC Cashew Industry Market Dynamics & Structure
The APAC cashew market exhibits a moderately concentrated structure, with key players like Olam International, Nutreco, and Sime Darby Oils holding significant market share. Technological innovation, particularly in processing and automation, is a key driver, while regulatory frameworks concerning food safety and labeling influence market practices. Substitute products like other nuts and seeds exert competitive pressure. End-user demographics, primarily driven by growing middle classes with increasing disposable incomes and health-conscious consumers, are shaping demand. M&A activity has been moderate, with a predicted xx deals in the last five years, primarily focusing on enhancing supply chain integration and geographical expansion.
- Market Concentration: Moderately concentrated, with top 3 players holding xx% market share (2024).
- Technological Innovation: Automation in processing, improved quality control methods.
- Regulatory Frameworks: Food safety standards, labeling regulations, and import/export policies.
- Substitute Products: Almonds, macadamia nuts, peanuts, and sunflower seeds.
- End-User Demographics: Growing middle class, health-conscious consumers, increasing demand for processed cashew products.
- M&A Trends: xx deals in the past 5 years, focusing on vertical integration and market expansion.
APAC Cashew Industry Growth Trends & Insights
The APAC cashew market has witnessed robust growth over the past few years, driven by rising demand from the food, confectionery, and nutraceutical industries. The market size expanded from xx million units in 2019 to xx million units in 2024, demonstrating a CAGR of xx%. This growth is fueled by increasing consumer preference for healthy snacks, the rising popularity of cashew-based products, and expanding distribution channels. Technological disruptions, such as improved processing techniques and efficient supply chain management, have further contributed to market growth. Consumer behavior is shifting towards premium, sustainably sourced cashew products. Market penetration, especially in online retail channels, is increasing steadily, creating new growth opportunities.
Dominant Regions, Countries, or Segments in APAC Cashew Industry
India and Vietnam are the dominant cashew-producing and processing countries in APAC, commanding xx% and xx% of the regional market share respectively (2024). The processed cashew nuts segment dominates the market by volume (xx million units in 2024), owing to increasing demand from the food and confectionery industries. The food industry is the largest application segment, consuming xx% of total cashew production (2024). Retail remains the primary distribution channel (xx% market share in 2024), although online sales are growing rapidly.
- Key Drivers in India: Government initiatives like MIDH and RKVY supporting cashew cultivation, robust processing infrastructure.
- Key Drivers in Vietnam: Favorable climatic conditions, efficient processing facilities, export-oriented policies.
- Processed Cashew Nuts Segment: High consumer demand for convenience and ready-to-eat products.
- Food Industry Application: Cashews used extensively in various food products (e.g., snacks, desserts).
- Retail Distribution: Wide availability and established supply chains across APAC.
APAC Cashew Industry Product Landscape
The APAC cashew market offers a diverse product range including raw cashew nuts, roasted cashew nuts, salted cashew nuts, and cashew-based value-added products. Product innovations focus on flavor variations, organic options, and convenient packaging formats. Technological advancements in processing enhance product quality, shelf life, and consistency, creating unique selling propositions for manufacturers.
Key Drivers, Barriers & Challenges in APAC Cashew Industry
Key Drivers: Rising disposable incomes, health consciousness, increasing demand for healthy snacks, and government support for cashew cultivation (e.g., MIDH and RKVY in India).
Challenges: Fluctuations in raw cashew prices, competition from substitute products, and supply chain disruptions, including issues of labor costs and climate change impacts on yields which could impact the total yield by xx% in the next five years.
Emerging Opportunities in APAC Cashew Industry
Untapped markets in Southeast Asia present significant growth opportunities. The burgeoning nutraceutical industry offers potential for cashew-based functional foods and supplements. Innovation in product development, such as creating cashew milk alternatives and protein bars, presents further opportunities. Evolving consumer preferences for sustainability and ethical sourcing drive demand for certified products.
Growth Accelerators in the APAC Cashew Industry Industry
Technological advancements in processing and automation are key growth accelerators. Strategic partnerships between processors, retailers, and ingredient suppliers optimize supply chains. Market expansion into new regions and product diversification further fuel industry growth.
Key Players Shaping the APAC Cashew Industry Market
- Olam International
- Nutreco
- Vietnam Cashew Association
- All India Cashew Processors and Exporters Association
- Sime Darby Oils
Notable Milestones in APAC Cashew Industry Sector
- January 2023: Indian cashew processing industry revenue exceeds USD 300,000 million, a 15% year-on-year increase.
- July 2022: DAC&FW initiatives lead to increased domestic cashew production in India, with plans to expand cultivation by 1.20 lakh hectares.
- February 2021: Bangladesh focuses on increasing cashew cultivation area through variety development and processing mill investments.
In-Depth APAC Cashew Industry Market Outlook
The APAC cashew industry is poised for continued growth, driven by robust consumer demand and supportive government policies. Strategic investments in technology, sustainable practices, and market expansion will shape the future landscape. Opportunities exist for companies to capitalize on emerging trends and untapped markets across the region. This will result in an overall market size of xx million units by 2033.
APAC Cashew Industry Segmentation
- 1. Production Analysis
- 2. Consumption Analysis
- 3. Import Market Analysis (Value & Volume)
- 4. Export Market Analysis (Value & Volume)
- 5. Price Trend Analysis
APAC Cashew Industry Segmentation By Geography
- 1. China
- 2. Vietnam
- 3. India
- 4. Indonesia
- 5. Sri Lanka
- 6. Japan
- 7. Philippines
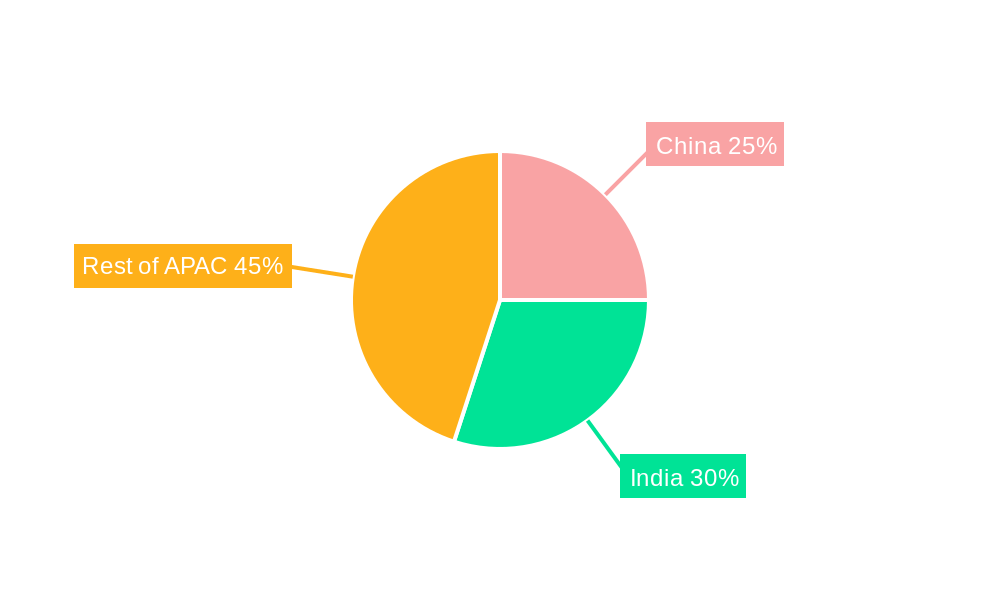
APAC Cashew Industry Regional Market Share
Geographic Coverage of APAC Cashew Industry
APAC Cashew Industry REPORT HIGHLIGHTS
| Aspects | Details |
|---|---|
| Study Period | 2020-2034 |
| Base Year | 2025 |
| Estimated Year | 2026 |
| Forecast Period | 2026-2034 |
| Historical Period | 2020-2025 |
| Growth Rate | CAGR of 4.44% from 2020-2034 |
| Segmentation |
|
Table of Contents
- 1. Introduction
- 1.1. Research Scope
- 1.2. Market Segmentation
- 1.3. Research Methodology
- 1.4. Definitions and Assumptions
- 2. Executive Summary
- 2.1. Introduction
- 3. Market Dynamics
- 3.1. Introduction
- 3.2. Market Drivers
- 3.2.1. Rising Consumption of Cashew Nuts as a Healthy Snack; Increasing Government initiatives; Growing Cashew Nut Imports in The United States
- 3.3. Market Restrains
- 3.3.1. Hazardous Climatic Condition Hinders Cashew Production; Stringent Regulations Related To Food Quality Standards
- 3.4. Market Trends
- 3.4.1. Increased Cashew Application in Food Industry to boost the Market
- 4. Market Factor Analysis
- 4.1. Porters Five Forces
- 4.2. Supply/Value Chain
- 4.3. PESTEL analysis
- 4.4. Market Entropy
- 4.5. Patent/Trademark Analysis
- 5. Global APAC Cashew Industry Analysis, Insights and Forecast, 2020-2032
- 5.1. Market Analysis, Insights and Forecast - by Production Analysis
- 5.2. Market Analysis, Insights and Forecast - by Consumption Analysis
- 5.3. Market Analysis, Insights and Forecast - by Import Market Analysis (Value & Volume)
- 5.4. Market Analysis, Insights and Forecast - by Export Market Analysis (Value & Volume)
- 5.5. Market Analysis, Insights and Forecast - by Price Trend Analysis
- 5.6. Market Analysis, Insights and Forecast - by Region
- 5.6.1. China
- 5.6.2. Vietnam
- 5.6.3. India
- 5.6.4. Indonesia
- 5.6.5. Sri Lanka
- 5.6.6. Japan
- 5.6.7. Philippines
- 5.1. Market Analysis, Insights and Forecast - by Production Analysis
- 6. China APAC Cashew Industry Analysis, Insights and Forecast, 2020-2032
- 6.1. Market Analysis, Insights and Forecast - by Production Analysis
- 6.2. Market Analysis, Insights and Forecast - by Consumption Analysis
- 6.3. Market Analysis, Insights and Forecast - by Import Market Analysis (Value & Volume)
- 6.4. Market Analysis, Insights and Forecast - by Export Market Analysis (Value & Volume)
- 6.5. Market Analysis, Insights and Forecast - by Price Trend Analysis
- 6.1. Market Analysis, Insights and Forecast - by Production Analysis
- 7. Vietnam APAC Cashew Industry Analysis, Insights and Forecast, 2020-2032
- 7.1. Market Analysis, Insights and Forecast - by Production Analysis
- 7.2. Market Analysis, Insights and Forecast - by Consumption Analysis
- 7.3. Market Analysis, Insights and Forecast - by Import Market Analysis (Value & Volume)
- 7.4. Market Analysis, Insights and Forecast - by Export Market Analysis (Value & Volume)
- 7.5. Market Analysis, Insights and Forecast - by Price Trend Analysis
- 7.1. Market Analysis, Insights and Forecast - by Production Analysis
- 8. India APAC Cashew Industry Analysis, Insights and Forecast, 2020-2032
- 8.1. Market Analysis, Insights and Forecast - by Production Analysis
- 8.2. Market Analysis, Insights and Forecast - by Consumption Analysis
- 8.3. Market Analysis, Insights and Forecast - by Import Market Analysis (Value & Volume)
- 8.4. Market Analysis, Insights and Forecast - by Export Market Analysis (Value & Volume)
- 8.5. Market Analysis, Insights and Forecast - by Price Trend Analysis
- 8.1. Market Analysis, Insights and Forecast - by Production Analysis
- 9. Indonesia APAC Cashew Industry Analysis, Insights and Forecast, 2020-2032
- 9.1. Market Analysis, Insights and Forecast - by Production Analysis
- 9.2. Market Analysis, Insights and Forecast - by Consumption Analysis
- 9.3. Market Analysis, Insights and Forecast - by Import Market Analysis (Value & Volume)
- 9.4. Market Analysis, Insights and Forecast - by Export Market Analysis (Value & Volume)
- 9.5. Market Analysis, Insights and Forecast - by Price Trend Analysis
- 9.1. Market Analysis, Insights and Forecast - by Production Analysis
- 10. Sri Lanka APAC Cashew Industry Analysis, Insights and Forecast, 2020-2032
- 10.1. Market Analysis, Insights and Forecast - by Production Analysis
- 10.2. Market Analysis, Insights and Forecast - by Consumption Analysis
- 10.3. Market Analysis, Insights and Forecast - by Import Market Analysis (Value & Volume)
- 10.4. Market Analysis, Insights and Forecast - by Export Market Analysis (Value & Volume)
- 10.5. Market Analysis, Insights and Forecast - by Price Trend Analysis
- 10.1. Market Analysis, Insights and Forecast - by Production Analysis
- 11. Japan APAC Cashew Industry Analysis, Insights and Forecast, 2020-2032
- 11.1. Market Analysis, Insights and Forecast - by Production Analysis
- 11.2. Market Analysis, Insights and Forecast - by Consumption Analysis
- 11.3. Market Analysis, Insights and Forecast - by Import Market Analysis (Value & Volume)
- 11.4. Market Analysis, Insights and Forecast - by Export Market Analysis (Value & Volume)
- 11.5. Market Analysis, Insights and Forecast - by Price Trend Analysis
- 11.1. Market Analysis, Insights and Forecast - by Production Analysis
- 12. Philippines APAC Cashew Industry Analysis, Insights and Forecast, 2020-2032
- 12.1. Market Analysis, Insights and Forecast - by Production Analysis
- 12.2. Market Analysis, Insights and Forecast - by Consumption Analysis
- 12.3. Market Analysis, Insights and Forecast - by Import Market Analysis (Value & Volume)
- 12.4. Market Analysis, Insights and Forecast - by Export Market Analysis (Value & Volume)
- 12.5. Market Analysis, Insights and Forecast - by Price Trend Analysis
- 12.1. Market Analysis, Insights and Forecast - by Production Analysis
- 13. Competitive Analysis
- 13.1. Global Market Share Analysis 2025
- 13.2. Company Profiles
- 13.2.1 Olam International
- 13.2.1.1. Overview
- 13.2.1.2. Products
- 13.2.1.3. SWOT Analysis
- 13.2.1.4. Recent Developments
- 13.2.1.5. Financials (Based on Availability)
- 13.2.2 Nutreco
- 13.2.2.1. Overview
- 13.2.2.2. Products
- 13.2.2.3. SWOT Analysis
- 13.2.2.4. Recent Developments
- 13.2.2.5. Financials (Based on Availability)
- 13.2.3 Vietnam Cashew Association
- 13.2.3.1. Overview
- 13.2.3.2. Products
- 13.2.3.3. SWOT Analysis
- 13.2.3.4. Recent Developments
- 13.2.3.5. Financials (Based on Availability)
- 13.2.4 All India Cashew Processors and Exporters Association
- 13.2.4.1. Overview
- 13.2.4.2. Products
- 13.2.4.3. SWOT Analysis
- 13.2.4.4. Recent Developments
- 13.2.4.5. Financials (Based on Availability)
- 13.2.5 Sime Darby Oils
- 13.2.5.1. Overview
- 13.2.5.2. Products
- 13.2.5.3. SWOT Analysis
- 13.2.5.4. Recent Developments
- 13.2.5.5. Financials (Based on Availability)
- 13.2.1 Olam International
List of Figures
- Figure 1: Global APAC Cashew Industry Revenue Breakdown (Million, %) by Region 2025 & 2033
- Figure 2: Global APAC Cashew Industry Volume Breakdown (Kiloton, %) by Region 2025 & 2033
- Figure 3: China APAC Cashew Industry Revenue (Million), by Production Analysis 2025 & 2033
- Figure 4: China APAC Cashew Industry Volume (Kiloton), by Production Analysis 2025 & 2033
- Figure 5: China APAC Cashew Industry Revenue Share (%), by Production Analysis 2025 & 2033
- Figure 6: China APAC Cashew Industry Volume Share (%), by Production Analysis 2025 & 2033
- Figure 7: China APAC Cashew Industry Revenue (Million), by Consumption Analysis 2025 & 2033
- Figure 8: China APAC Cashew Industry Volume (Kiloton), by Consumption Analysis 2025 & 2033
- Figure 9: China APAC Cashew Industry Revenue Share (%), by Consumption Analysis 2025 & 2033
- Figure 10: China APAC Cashew Industry Volume Share (%), by Consumption Analysis 2025 & 2033
- Figure 11: China APAC Cashew Industry Revenue (Million), by Import Market Analysis (Value & Volume) 2025 & 2033
- Figure 12: China APAC Cashew Industry Volume (Kiloton), by Import Market Analysis (Value & Volume) 2025 & 2033
- Figure 13: China APAC Cashew Industry Revenue Share (%), by Import Market Analysis (Value & Volume) 2025 & 2033
- Figure 14: China APAC Cashew Industry Volume Share (%), by Import Market Analysis (Value & Volume) 2025 & 2033
- Figure 15: China APAC Cashew Industry Revenue (Million), by Export Market Analysis (Value & Volume) 2025 & 2033
- Figure 16: China APAC Cashew Industry Volume (Kiloton), by Export Market Analysis (Value & Volume) 2025 & 2033
- Figure 17: China APAC Cashew Industry Revenue Share (%), by Export Market Analysis (Value & Volume) 2025 & 2033
- Figure 18: China APAC Cashew Industry Volume Share (%), by Export Market Analysis (Value & Volume) 2025 & 2033
- Figure 19: China APAC Cashew Industry Revenue (Million), by Price Trend Analysis 2025 & 2033
- Figure 20: China APAC Cashew Industry Volume (Kiloton), by Price Trend Analysis 2025 & 2033
- Figure 21: China APAC Cashew Industry Revenue Share (%), by Price Trend Analysis 2025 & 2033
- Figure 22: China APAC Cashew Industry Volume Share (%), by Price Trend Analysis 2025 & 2033
- Figure 23: China APAC Cashew Industry Revenue (Million), by Country 2025 & 2033
- Figure 24: China APAC Cashew Industry Volume (Kiloton), by Country 2025 & 2033
- Figure 25: China APAC Cashew Industry Revenue Share (%), by Country 2025 & 2033
- Figure 26: China APAC Cashew Industry Volume Share (%), by Country 2025 & 2033
- Figure 27: Vietnam APAC Cashew Industry Revenue (Million), by Production Analysis 2025 & 2033
- Figure 28: Vietnam APAC Cashew Industry Volume (Kiloton), by Production Analysis 2025 & 2033
- Figure 29: Vietnam APAC Cashew Industry Revenue Share (%), by Production Analysis 2025 & 2033
- Figure 30: Vietnam APAC Cashew Industry Volume Share (%), by Production Analysis 2025 & 2033
- Figure 31: Vietnam APAC Cashew Industry Revenue (Million), by Consumption Analysis 2025 & 2033
- Figure 32: Vietnam APAC Cashew Industry Volume (Kiloton), by Consumption Analysis 2025 & 2033
- Figure 33: Vietnam APAC Cashew Industry Revenue Share (%), by Consumption Analysis 2025 & 2033
- Figure 34: Vietnam APAC Cashew Industry Volume Share (%), by Consumption Analysis 2025 & 2033
- Figure 35: Vietnam APAC Cashew Industry Revenue (Million), by Import Market Analysis (Value & Volume) 2025 & 2033
- Figure 36: Vietnam APAC Cashew Industry Volume (Kiloton), by Import Market Analysis (Value & Volume) 2025 & 2033
- Figure 37: Vietnam APAC Cashew Industry Revenue Share (%), by Import Market Analysis (Value & Volume) 2025 & 2033
- Figure 38: Vietnam APAC Cashew Industry Volume Share (%), by Import Market Analysis (Value & Volume) 2025 & 2033
- Figure 39: Vietnam APAC Cashew Industry Revenue (Million), by Export Market Analysis (Value & Volume) 2025 & 2033
- Figure 40: Vietnam APAC Cashew Industry Volume (Kiloton), by Export Market Analysis (Value & Volume) 2025 & 2033
- Figure 41: Vietnam APAC Cashew Industry Revenue Share (%), by Export Market Analysis (Value & Volume) 2025 & 2033
- Figure 42: Vietnam APAC Cashew Industry Volume Share (%), by Export Market Analysis (Value & Volume) 2025 & 2033
- Figure 43: Vietnam APAC Cashew Industry Revenue (Million), by Price Trend Analysis 2025 & 2033
- Figure 44: Vietnam APAC Cashew Industry Volume (Kiloton), by Price Trend Analysis 2025 & 2033
- Figure 45: Vietnam APAC Cashew Industry Revenue Share (%), by Price Trend Analysis 2025 & 2033
- Figure 46: Vietnam APAC Cashew Industry Volume Share (%), by Price Trend Analysis 2025 & 2033
- Figure 47: Vietnam APAC Cashew Industry Revenue (Million), by Country 2025 & 2033
- Figure 48: Vietnam APAC Cashew Industry Volume (Kiloton), by Country 2025 & 2033
- Figure 49: Vietnam APAC Cashew Industry Revenue Share (%), by Country 2025 & 2033
- Figure 50: Vietnam APAC Cashew Industry Volume Share (%), by Country 2025 & 2033
- Figure 51: India APAC Cashew Industry Revenue (Million), by Production Analysis 2025 & 2033
- Figure 52: India APAC Cashew Industry Volume (Kiloton), by Production Analysis 2025 & 2033
- Figure 53: India APAC Cashew Industry Revenue Share (%), by Production Analysis 2025 & 2033
- Figure 54: India APAC Cashew Industry Volume Share (%), by Production Analysis 2025 & 2033
- Figure 55: India APAC Cashew Industry Revenue (Million), by Consumption Analysis 2025 & 2033
- Figure 56: India APAC Cashew Industry Volume (Kiloton), by Consumption Analysis 2025 & 2033
- Figure 57: India APAC Cashew Industry Revenue Share (%), by Consumption Analysis 2025 & 2033
- Figure 58: India APAC Cashew Industry Volume Share (%), by Consumption Analysis 2025 & 2033
- Figure 59: India APAC Cashew Industry Revenue (Million), by Import Market Analysis (Value & Volume) 2025 & 2033
- Figure 60: India APAC Cashew Industry Volume (Kiloton), by Import Market Analysis (Value & Volume) 2025 & 2033
- Figure 61: India APAC Cashew Industry Revenue Share (%), by Import Market Analysis (Value & Volume) 2025 & 2033
- Figure 62: India APAC Cashew Industry Volume Share (%), by Import Market Analysis (Value & Volume) 2025 & 2033
- Figure 63: India APAC Cashew Industry Revenue (Million), by Export Market Analysis (Value & Volume) 2025 & 2033
- Figure 64: India APAC Cashew Industry Volume (Kiloton), by Export Market Analysis (Value & Volume) 2025 & 2033
- Figure 65: India APAC Cashew Industry Revenue Share (%), by Export Market Analysis (Value & Volume) 2025 & 2033
- Figure 66: India APAC Cashew Industry Volume Share (%), by Export Market Analysis (Value & Volume) 2025 & 2033
- Figure 67: India APAC Cashew Industry Revenue (Million), by Price Trend Analysis 2025 & 2033
- Figure 68: India APAC Cashew Industry Volume (Kiloton), by Price Trend Analysis 2025 & 2033
- Figure 69: India APAC Cashew Industry Revenue Share (%), by Price Trend Analysis 2025 & 2033
- Figure 70: India APAC Cashew Industry Volume Share (%), by Price Trend Analysis 2025 & 2033
- Figure 71: India APAC Cashew Industry Revenue (Million), by Country 2025 & 2033
- Figure 72: India APAC Cashew Industry Volume (Kiloton), by Country 2025 & 2033
- Figure 73: India APAC Cashew Industry Revenue Share (%), by Country 2025 & 2033
- Figure 74: India APAC Cashew Industry Volume Share (%), by Country 2025 & 2033
- Figure 75: Indonesia APAC Cashew Industry Revenue (Million), by Production Analysis 2025 & 2033
- Figure 76: Indonesia APAC Cashew Industry Volume (Kiloton), by Production Analysis 2025 & 2033
- Figure 77: Indonesia APAC Cashew Industry Revenue Share (%), by Production Analysis 2025 & 2033
- Figure 78: Indonesia APAC Cashew Industry Volume Share (%), by Production Analysis 2025 & 2033
- Figure 79: Indonesia APAC Cashew Industry Revenue (Million), by Consumption Analysis 2025 & 2033
- Figure 80: Indonesia APAC Cashew Industry Volume (Kiloton), by Consumption Analysis 2025 & 2033
- Figure 81: Indonesia APAC Cashew Industry Revenue Share (%), by Consumption Analysis 2025 & 2033
- Figure 82: Indonesia APAC Cashew Industry Volume Share (%), by Consumption Analysis 2025 & 2033
- Figure 83: Indonesia APAC Cashew Industry Revenue (Million), by Import Market Analysis (Value & Volume) 2025 & 2033
- Figure 84: Indonesia APAC Cashew Industry Volume (Kiloton), by Import Market Analysis (Value & Volume) 2025 & 2033
- Figure 85: Indonesia APAC Cashew Industry Revenue Share (%), by Import Market Analysis (Value & Volume) 2025 & 2033
- Figure 86: Indonesia APAC Cashew Industry Volume Share (%), by Import Market Analysis (Value & Volume) 2025 & 2033
- Figure 87: Indonesia APAC Cashew Industry Revenue (Million), by Export Market Analysis (Value & Volume) 2025 & 2033
- Figure 88: Indonesia APAC Cashew Industry Volume (Kiloton), by Export Market Analysis (Value & Volume) 2025 & 2033
- Figure 89: Indonesia APAC Cashew Industry Revenue Share (%), by Export Market Analysis (Value & Volume) 2025 & 2033
- Figure 90: Indonesia APAC Cashew Industry Volume Share (%), by Export Market Analysis (Value & Volume) 2025 & 2033
- Figure 91: Indonesia APAC Cashew Industry Revenue (Million), by Price Trend Analysis 2025 & 2033
- Figure 92: Indonesia APAC Cashew Industry Volume (Kiloton), by Price Trend Analysis 2025 & 2033
- Figure 93: Indonesia APAC Cashew Industry Revenue Share (%), by Price Trend Analysis 2025 & 2033
- Figure 94: Indonesia APAC Cashew Industry Volume Share (%), by Price Trend Analysis 2025 & 2033
- Figure 95: Indonesia APAC Cashew Industry Revenue (Million), by Country 2025 & 2033
- Figure 96: Indonesia APAC Cashew Industry Volume (Kiloton), by Country 2025 & 2033
- Figure 97: Indonesia APAC Cashew Industry Revenue Share (%), by Country 2025 & 2033
- Figure 98: Indonesia APAC Cashew Industry Volume Share (%), by Country 2025 & 2033
- Figure 99: Sri Lanka APAC Cashew Industry Revenue (Million), by Production Analysis 2025 & 2033
- Figure 100: Sri Lanka APAC Cashew Industry Volume (Kiloton), by Production Analysis 2025 & 2033
- Figure 101: Sri Lanka APAC Cashew Industry Revenue Share (%), by Production Analysis 2025 & 2033
- Figure 102: Sri Lanka APAC Cashew Industry Volume Share (%), by Production Analysis 2025 & 2033
- Figure 103: Sri Lanka APAC Cashew Industry Revenue (Million), by Consumption Analysis 2025 & 2033
- Figure 104: Sri Lanka APAC Cashew Industry Volume (Kiloton), by Consumption Analysis 2025 & 2033
- Figure 105: Sri Lanka APAC Cashew Industry Revenue Share (%), by Consumption Analysis 2025 & 2033
- Figure 106: Sri Lanka APAC Cashew Industry Volume Share (%), by Consumption Analysis 2025 & 2033
- Figure 107: Sri Lanka APAC Cashew Industry Revenue (Million), by Import Market Analysis (Value & Volume) 2025 & 2033
- Figure 108: Sri Lanka APAC Cashew Industry Volume (Kiloton), by Import Market Analysis (Value & Volume) 2025 & 2033
- Figure 109: Sri Lanka APAC Cashew Industry Revenue Share (%), by Import Market Analysis (Value & Volume) 2025 & 2033
- Figure 110: Sri Lanka APAC Cashew Industry Volume Share (%), by Import Market Analysis (Value & Volume) 2025 & 2033
- Figure 111: Sri Lanka APAC Cashew Industry Revenue (Million), by Export Market Analysis (Value & Volume) 2025 & 2033
- Figure 112: Sri Lanka APAC Cashew Industry Volume (Kiloton), by Export Market Analysis (Value & Volume) 2025 & 2033
- Figure 113: Sri Lanka APAC Cashew Industry Revenue Share (%), by Export Market Analysis (Value & Volume) 2025 & 2033
- Figure 114: Sri Lanka APAC Cashew Industry Volume Share (%), by Export Market Analysis (Value & Volume) 2025 & 2033
- Figure 115: Sri Lanka APAC Cashew Industry Revenue (Million), by Price Trend Analysis 2025 & 2033
- Figure 116: Sri Lanka APAC Cashew Industry Volume (Kiloton), by Price Trend Analysis 2025 & 2033
- Figure 117: Sri Lanka APAC Cashew Industry Revenue Share (%), by Price Trend Analysis 2025 & 2033
- Figure 118: Sri Lanka APAC Cashew Industry Volume Share (%), by Price Trend Analysis 2025 & 2033
- Figure 119: Sri Lanka APAC Cashew Industry Revenue (Million), by Country 2025 & 2033
- Figure 120: Sri Lanka APAC Cashew Industry Volume (Kiloton), by Country 2025 & 2033
- Figure 121: Sri Lanka APAC Cashew Industry Revenue Share (%), by Country 2025 & 2033
- Figure 122: Sri Lanka APAC Cashew Industry Volume Share (%), by Country 2025 & 2033
- Figure 123: Japan APAC Cashew Industry Revenue (Million), by Production Analysis 2025 & 2033
- Figure 124: Japan APAC Cashew Industry Volume (Kiloton), by Production Analysis 2025 & 2033
- Figure 125: Japan APAC Cashew Industry Revenue Share (%), by Production Analysis 2025 & 2033
- Figure 126: Japan APAC Cashew Industry Volume Share (%), by Production Analysis 2025 & 2033
- Figure 127: Japan APAC Cashew Industry Revenue (Million), by Consumption Analysis 2025 & 2033
- Figure 128: Japan APAC Cashew Industry Volume (Kiloton), by Consumption Analysis 2025 & 2033
- Figure 129: Japan APAC Cashew Industry Revenue Share (%), by Consumption Analysis 2025 & 2033
- Figure 130: Japan APAC Cashew Industry Volume Share (%), by Consumption Analysis 2025 & 2033
- Figure 131: Japan APAC Cashew Industry Revenue (Million), by Import Market Analysis (Value & Volume) 2025 & 2033
- Figure 132: Japan APAC Cashew Industry Volume (Kiloton), by Import Market Analysis (Value & Volume) 2025 & 2033
- Figure 133: Japan APAC Cashew Industry Revenue Share (%), by Import Market Analysis (Value & Volume) 2025 & 2033
- Figure 134: Japan APAC Cashew Industry Volume Share (%), by Import Market Analysis (Value & Volume) 2025 & 2033
- Figure 135: Japan APAC Cashew Industry Revenue (Million), by Export Market Analysis (Value & Volume) 2025 & 2033
- Figure 136: Japan APAC Cashew Industry Volume (Kiloton), by Export Market Analysis (Value & Volume) 2025 & 2033
- Figure 137: Japan APAC Cashew Industry Revenue Share (%), by Export Market Analysis (Value & Volume) 2025 & 2033
- Figure 138: Japan APAC Cashew Industry Volume Share (%), by Export Market Analysis (Value & Volume) 2025 & 2033
- Figure 139: Japan APAC Cashew Industry Revenue (Million), by Price Trend Analysis 2025 & 2033
- Figure 140: Japan APAC Cashew Industry Volume (Kiloton), by Price Trend Analysis 2025 & 2033
- Figure 141: Japan APAC Cashew Industry Revenue Share (%), by Price Trend Analysis 2025 & 2033
- Figure 142: Japan APAC Cashew Industry Volume Share (%), by Price Trend Analysis 2025 & 2033
- Figure 143: Japan APAC Cashew Industry Revenue (Million), by Country 2025 & 2033
- Figure 144: Japan APAC Cashew Industry Volume (Kiloton), by Country 2025 & 2033
- Figure 145: Japan APAC Cashew Industry Revenue Share (%), by Country 2025 & 2033
- Figure 146: Japan APAC Cashew Industry Volume Share (%), by Country 2025 & 2033
- Figure 147: Philippines APAC Cashew Industry Revenue (Million), by Production Analysis 2025 & 2033
- Figure 148: Philippines APAC Cashew Industry Volume (Kiloton), by Production Analysis 2025 & 2033
- Figure 149: Philippines APAC Cashew Industry Revenue Share (%), by Production Analysis 2025 & 2033
- Figure 150: Philippines APAC Cashew Industry Volume Share (%), by Production Analysis 2025 & 2033
- Figure 151: Philippines APAC Cashew Industry Revenue (Million), by Consumption Analysis 2025 & 2033
- Figure 152: Philippines APAC Cashew Industry Volume (Kiloton), by Consumption Analysis 2025 & 2033
- Figure 153: Philippines APAC Cashew Industry Revenue Share (%), by Consumption Analysis 2025 & 2033
- Figure 154: Philippines APAC Cashew Industry Volume Share (%), by Consumption Analysis 2025 & 2033
- Figure 155: Philippines APAC Cashew Industry Revenue (Million), by Import Market Analysis (Value & Volume) 2025 & 2033
- Figure 156: Philippines APAC Cashew Industry Volume (Kiloton), by Import Market Analysis (Value & Volume) 2025 & 2033
- Figure 157: Philippines APAC Cashew Industry Revenue Share (%), by Import Market Analysis (Value & Volume) 2025 & 2033
- Figure 158: Philippines APAC Cashew Industry Volume Share (%), by Import Market Analysis (Value & Volume) 2025 & 2033
- Figure 159: Philippines APAC Cashew Industry Revenue (Million), by Export Market Analysis (Value & Volume) 2025 & 2033
- Figure 160: Philippines APAC Cashew Industry Volume (Kiloton), by Export Market Analysis (Value & Volume) 2025 & 2033
- Figure 161: Philippines APAC Cashew Industry Revenue Share (%), by Export Market Analysis (Value & Volume) 2025 & 2033
- Figure 162: Philippines APAC Cashew Industry Volume Share (%), by Export Market Analysis (Value & Volume) 2025 & 2033
- Figure 163: Philippines APAC Cashew Industry Revenue (Million), by Price Trend Analysis 2025 & 2033
- Figure 164: Philippines APAC Cashew Industry Volume (Kiloton), by Price Trend Analysis 2025 & 2033
- Figure 165: Philippines APAC Cashew Industry Revenue Share (%), by Price Trend Analysis 2025 & 2033
- Figure 166: Philippines APAC Cashew Industry Volume Share (%), by Price Trend Analysis 2025 & 2033
- Figure 167: Philippines APAC Cashew Industry Revenue (Million), by Country 2025 & 2033
- Figure 168: Philippines APAC Cashew Industry Volume (Kiloton), by Country 2025 & 2033
- Figure 169: Philippines APAC Cashew Industry Revenue Share (%), by Country 2025 & 2033
- Figure 170: Philippines APAC Cashew Industry Volume Share (%), by Country 2025 & 2033
List of Tables
- Table 1: Global APAC Cashew Industry Revenue Million Forecast, by Production Analysis 2020 & 2033
- Table 2: Global APAC Cashew Industry Volume Kiloton Forecast, by Production Analysis 2020 & 2033
- Table 3: Global APAC Cashew Industry Revenue Million Forecast, by Consumption Analysis 2020 & 2033
- Table 4: Global APAC Cashew Industry Volume Kiloton Forecast, by Consumption Analysis 2020 & 2033
- Table 5: Global APAC Cashew Industry Revenue Million Forecast, by Import Market Analysis (Value & Volume) 2020 & 2033
- Table 6: Global APAC Cashew Industry Volume Kiloton Forecast, by Import Market Analysis (Value & Volume) 2020 & 2033
- Table 7: Global APAC Cashew Industry Revenue Million Forecast, by Export Market Analysis (Value & Volume) 2020 & 2033
- Table 8: Global APAC Cashew Industry Volume Kiloton Forecast, by Export Market Analysis (Value & Volume) 2020 & 2033
- Table 9: Global APAC Cashew Industry Revenue Million Forecast, by Price Trend Analysis 2020 & 2033
- Table 10: Global APAC Cashew Industry Volume Kiloton Forecast, by Price Trend Analysis 2020 & 2033
- Table 11: Global APAC Cashew Industry Revenue Million Forecast, by Region 2020 & 2033
- Table 12: Global APAC Cashew Industry Volume Kiloton Forecast, by Region 2020 & 2033
- Table 13: Global APAC Cashew Industry Revenue Million Forecast, by Production Analysis 2020 & 2033
- Table 14: Global APAC Cashew Industry Volume Kiloton Forecast, by Production Analysis 2020 & 2033
- Table 15: Global APAC Cashew Industry Revenue Million Forecast, by Consumption Analysis 2020 & 2033
- Table 16: Global APAC Cashew Industry Volume Kiloton Forecast, by Consumption Analysis 2020 & 2033
- Table 17: Global APAC Cashew Industry Revenue Million Forecast, by Import Market Analysis (Value & Volume) 2020 & 2033
- Table 18: Global APAC Cashew Industry Volume Kiloton Forecast, by Import Market Analysis (Value & Volume) 2020 & 2033
- Table 19: Global APAC Cashew Industry Revenue Million Forecast, by Export Market Analysis (Value & Volume) 2020 & 2033
- Table 20: Global APAC Cashew Industry Volume Kiloton Forecast, by Export Market Analysis (Value & Volume) 2020 & 2033
- Table 21: Global APAC Cashew Industry Revenue Million Forecast, by Price Trend Analysis 2020 & 2033
- Table 22: Global APAC Cashew Industry Volume Kiloton Forecast, by Price Trend Analysis 2020 & 2033
- Table 23: Global APAC Cashew Industry Revenue Million Forecast, by Country 2020 & 2033
- Table 24: Global APAC Cashew Industry Volume Kiloton Forecast, by Country 2020 & 2033
- Table 25: Global APAC Cashew Industry Revenue Million Forecast, by Production Analysis 2020 & 2033
- Table 26: Global APAC Cashew Industry Volume Kiloton Forecast, by Production Analysis 2020 & 2033
- Table 27: Global APAC Cashew Industry Revenue Million Forecast, by Consumption Analysis 2020 & 2033
- Table 28: Global APAC Cashew Industry Volume Kiloton Forecast, by Consumption Analysis 2020 & 2033
- Table 29: Global APAC Cashew Industry Revenue Million Forecast, by Import Market Analysis (Value & Volume) 2020 & 2033
- Table 30: Global APAC Cashew Industry Volume Kiloton Forecast, by Import Market Analysis (Value & Volume) 2020 & 2033
- Table 31: Global APAC Cashew Industry Revenue Million Forecast, by Export Market Analysis (Value & Volume) 2020 & 2033
- Table 32: Global APAC Cashew Industry Volume Kiloton Forecast, by Export Market Analysis (Value & Volume) 2020 & 2033
- Table 33: Global APAC Cashew Industry Revenue Million Forecast, by Price Trend Analysis 2020 & 2033
- Table 34: Global APAC Cashew Industry Volume Kiloton Forecast, by Price Trend Analysis 2020 & 2033
- Table 35: Global APAC Cashew Industry Revenue Million Forecast, by Country 2020 & 2033
- Table 36: Global APAC Cashew Industry Volume Kiloton Forecast, by Country 2020 & 2033
- Table 37: Global APAC Cashew Industry Revenue Million Forecast, by Production Analysis 2020 & 2033
- Table 38: Global APAC Cashew Industry Volume Kiloton Forecast, by Production Analysis 2020 & 2033
- Table 39: Global APAC Cashew Industry Revenue Million Forecast, by Consumption Analysis 2020 & 2033
- Table 40: Global APAC Cashew Industry Volume Kiloton Forecast, by Consumption Analysis 2020 & 2033
- Table 41: Global APAC Cashew Industry Revenue Million Forecast, by Import Market Analysis (Value & Volume) 2020 & 2033
- Table 42: Global APAC Cashew Industry Volume Kiloton Forecast, by Import Market Analysis (Value & Volume) 2020 & 2033
- Table 43: Global APAC Cashew Industry Revenue Million Forecast, by Export Market Analysis (Value & Volume) 2020 & 2033
- Table 44: Global APAC Cashew Industry Volume Kiloton Forecast, by Export Market Analysis (Value & Volume) 2020 & 2033
- Table 45: Global APAC Cashew Industry Revenue Million Forecast, by Price Trend Analysis 2020 & 2033
- Table 46: Global APAC Cashew Industry Volume Kiloton Forecast, by Price Trend Analysis 2020 & 2033
- Table 47: Global APAC Cashew Industry Revenue Million Forecast, by Country 2020 & 2033
- Table 48: Global APAC Cashew Industry Volume Kiloton Forecast, by Country 2020 & 2033
- Table 49: Global APAC Cashew Industry Revenue Million Forecast, by Production Analysis 2020 & 2033
- Table 50: Global APAC Cashew Industry Volume Kiloton Forecast, by Production Analysis 2020 & 2033
- Table 51: Global APAC Cashew Industry Revenue Million Forecast, by Consumption Analysis 2020 & 2033
- Table 52: Global APAC Cashew Industry Volume Kiloton Forecast, by Consumption Analysis 2020 & 2033
- Table 53: Global APAC Cashew Industry Revenue Million Forecast, by Import Market Analysis (Value & Volume) 2020 & 2033
- Table 54: Global APAC Cashew Industry Volume Kiloton Forecast, by Import Market Analysis (Value & Volume) 2020 & 2033
- Table 55: Global APAC Cashew Industry Revenue Million Forecast, by Export Market Analysis (Value & Volume) 2020 & 2033
- Table 56: Global APAC Cashew Industry Volume Kiloton Forecast, by Export Market Analysis (Value & Volume) 2020 & 2033
- Table 57: Global APAC Cashew Industry Revenue Million Forecast, by Price Trend Analysis 2020 & 2033
- Table 58: Global APAC Cashew Industry Volume Kiloton Forecast, by Price Trend Analysis 2020 & 2033
- Table 59: Global APAC Cashew Industry Revenue Million Forecast, by Country 2020 & 2033
- Table 60: Global APAC Cashew Industry Volume Kiloton Forecast, by Country 2020 & 2033
- Table 61: Global APAC Cashew Industry Revenue Million Forecast, by Production Analysis 2020 & 2033
- Table 62: Global APAC Cashew Industry Volume Kiloton Forecast, by Production Analysis 2020 & 2033
- Table 63: Global APAC Cashew Industry Revenue Million Forecast, by Consumption Analysis 2020 & 2033
- Table 64: Global APAC Cashew Industry Volume Kiloton Forecast, by Consumption Analysis 2020 & 2033
- Table 65: Global APAC Cashew Industry Revenue Million Forecast, by Import Market Analysis (Value & Volume) 2020 & 2033
- Table 66: Global APAC Cashew Industry Volume Kiloton Forecast, by Import Market Analysis (Value & Volume) 2020 & 2033
- Table 67: Global APAC Cashew Industry Revenue Million Forecast, by Export Market Analysis (Value & Volume) 2020 & 2033
- Table 68: Global APAC Cashew Industry Volume Kiloton Forecast, by Export Market Analysis (Value & Volume) 2020 & 2033
- Table 69: Global APAC Cashew Industry Revenue Million Forecast, by Price Trend Analysis 2020 & 2033
- Table 70: Global APAC Cashew Industry Volume Kiloton Forecast, by Price Trend Analysis 2020 & 2033
- Table 71: Global APAC Cashew Industry Revenue Million Forecast, by Country 2020 & 2033
- Table 72: Global APAC Cashew Industry Volume Kiloton Forecast, by Country 2020 & 2033
- Table 73: Global APAC Cashew Industry Revenue Million Forecast, by Production Analysis 2020 & 2033
- Table 74: Global APAC Cashew Industry Volume Kiloton Forecast, by Production Analysis 2020 & 2033
- Table 75: Global APAC Cashew Industry Revenue Million Forecast, by Consumption Analysis 2020 & 2033
- Table 76: Global APAC Cashew Industry Volume Kiloton Forecast, by Consumption Analysis 2020 & 2033
- Table 77: Global APAC Cashew Industry Revenue Million Forecast, by Import Market Analysis (Value & Volume) 2020 & 2033
- Table 78: Global APAC Cashew Industry Volume Kiloton Forecast, by Import Market Analysis (Value & Volume) 2020 & 2033
- Table 79: Global APAC Cashew Industry Revenue Million Forecast, by Export Market Analysis (Value & Volume) 2020 & 2033
- Table 80: Global APAC Cashew Industry Volume Kiloton Forecast, by Export Market Analysis (Value & Volume) 2020 & 2033
- Table 81: Global APAC Cashew Industry Revenue Million Forecast, by Price Trend Analysis 2020 & 2033
- Table 82: Global APAC Cashew Industry Volume Kiloton Forecast, by Price Trend Analysis 2020 & 2033
- Table 83: Global APAC Cashew Industry Revenue Million Forecast, by Country 2020 & 2033
- Table 84: Global APAC Cashew Industry Volume Kiloton Forecast, by Country 2020 & 2033
- Table 85: Global APAC Cashew Industry Revenue Million Forecast, by Production Analysis 2020 & 2033
- Table 86: Global APAC Cashew Industry Volume Kiloton Forecast, by Production Analysis 2020 & 2033
- Table 87: Global APAC Cashew Industry Revenue Million Forecast, by Consumption Analysis 2020 & 2033
- Table 88: Global APAC Cashew Industry Volume Kiloton Forecast, by Consumption Analysis 2020 & 2033
- Table 89: Global APAC Cashew Industry Revenue Million Forecast, by Import Market Analysis (Value & Volume) 2020 & 2033
- Table 90: Global APAC Cashew Industry Volume Kiloton Forecast, by Import Market Analysis (Value & Volume) 2020 & 2033
- Table 91: Global APAC Cashew Industry Revenue Million Forecast, by Export Market Analysis (Value & Volume) 2020 & 2033
- Table 92: Global APAC Cashew Industry Volume Kiloton Forecast, by Export Market Analysis (Value & Volume) 2020 & 2033
- Table 93: Global APAC Cashew Industry Revenue Million Forecast, by Price Trend Analysis 2020 & 2033
- Table 94: Global APAC Cashew Industry Volume Kiloton Forecast, by Price Trend Analysis 2020 & 2033
- Table 95: Global APAC Cashew Industry Revenue Million Forecast, by Country 2020 & 2033
- Table 96: Global APAC Cashew Industry Volume Kiloton Forecast, by Country 2020 & 2033
Frequently Asked Questions
1. What is the projected Compound Annual Growth Rate (CAGR) of the APAC Cashew Industry?
The projected CAGR is approximately 4.44%.
2. Which companies are prominent players in the APAC Cashew Industry?
Key companies in the market include Olam International, Nutreco, Vietnam Cashew Association , All India Cashew Processors and Exporters Association, Sime Darby Oils .
3. What are the main segments of the APAC Cashew Industry?
The market segments include Production Analysis, Consumption Analysis, Import Market Analysis (Value & Volume), Export Market Analysis (Value & Volume), Price Trend Analysis.
4. Can you provide details about the market size?
The market size is estimated to be USD 7.26 Million as of 2022.
5. What are some drivers contributing to market growth?
Rising Consumption of Cashew Nuts as a Healthy Snack; Increasing Government initiatives; Growing Cashew Nut Imports in The United States.
6. What are the notable trends driving market growth?
Increased Cashew Application in Food Industry to boost the Market.
7. Are there any restraints impacting market growth?
Hazardous Climatic Condition Hinders Cashew Production; Stringent Regulations Related To Food Quality Standards.
8. Can you provide examples of recent developments in the market?
January 2023: According to CRISIL (an Indian consulting firm offering ratings, analysis, risk, and policy advice) and a branch of S&P Global, the Indian cashew processing industry is driving demand for cashews, which extended beyond USD 300,000 million in 2022, an increase of 15% year-on-year growth in revenue.
9. What pricing options are available for accessing the report?
Pricing options include single-user, multi-user, and enterprise licenses priced at USD 4750, USD 5250, and USD 8750 respectively.
10. Is the market size provided in terms of value or volume?
The market size is provided in terms of value, measured in Million and volume, measured in Kiloton.
11. Are there any specific market keywords associated with the report?
Yes, the market keyword associated with the report is "APAC Cashew Industry," which aids in identifying and referencing the specific market segment covered.
12. How do I determine which pricing option suits my needs best?
The pricing options vary based on user requirements and access needs. Individual users may opt for single-user licenses, while businesses requiring broader access may choose multi-user or enterprise licenses for cost-effective access to the report.
13. Are there any additional resources or data provided in the APAC Cashew Industry report?
While the report offers comprehensive insights, it's advisable to review the specific contents or supplementary materials provided to ascertain if additional resources or data are available.
14. How can I stay updated on further developments or reports in the APAC Cashew Industry?
To stay informed about further developments, trends, and reports in the APAC Cashew Industry, consider subscribing to industry newsletters, following relevant companies and organizations, or regularly checking reputable industry news sources and publications.
Methodology
Step 1 - Identification of Relevant Samples Size from Population Database


Step 2 - Approaches for Defining Global Market Size (Value, Volume* & Price*)

Note*: In applicable scenarios
Step 3 - Data Sources
Primary Research
- Web Analytics
- Survey Reports
- Research Institute
- Latest Research Reports
- Opinion Leaders
Secondary Research
- Annual Reports
- White Paper
- Latest Press Release
- Industry Association
- Paid Database
- Investor Presentations

Step 4 - Data Triangulation
Involves using different sources of information in order to increase the validity of a study
These sources are likely to be stakeholders in a program - participants, other researchers, program staff, other community members, and so on.
Then we put all data in single framework & apply various statistical tools to find out the dynamic on the market.
During the analysis stage, feedback from the stakeholder groups would be compared to determine areas of agreement as well as areas of divergence