

Key Insights
The global Astronomy Apps market is poised for significant expansion, projected to reach an estimated $1.71 billion in 2024, driven by a remarkable 15% CAGR over the forecast period. This robust growth is fueled by increasing smartphone penetration, a burgeoning interest in space exploration among the general public, and advancements in augmented reality (AR) and virtual reality (VR) technologies that enhance the user experience. Educational institutions and amateur astronomers are increasingly relying on these sophisticated tools for celestial observation, identification, and learning, creating a substantial demand. The proliferation of affordable smartphones and the availability of advanced sensors further democratize access to astronomical data and visualizations, making the night sky more accessible than ever.
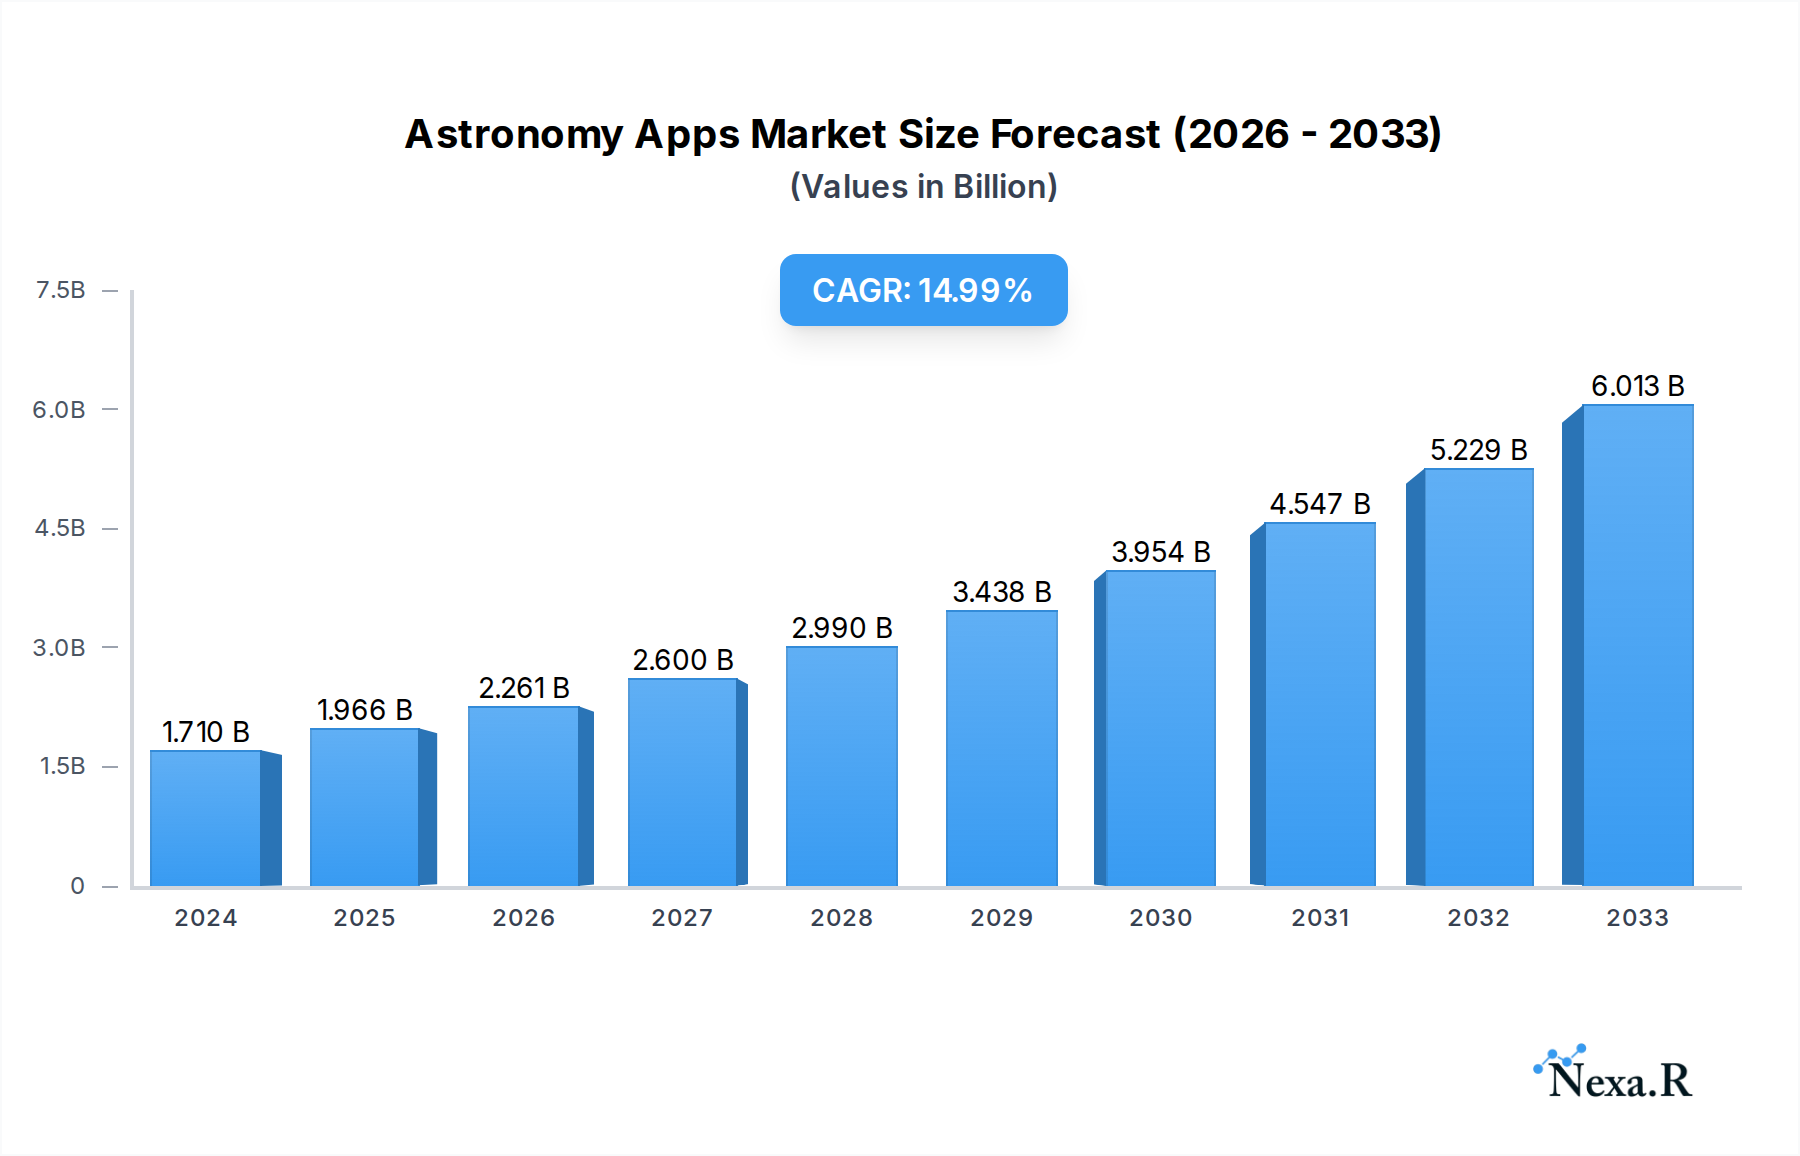
Astronomy Apps Market Size (In Billion)
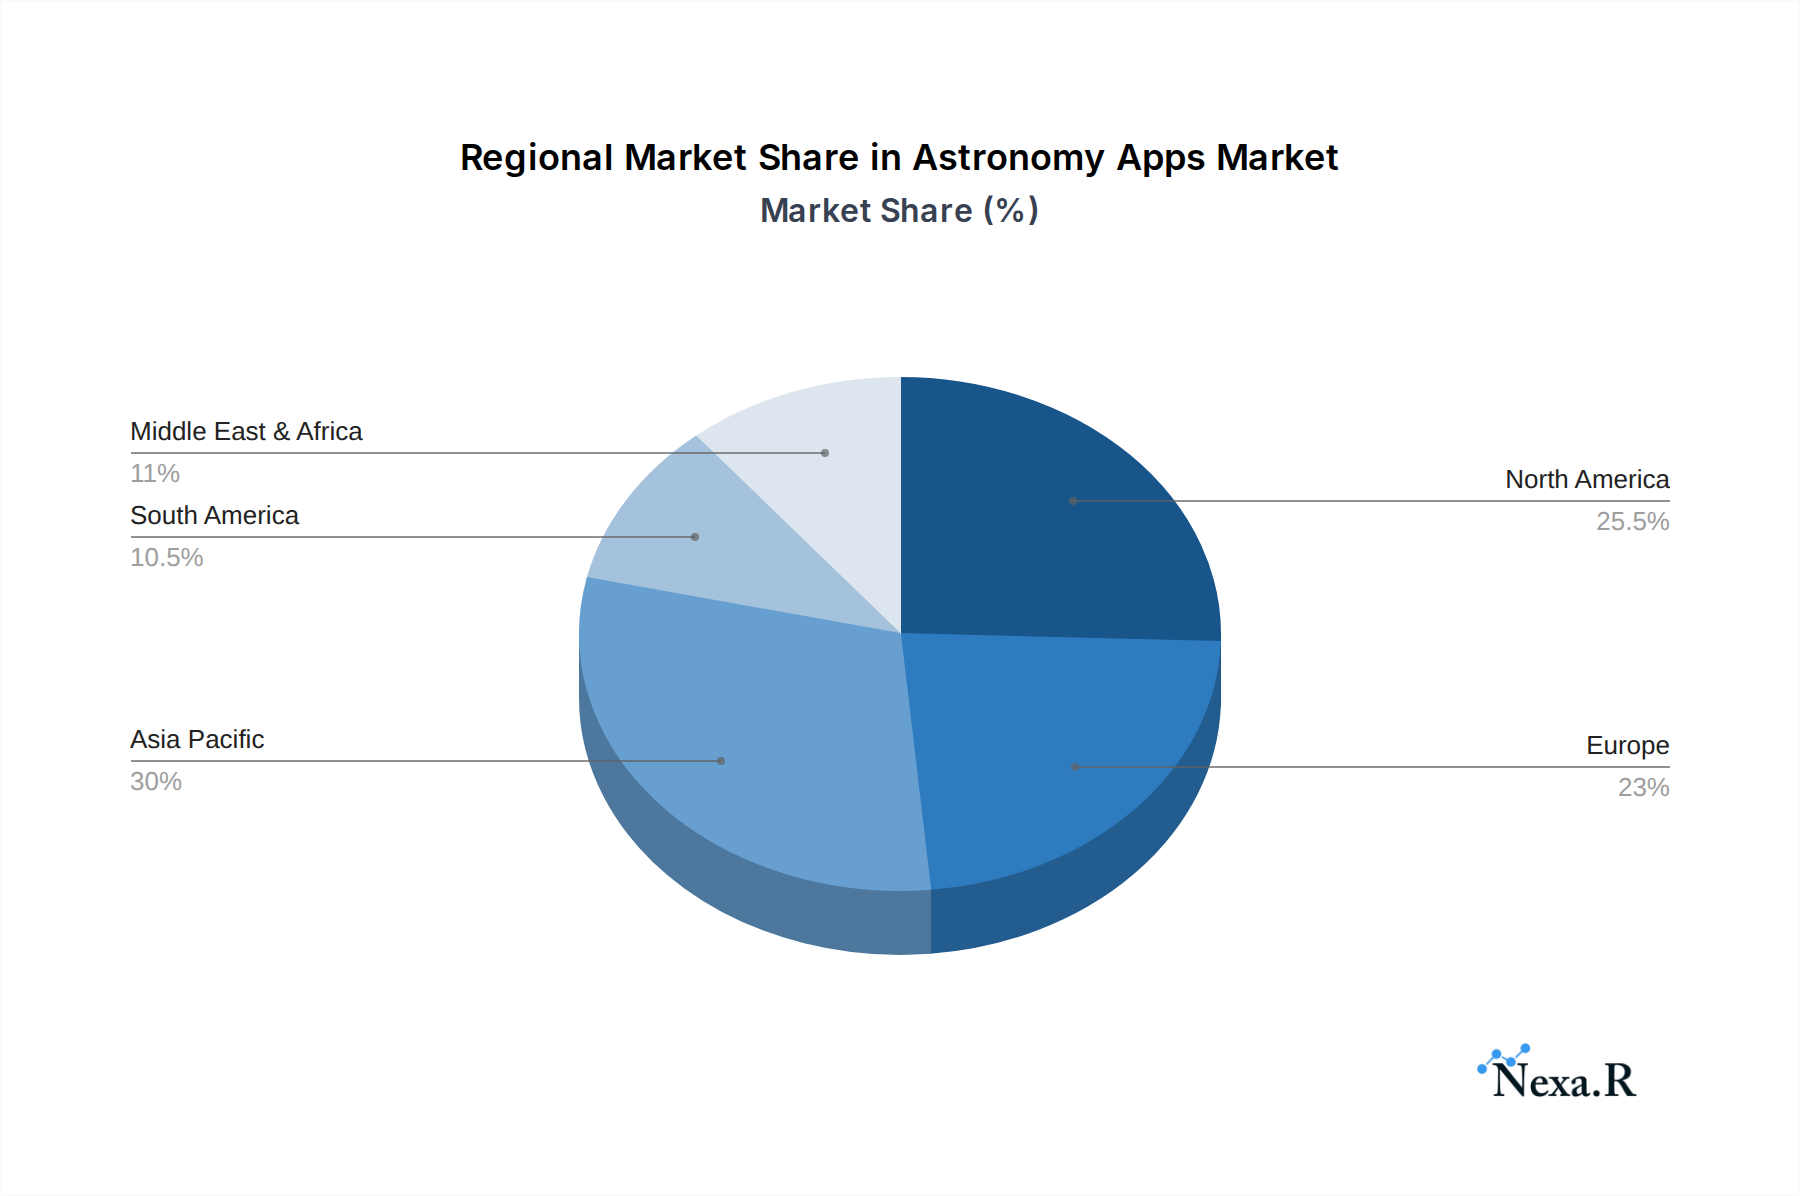
The market is segmented across diverse applications, including private users and commercial entities, with Android and iOS dominating the platform landscape. Key players like Google, Vito Technology, and Realtech VR are at the forefront of innovation, introducing features such as real-time sky mapping, planetarium simulations, and even citizen science integration. While the market enjoys strong growth drivers, potential restraints such as the need for continuous technological updates and ensuring data accuracy for a broad user base are being addressed through ongoing research and development. Regional dominance is anticipated in Asia Pacific, driven by its massive population and rapidly growing smartphone user base, followed by North America and Europe, where established interest in astronomy and advanced technological adoption are prevalent. The Middle East & Africa and South America also present emerging opportunities for market expansion.

Astronomy Apps Company Market Share
Astronomy Apps Market Dynamics & Structure
The global astronomy apps market is characterized by moderate concentration, with key players like Google, Terminal Eleven, and Vito Technology holding significant sway. Technological innovation acts as a primary driver, fueled by advancements in augmented reality (AR), virtual reality (VR), and real-time astronomical data feeds. Regulatory frameworks are generally supportive, focusing on data privacy and app store guidelines, though potential future regulations around advanced astronomical data access could emerge. Competitive product substitutes include traditional telescopes, planetarium shows, and educational websites. End-user demographics are broad, encompassing amateur astronomers, educators, students, and casual enthusiasts. Mergers and acquisitions (M&A) activity is present but not pervasive, with smaller innovative companies being potential acquisition targets for larger tech firms looking to expand their AR/VR or educational portfolios.
- Market Concentration: Moderate, with a few dominant players and a substantial long-tail of smaller developers.
- Technological Innovation Drivers: AR/VR integration, AI-powered object identification, real-time satellite tracking, and improved celestial visualization.
- Regulatory Frameworks: Primarily app store policies, data privacy laws, and potentially future regulations concerning astronomical data.
- Competitive Product Substitutes: Telescopes, physical star charts, planetarium visits, educational websites, and immersive VR experiences outside of dedicated apps.
- End-User Demographics: Wide-ranging, from casual users to professional educators and serious hobbyists.
- M&A Trends: Ongoing, with potential for larger tech companies to acquire specialized astronomy app developers.
Astronomy Apps Growth Trends & Insights
The astronomy apps market is poised for substantial expansion, projected to grow from an estimated $1.5 billion in 2024 to $3.8 billion by 2033, exhibiting a robust Compound Annual Growth Rate (CAGR) of approximately 10.5% during the forecast period (2025-2033). This growth is underpinned by increasing smartphone penetration globally and a burgeoning public interest in space exploration, spurred by commercial space ventures and visually stunning space imagery. Adoption rates are steadily climbing, particularly among younger demographics who are digitally native and actively seek engaging, educational content. Technological disruptions, such as the integration of advanced AR capabilities that overlay constellations and celestial objects onto the live sky view, are revolutionizing the user experience, making complex astronomical information accessible and intuitive. Consumer behavior shifts are evident, with a growing preference for interactive, personalized learning tools and a demand for real-time data on celestial events like meteor showers, eclipses, and satellite passes. The market penetration of astronomy apps is expected to deepen as developers continue to enhance features, improve accuracy, and cater to a wider range of user needs, from basic stargazing to in-depth astronomical research. The increasing availability of high-resolution astronomical data and the integration of AI for object recognition and predictive analysis will further accelerate this adoption.
Dominant Regions, Countries, or Segments in Astronomy Apps
The Android segment is currently the dominant force within the astronomy apps market, driven by its widespread global adoption, particularly in emerging economies, and its open platform enabling a vast array of developers. North America, spearheaded by the United States, represents the leading region due to a combination of high disposable incomes, a strong culture of technological adoption, and significant public interest in space science, fueled by NASA's ongoing missions and a thriving private space industry. The Private Users segment contributes the lion's share of revenue and user base, reflecting the widespread appeal of stargazing and astronomical education as a hobby and learning tool. Countries with advanced technological infrastructure and a strong educational focus, such as Germany, Japan, and South Korea, also exhibit significant market presence.
Dominant Segment (Type): Android
- Drivers: Higher global market share, open platform fostering diverse app development, affordability, and extensive device compatibility.
- Market Share: Estimated to hold over 60% of the global market.
- Growth Potential: Strong, especially in developing regions where Android is the primary smartphone OS.
Dominant Region: North America (primarily USA)
- Drivers: High disposable income, strong interest in space exploration (NASA, SpaceX), advanced technological adoption, and robust educational institutions.
- Market Share: Accounts for approximately 35% of the global market.
- Growth Potential: Steady, driven by continuous innovation and a dedicated user base.
Dominant Segment (Application): Private Users
- Drivers: Broad appeal for education, entertainment, and hobbyist stargazing.
- Market Share: Over 70% of the overall user base.
- Growth Potential: Significant, driven by increasing casual interest and desire for accessible space education.
Astronomy Apps Product Landscape
The astronomy apps product landscape is evolving rapidly, characterized by an increasing sophistication in visualization and functionality. Innovations like real-time satellite tracking, AR overlays for identifying celestial bodies, and detailed 3D models of planets and galaxies are becoming standard features. Apps such as ISS Detector, Star Walk 2 by Vito Technology, and SkyView® by Terminal Eleven exemplify this trend, offering intuitive interfaces that transform smartphones into powerful stargazing tools. Performance metrics are measured by accuracy of celestial object data, responsiveness of AR tracking, clarity of visuals, and the breadth of their astronomical databases. Unique selling propositions often revolve around personalized notifications for astronomical events, integration with smart telescopes, and community features for sharing observations.
Key Drivers, Barriers & Challenges in Astronomy Apps
Key Drivers:
- Technological Advancements: Integration of AR/VR, AI-powered object recognition, and enhanced sensor capabilities in smartphones.
- Growing Public Interest: Increased fascination with space exploration, exoplanets, and cosmic phenomena, amplified by media coverage and commercial spaceflight.
- Educational Utility: Demand for accessible and engaging learning tools for students and educators across all age groups.
- Smartphone Penetration: Ubiquitous availability of smartphones with powerful processors and high-resolution displays.
Key Barriers & Challenges:
- Market Saturation: A crowded app store environment with numerous free and paid astronomy apps, making differentiation challenging.
- Monetization Strategies: Balancing free offerings with compelling premium features to attract and retain paying users.
- Data Accuracy & Updates: Maintaining highly accurate and up-to-date astronomical data requires continuous effort and resources.
- Competition from Dedicated Hardware: Traditional telescopes and specialized astronomical equipment still cater to serious enthusiasts.
- User Interface Complexity: Developing intuitive interfaces for advanced features can be a hurdle for casual users.
- Discovery Challenges: Ensuring visibility within app stores amidst millions of other applications.
Emerging Opportunities in Astronomy Apps
Emerging opportunities in the astronomy apps sector lie in the deeper integration of AI for personalized celestial event predictions and automated astrophotography assistance. The development of more immersive VR astronomy experiences that go beyond simple planetarium simulations, perhaps incorporating interactive space missions, presents a significant untapped market. Furthermore, catering to the rapidly growing segment of citizen scientists through enhanced data contribution and analysis features within apps, such as those from Sanville Software or Realtech VR, offers substantial growth potential. Partnerships with educational institutions for curriculum integration and collaborations with space agencies for real-time mission data will also unlock new avenues.
Growth Accelerators in the Astronomy Apps Industry
Growth accelerators for the astronomy apps industry include the continuous miniaturization and enhancement of smartphone camera technology, enabling higher-quality mobile astrophotography. Strategic partnerships between app developers like ICandi Apps and hardware manufacturers will drive innovation in integrated stargazing experiences. The increasing accessibility of space imagery and data from missions like the James Webb Space Telescope, disseminated through user-friendly app interfaces, will fuel sustained public interest. Furthermore, the burgeoning virtual and augmented reality markets provide fertile ground for developing next-generation, deeply engaging astronomy applications.
Key Players Shaping the Astronomy Apps Market
- Terminal Eleven
- Vito Technology
- ICandi Apps
- Sanville Software
- Realtech VR
- Kvasha Software
- Kinetic Stars
- Escapist Games
- GoSoftWorks
- ISS Detector
Notable Milestones in Astronomy Apps Sector
- 2019: Increased adoption of ARKit and ARCore, leading to more sophisticated AR stargazing apps.
- 2020: Enhanced integration of real-time ISS tracking data into popular astronomy apps.
- 2021: Emergence of AI-powered object identification features in several leading applications.
- 2022: Significant advancements in mobile astrophotography capabilities, allowing users to capture clearer images of celestial objects.
- 2023: Growing interest and integration of VR-based astronomical experiences beyond basic planetarium simulations.
- 2024 (Estimated): Continued focus on personalized user experiences and community-driven features, alongside potential for deeper commercial applications in navigation and remote sensing.
In-Depth Astronomy Apps Market Outlook
The future outlook for the astronomy apps market is exceptionally promising, driven by a confluence of accelerating factors. Continued innovation in AR/VR technologies will pave the way for truly immersive and interactive cosmic explorations, moving beyond passive viewing to active participation. Strategic alliances between app developers like Kvasha Software and Kinetic Stars with leading tech giants will further democratize access to advanced astronomical data and visualization tools. The increasing commoditization of high-performance mobile devices will ensure that the processing power required for these sophisticated applications is widely available. Furthermore, the sustained global fascination with space, fueled by both scientific discovery and popular culture, provides a robust and enduring demand for engaging and informative astronomy apps.
Astronomy Apps Segmentation
-
1. Application
- 1.1. Private Users
- 1.2. Commercial Users
-
2. Type
- 2.1. Android
- 2.2. IOS
- 2.3. Others
Astronomy Apps Segmentation By Geography
-
1. North America
- 1.1. United States
- 1.2. Canada
- 1.3. Mexico
-
2. South America
- 2.1. Brazil
- 2.2. Argentina
- 2.3. Rest of South America
-
3. Europe
- 3.1. United Kingdom
- 3.2. Germany
- 3.3. France
- 3.4. Italy
- 3.5. Spain
- 3.6. Russia
- 3.7. Benelux
- 3.8. Nordics
- 3.9. Rest of Europe
-
4. Middle East & Africa
- 4.1. Turkey
- 4.2. Israel
- 4.3. GCC
- 4.4. North Africa
- 4.5. South Africa
- 4.6. Rest of Middle East & Africa
-
5. Asia Pacific
- 5.1. China
- 5.2. India
- 5.3. Japan
- 5.4. South Korea
- 5.5. ASEAN
- 5.6. Oceania
- 5.7. Rest of Asia Pacific
Astronomy Apps Regional Market Share
Geographic Coverage of Astronomy Apps
Astronomy Apps REPORT HIGHLIGHTS
| Aspects | Details |
|---|---|
| Study Period | 2020-2034 |
| Base Year | 2025 |
| Estimated Year | 2026 |
| Forecast Period | 2026-2034 |
| Historical Period | 2020-2025 |
| Growth Rate | CAGR of 6.2% from 2020-2034 |
| Segmentation |
|
Table of Contents
- 1. Introduction
- 1.1. Research Scope
- 1.2. Market Segmentation
- 1.3. Research Objective
- 1.4. Definitions and Assumptions
- 2. Executive Summary
- 2.1. Market Snapshot
- 3. Market Dynamics
- 3.1. Market Drivers
- 3.2. Market Restrains
- 3.3. Market Trends
- 3.4. Market Opportunities
- 4. Market Factor Analysis
- 4.1. Porters Five Forces
- 4.1.1. Bargaining Power of Suppliers
- 4.1.2. Bargaining Power of Buyers
- 4.1.3. Threat of New Entrants
- 4.1.4. Threat of Substitutes
- 4.1.5. Competitive Rivalry
- 4.2. PESTEL analysis
- 4.3. BCG Analysis
- 4.3.1. Stars (High Growth, High Market Share)
- 4.3.2. Cash Cows (Low Growth, High Market Share)
- 4.3.3. Question Mark (High Growth, Low Market Share)
- 4.3.4. Dogs (Low Growth, Low Market Share)
- 4.4. Ansoff Matrix Analysis
- 4.5. Supply Chain Analysis
- 4.6. Regulatory Landscape
- 4.7. Current Market Potential and Opportunity Assessment (TAM–SAM–SOM Framework)
- 4.8. NRP Analyst Note
- 4.1. Porters Five Forces
- 5. Market Analysis, Insights and Forecast 2021-2033
- 5.1. Market Analysis, Insights and Forecast - by Application
- 5.1.1. Private Users
- 5.1.2. Commercial Users
- 5.2. Market Analysis, Insights and Forecast - by Type
- 5.2.1. Android
- 5.2.2. IOS
- 5.2.3. Others
- 5.3. Market Analysis, Insights and Forecast - by Region
- 5.3.1. North America
- 5.3.2. South America
- 5.3.3. Europe
- 5.3.4. Middle East & Africa
- 5.3.5. Asia Pacific
- 5.1. Market Analysis, Insights and Forecast - by Application
- 6. Global Astronomy Apps Analysis, Insights and Forecast, 2021-2033
- 6.1. Market Analysis, Insights and Forecast - by Application
- 6.1.1. Private Users
- 6.1.2. Commercial Users
- 6.2. Market Analysis, Insights and Forecast - by Type
- 6.2.1. Android
- 6.2.2. IOS
- 6.2.3. Others
- 6.1. Market Analysis, Insights and Forecast - by Application
- 7. North America Astronomy Apps Analysis, Insights and Forecast, 2020-2032
- 7.1. Market Analysis, Insights and Forecast - by Application
- 7.1.1. Private Users
- 7.1.2. Commercial Users
- 7.2. Market Analysis, Insights and Forecast - by Type
- 7.2.1. Android
- 7.2.2. IOS
- 7.2.3. Others
- 7.1. Market Analysis, Insights and Forecast - by Application
- 8. South America Astronomy Apps Analysis, Insights and Forecast, 2020-2032
- 8.1. Market Analysis, Insights and Forecast - by Application
- 8.1.1. Private Users
- 8.1.2. Commercial Users
- 8.2. Market Analysis, Insights and Forecast - by Type
- 8.2.1. Android
- 8.2.2. IOS
- 8.2.3. Others
- 8.1. Market Analysis, Insights and Forecast - by Application
- 9. Europe Astronomy Apps Analysis, Insights and Forecast, 2020-2032
- 9.1. Market Analysis, Insights and Forecast - by Application
- 9.1.1. Private Users
- 9.1.2. Commercial Users
- 9.2. Market Analysis, Insights and Forecast - by Type
- 9.2.1. Android
- 9.2.2. IOS
- 9.2.3. Others
- 9.1. Market Analysis, Insights and Forecast - by Application
- 10. Middle East & Africa Astronomy Apps Analysis, Insights and Forecast, 2020-2032
- 10.1. Market Analysis, Insights and Forecast - by Application
- 10.1.1. Private Users
- 10.1.2. Commercial Users
- 10.2. Market Analysis, Insights and Forecast - by Type
- 10.2.1. Android
- 10.2.2. IOS
- 10.2.3. Others
- 10.1. Market Analysis, Insights and Forecast - by Application
- 11. Asia Pacific Astronomy Apps Analysis, Insights and Forecast, 2020-2032
- 11.1. Market Analysis, Insights and Forecast - by Application
- 11.1.1. Private Users
- 11.1.2. Commercial Users
- 11.2. Market Analysis, Insights and Forecast - by Type
- 11.2.1. Android
- 11.2.2. IOS
- 11.2.3. Others
- 11.1. Market Analysis, Insights and Forecast - by Application
- 12. Competitive Analysis
- 12.1. Company Profiles
- 12.1.1 Terminal Eleven
- 12.1.1.1. Company Overview
- 12.1.1.2. Products
- 12.1.1.3. Company Financials
- 12.1.1.4. SWOT Analysis
- 12.1.2 Vito Technology
- 12.1.2.1. Company Overview
- 12.1.2.2. Products
- 12.1.2.3. Company Financials
- 12.1.2.4. SWOT Analysis
- 12.1.3 ICandi Apps
- 12.1.3.1. Company Overview
- 12.1.3.2. Products
- 12.1.3.3. Company Financials
- 12.1.3.4. SWOT Analysis
- 12.1.4 Sanville Software
- 12.1.4.1. Company Overview
- 12.1.4.2. Products
- 12.1.4.3. Company Financials
- 12.1.4.4. SWOT Analysis
- 12.1.5 Realtech VR
- 12.1.5.1. Company Overview
- 12.1.5.2. Products
- 12.1.5.3. Company Financials
- 12.1.5.4. SWOT Analysis
- 12.1.6 Kvasha Software
- 12.1.6.1. Company Overview
- 12.1.6.2. Products
- 12.1.6.3. Company Financials
- 12.1.6.4. SWOT Analysis
- 12.1.7 Kinetic Stars
- 12.1.7.1. Company Overview
- 12.1.7.2. Products
- 12.1.7.3. Company Financials
- 12.1.7.4. SWOT Analysis
- 12.1.8 Escapist Games
- 12.1.8.1. Company Overview
- 12.1.8.2. Products
- 12.1.8.3. Company Financials
- 12.1.8.4. SWOT Analysis
- 12.1.9 GoSoftWorks
- 12.1.9.1. Company Overview
- 12.1.9.2. Products
- 12.1.9.3. Company Financials
- 12.1.9.4. SWOT Analysis
- 12.1.10 ISS Detector
- 12.1.10.1. Company Overview
- 12.1.10.2. Products
- 12.1.10.3. Company Financials
- 12.1.10.4. SWOT Analysis
- 12.1.11 Google
- 12.1.11.1. Company Overview
- 12.1.11.2. Products
- 12.1.11.3. Company Financials
- 12.1.11.4. SWOT Analysis
- 12.1.1 Terminal Eleven
- 12.2. Market Entropy
- 12.2.1 Company's Key Areas Served
- 12.2.2 Recent Developments
- 12.3. Company Market Share Analysis 2025
- 12.3.1 Top 5 Companies Market Share Analysis
- 12.3.2 Top 3 Companies Market Share Analysis
- 12.4. List of Potential Customers
- 13. Research Methodology
List of Figures
- Figure 1: Global Astronomy Apps Revenue Breakdown (undefined, %) by Region 2025 & 2033
- Figure 2: North America Astronomy Apps Revenue (undefined), by Application 2025 & 2033
- Figure 3: North America Astronomy Apps Revenue Share (%), by Application 2025 & 2033
- Figure 4: North America Astronomy Apps Revenue (undefined), by Type 2025 & 2033
- Figure 5: North America Astronomy Apps Revenue Share (%), by Type 2025 & 2033
- Figure 6: North America Astronomy Apps Revenue (undefined), by Country 2025 & 2033
- Figure 7: North America Astronomy Apps Revenue Share (%), by Country 2025 & 2033
- Figure 8: South America Astronomy Apps Revenue (undefined), by Application 2025 & 2033
- Figure 9: South America Astronomy Apps Revenue Share (%), by Application 2025 & 2033
- Figure 10: South America Astronomy Apps Revenue (undefined), by Type 2025 & 2033
- Figure 11: South America Astronomy Apps Revenue Share (%), by Type 2025 & 2033
- Figure 12: South America Astronomy Apps Revenue (undefined), by Country 2025 & 2033
- Figure 13: South America Astronomy Apps Revenue Share (%), by Country 2025 & 2033
- Figure 14: Europe Astronomy Apps Revenue (undefined), by Application 2025 & 2033
- Figure 15: Europe Astronomy Apps Revenue Share (%), by Application 2025 & 2033
- Figure 16: Europe Astronomy Apps Revenue (undefined), by Type 2025 & 2033
- Figure 17: Europe Astronomy Apps Revenue Share (%), by Type 2025 & 2033
- Figure 18: Europe Astronomy Apps Revenue (undefined), by Country 2025 & 2033
- Figure 19: Europe Astronomy Apps Revenue Share (%), by Country 2025 & 2033
- Figure 20: Middle East & Africa Astronomy Apps Revenue (undefined), by Application 2025 & 2033
- Figure 21: Middle East & Africa Astronomy Apps Revenue Share (%), by Application 2025 & 2033
- Figure 22: Middle East & Africa Astronomy Apps Revenue (undefined), by Type 2025 & 2033
- Figure 23: Middle East & Africa Astronomy Apps Revenue Share (%), by Type 2025 & 2033
- Figure 24: Middle East & Africa Astronomy Apps Revenue (undefined), by Country 2025 & 2033
- Figure 25: Middle East & Africa Astronomy Apps Revenue Share (%), by Country 2025 & 2033
- Figure 26: Asia Pacific Astronomy Apps Revenue (undefined), by Application 2025 & 2033
- Figure 27: Asia Pacific Astronomy Apps Revenue Share (%), by Application 2025 & 2033
- Figure 28: Asia Pacific Astronomy Apps Revenue (undefined), by Type 2025 & 2033
- Figure 29: Asia Pacific Astronomy Apps Revenue Share (%), by Type 2025 & 2033
- Figure 30: Asia Pacific Astronomy Apps Revenue (undefined), by Country 2025 & 2033
- Figure 31: Asia Pacific Astronomy Apps Revenue Share (%), by Country 2025 & 2033
List of Tables
- Table 1: Global Astronomy Apps Revenue undefined Forecast, by Application 2020 & 2033
- Table 2: Global Astronomy Apps Revenue undefined Forecast, by Type 2020 & 2033
- Table 3: Global Astronomy Apps Revenue undefined Forecast, by Region 2020 & 2033
- Table 4: Global Astronomy Apps Revenue undefined Forecast, by Application 2020 & 2033
- Table 5: Global Astronomy Apps Revenue undefined Forecast, by Type 2020 & 2033
- Table 6: Global Astronomy Apps Revenue undefined Forecast, by Country 2020 & 2033
- Table 7: United States Astronomy Apps Revenue (undefined) Forecast, by Application 2020 & 2033
- Table 8: Canada Astronomy Apps Revenue (undefined) Forecast, by Application 2020 & 2033
- Table 9: Mexico Astronomy Apps Revenue (undefined) Forecast, by Application 2020 & 2033
- Table 10: Global Astronomy Apps Revenue undefined Forecast, by Application 2020 & 2033
- Table 11: Global Astronomy Apps Revenue undefined Forecast, by Type 2020 & 2033
- Table 12: Global Astronomy Apps Revenue undefined Forecast, by Country 2020 & 2033
- Table 13: Brazil Astronomy Apps Revenue (undefined) Forecast, by Application 2020 & 2033
- Table 14: Argentina Astronomy Apps Revenue (undefined) Forecast, by Application 2020 & 2033
- Table 15: Rest of South America Astronomy Apps Revenue (undefined) Forecast, by Application 2020 & 2033
- Table 16: Global Astronomy Apps Revenue undefined Forecast, by Application 2020 & 2033
- Table 17: Global Astronomy Apps Revenue undefined Forecast, by Type 2020 & 2033
- Table 18: Global Astronomy Apps Revenue undefined Forecast, by Country 2020 & 2033
- Table 19: United Kingdom Astronomy Apps Revenue (undefined) Forecast, by Application 2020 & 2033
- Table 20: Germany Astronomy Apps Revenue (undefined) Forecast, by Application 2020 & 2033
- Table 21: France Astronomy Apps Revenue (undefined) Forecast, by Application 2020 & 2033
- Table 22: Italy Astronomy Apps Revenue (undefined) Forecast, by Application 2020 & 2033
- Table 23: Spain Astronomy Apps Revenue (undefined) Forecast, by Application 2020 & 2033
- Table 24: Russia Astronomy Apps Revenue (undefined) Forecast, by Application 2020 & 2033
- Table 25: Benelux Astronomy Apps Revenue (undefined) Forecast, by Application 2020 & 2033
- Table 26: Nordics Astronomy Apps Revenue (undefined) Forecast, by Application 2020 & 2033
- Table 27: Rest of Europe Astronomy Apps Revenue (undefined) Forecast, by Application 2020 & 2033
- Table 28: Global Astronomy Apps Revenue undefined Forecast, by Application 2020 & 2033
- Table 29: Global Astronomy Apps Revenue undefined Forecast, by Type 2020 & 2033
- Table 30: Global Astronomy Apps Revenue undefined Forecast, by Country 2020 & 2033
- Table 31: Turkey Astronomy Apps Revenue (undefined) Forecast, by Application 2020 & 2033
- Table 32: Israel Astronomy Apps Revenue (undefined) Forecast, by Application 2020 & 2033
- Table 33: GCC Astronomy Apps Revenue (undefined) Forecast, by Application 2020 & 2033
- Table 34: North Africa Astronomy Apps Revenue (undefined) Forecast, by Application 2020 & 2033
- Table 35: South Africa Astronomy Apps Revenue (undefined) Forecast, by Application 2020 & 2033
- Table 36: Rest of Middle East & Africa Astronomy Apps Revenue (undefined) Forecast, by Application 2020 & 2033
- Table 37: Global Astronomy Apps Revenue undefined Forecast, by Application 2020 & 2033
- Table 38: Global Astronomy Apps Revenue undefined Forecast, by Type 2020 & 2033
- Table 39: Global Astronomy Apps Revenue undefined Forecast, by Country 2020 & 2033
- Table 40: China Astronomy Apps Revenue (undefined) Forecast, by Application 2020 & 2033
- Table 41: India Astronomy Apps Revenue (undefined) Forecast, by Application 2020 & 2033
- Table 42: Japan Astronomy Apps Revenue (undefined) Forecast, by Application 2020 & 2033
- Table 43: South Korea Astronomy Apps Revenue (undefined) Forecast, by Application 2020 & 2033
- Table 44: ASEAN Astronomy Apps Revenue (undefined) Forecast, by Application 2020 & 2033
- Table 45: Oceania Astronomy Apps Revenue (undefined) Forecast, by Application 2020 & 2033
- Table 46: Rest of Asia Pacific Astronomy Apps Revenue (undefined) Forecast, by Application 2020 & 2033
Frequently Asked Questions
1. What is the projected Compound Annual Growth Rate (CAGR) of the Astronomy Apps?
The projected CAGR is approximately 6.2%.
2. Which companies are prominent players in the Astronomy Apps?
Key companies in the market include Terminal Eleven, Vito Technology, ICandi Apps, Sanville Software, Realtech VR, Kvasha Software, Kinetic Stars, Escapist Games, GoSoftWorks, ISS Detector, Google.
3. What are the main segments of the Astronomy Apps?
The market segments include Application, Type.
4. Can you provide details about the market size?
The market size is estimated to be USD XXX N/A as of 2022.
5. What are some drivers contributing to market growth?
N/A
6. What are the notable trends driving market growth?
N/A
7. Are there any restraints impacting market growth?
N/A
8. Can you provide examples of recent developments in the market?
N/A
9. What pricing options are available for accessing the report?
Pricing options include single-user, multi-user, and enterprise licenses priced at USD 3950.00, USD 5925.00, and USD 7900.00 respectively.
10. Is the market size provided in terms of value or volume?
The market size is provided in terms of value, measured in N/A.
11. Are there any specific market keywords associated with the report?
Yes, the market keyword associated with the report is "Astronomy Apps," which aids in identifying and referencing the specific market segment covered.
12. How do I determine which pricing option suits my needs best?
The pricing options vary based on user requirements and access needs. Individual users may opt for single-user licenses, while businesses requiring broader access may choose multi-user or enterprise licenses for cost-effective access to the report.
13. Are there any additional resources or data provided in the Astronomy Apps report?
While the report offers comprehensive insights, it's advisable to review the specific contents or supplementary materials provided to ascertain if additional resources or data are available.
14. How can I stay updated on further developments or reports in the Astronomy Apps?
To stay informed about further developments, trends, and reports in the Astronomy Apps, consider subscribing to industry newsletters, following relevant companies and organizations, or regularly checking reputable industry news sources and publications.
Methodology
Step 1 - Identification of Relevant Samples Size from Population Database


Step 2 - Approaches for Defining Global Market Size (Value, Volume* & Price*)

Note*: In applicable scenarios
Step 3 - Data Sources
Primary Research
- Web Analytics
- Survey Reports
- Research Institute
- Latest Research Reports
- Opinion Leaders
Secondary Research
- Annual Reports
- White Paper
- Latest Press Release
- Industry Association
- Paid Database
- Investor Presentations

Step 4 - Data Triangulation
Involves using different sources of information in order to increase the validity of a study
These sources are likely to be stakeholders in a program - participants, other researchers, program staff, other community members, and so on.
Then we put all data in single framework & apply various statistical tools to find out the dynamic on the market.
During the analysis stage, feedback from the stakeholder groups would be compared to determine areas of agreement as well as areas of divergence